Overview
Queensland's growth relies on strong infrastructure investment, which drives economic development and helps improve our standard of living. To support this, the Queensland Government allocates significant funding for major projects. However, challenges such as workforce constraints and supply cost pressures must be managed to ensure the effective delivery of Queensland’s growing capital program.
Tabled 17 December 2025.

Report on a page
Queensland is delivering a large infrastructure program to meet long-term growth needs across the state. All 3 levels of government continue to allocate significant funding each year to support this infrastructure pipeline. The Queensland Government sets out proposed state-funded projects in its annual budget capital statement (Budget Paper 3). On 15 December 2025, the state released its Mid-Year Economic and Fiscal Outlook. Because the capital budget is not significantly different from the 2025–26 budget, we have not updated this report. This report provides insights into Queensland’s significant infrastructure projects and analyses costs to the Queensland Government.
Queensland’s capital program continues to grow
Over the next 4 years, the government expects to spend $116.8 billion on capital projects, an increase of $9.5 billion from the 2024–25 budget. The capital statement also sets out the total estimated costs of projects, including actual spend to date, budget 2025–26 spend, and forecast post 2025–26 spend. In the 2025–26 capital statement, projects have a total estimated cost of $153 billion, compared with $107 billion of total estimated costs in the 2024–25 capital statement.
The increase in total estimated cost represents cost escalations and a growing number of projects. An estimated 71 per cent of these costs relate to expenditure beyond the next 12 months.
Given the scale and timing of investment, the state needs clear oversight of project planning, cost management, and market capacity to manage the risks associated with delivering a growing capital program.
Workforce shortages and major project delivery risks
Queensland’s infrastructure program relies on a skilled workforce, managed across multiple entities, to deliver projects on time and within budget. Shortages in engineering, project management, and trade roles are increasing the risks of delays and higher costs, especially for projects in the planning or early delivery stages.
In Queensland, Construction Skills Queensland estimates an average shortfall of 18,200 construction workers over the next 8 years, with the shortage expected to peak at 50,000 workers in 2026–27. Projects funded through capital grants, including some infrastructure for the Brisbane 2032 Olympic and Paralympic Games (Brisbane 2032), compete for the same workforce. This increases pressure on capacity and delivery time frames across the state.
Planning for Brisbane 2032 is still in the early stages. As of 30 June 2025, 11 of the 17 venues were still going through detailed business case processes. The other 6 were in early procurement.
Workforce constraints and early stage planning present delivery risks for both the capital program and Brisbane 2032 projects. To manage these risks, delivery agencies should assess workforce capacity and implement regular reviews of project readiness, time frames, and costs to support timely and cost-effective infrastructure delivery over the next decade.
Cross River Rail has ongoing cost pressures and a revised delivery timeline
The Cross River Rail project continues to experience higher material and labour costs, workforce shortages, supply chain disruptions, and reduced productivity from industrial action. The project scope also includes associated works such as tunnel integration, train stabling facilities, signalling systems, and future operations and maintenance costs. Together, these factors have increased the overall project cost and extended the completion time frame.
In 2024–25, the delivery authority renegotiated costs with its delivery partners for 2 major work packages, contributing to the project’s revised cost and schedule. In October 2025, the Queensland Government announced that the total project cost will now exceed $19 billion, with first passenger services expected in 2029.
1. Recommendations
We did not make any new recommendations in this report.
In Major projects 2024 (Report 9: 2024–25), we recommended that agencies involved in future asset transfers implement appropriate governance arrangements. These should include early collaboration between operational, legal, and financial teams; agreement on key delivery milestones and handover dates; accurate reflection of transfers in financial statements; and timely approval of equity designations.
For asset transfers completed during the year, agencies implemented governance arrangements that ensured the transfers were correctly reflected in their financial statements. They also coordinated effectively to agree on key delivery milestones and handover dates and obtained timely approvals for equity designations. These actions demonstrate that the recommendation was addressed. Ongoing coordination across operational, legal, and financial teams will remain important for future transfers.
We also recommended that Queensland Treasury considers whether further guidance could assist agencies in understanding their responsibilities during asset transfers. Queensland Treasury considers the existing guidance sufficient for agencies to understand their responsibilities for asset transfers.
We have included a full list of last year’s recommendations and their status in Appendix F.
Reference to comments
In accordance with s. 64 of the Auditor-General Act 2009, we provided a copy of this report to relevant entities. In reaching our conclusions, we considered their views and represented them to the extent we deemed relevant and warranted. Any formal responses from the entities are at Appendix A.
2. Insights into Queensland’s major projects
State and local governments provide funding to support Queensland’s growth, renewal, and development. This funding helps to deliver infrastructure across regions, maintains and upgrades existing assets, supports service delivery, and helps prepare for major events such as the Brisbane 2032 Olympic and Paralympic Games (Brisbane 2032).
This chapter provides insights into major projects the Queensland Government budgeted for each year between 2021–22 and 2025–26. It also highlights trends in project costs, timelines, delivery models, and infrastructure for Brisbane 2032.
Capital expenditure: Money spent to buy or build new assets or improve existing assets. This can include land, buildings, infrastructure, equipment, or computer systems. Examples include buying a range of new computers, building a new school, or upgrading roads.
Capital project: A single project, for example, the construction of a bridge.
Capital program: Several capital projects brought together under one program, for example, the construction of several new roads in a particular area.
Capital program (Budget Paper 3): The 4-year capital spending forecast in the state capital statement (Budget Paper 3).
In this report, we refer to all capital projects and programs as ‘projects’.
Total estimated cost: The total capital expenditure expected to complete a project, as per the state capital statement (Budget Paper 3). This may span multiple financial years until the project is complete and represents the whole of project costs. This includes the actual spend to date, budget 2025–26 spend, and forecast post 2025–26 spend.
State infrastructure strategy
The Queensland Government’s State Infrastructure Strategy 2022–2042 outlines a 20-year plan for infrastructure investment and development across the state. It guides government agencies in planning and prioritising infrastructure projects to support population growth, economic development, climate resilience, and regional equity. The strategy focuses on 5 key areas, as shown in Figure 2A.
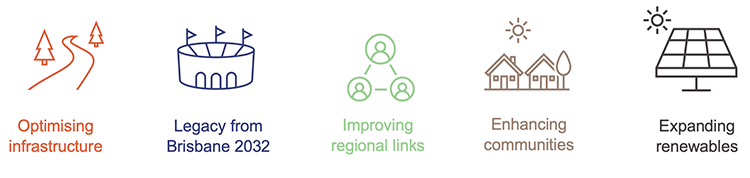
Compiled by the Queensland Audit Office from the State Infrastructure Strategy 2022–2042.
Since releasing the strategy, the Queensland Government has continued to develop its regional planning by developing regional infrastructure plans. These plans complement the strategy and aim to help councils and regional stakeholders align local infrastructure planning with statewide priorities.
Of the 7 regional infrastructure plans, the 4 completed plans identify key factors influencing infrastructure investment, including population growth, housing supply constraints, economic diversification, and the transition to a low-emissions economy. These completed plans also address local issues such as service accessibility, industry development, and climate resilience.
The State Infrastructure Strategy Progress Report 2024 outlines the status of the infrastructure strategy’s 183 priority actions. It provides updates on strategic planning, project delivery, and governance reforms, including improvements to data integration and decision-making tools that support long-term infrastructure planning.
The regional infrastructure plans outlined in the infrastructure strategy remain a key focus for infrastructure investment, particularly projects managed by the Department of Transport and Main Roads, as demonstrated by initiatives such as the Bruce Highway Targeted Safety Program. Regional projects continue to account for 69 per cent of budgeted capital expenditure during 2025–26, aligning with the objective to support regional development. The government has committed to developing new regional plans across the state.
The government has also introduced programs aligned with the infrastructure strategy’s goals. For example, the Residential Activation Fund is intended to deliver infrastructure that supports housing construction and supply across Queensland, and the $18.5 billion Hospital Rescue Plan aims to contribute to job creation and economic growth.
Costs of projects within the capital statement
The capital program (Budget Paper 3) shows that the government expects to spend $116.8 billion on capital projects over the next 4 years (the forward estimates), including $29.3 billion planned for 2025–26.
Budget Paper 3 also reports the total estimated cost of projects, which includes the actual spend to date, budget 2025–26 spend, and forecast post 2025–26 spend, representing a project’s whole-of-project cost. Some projects do not have a total estimated cost because they are ongoing programs with annual funding allocations.
In the 2025–26 capital statement, the sum of all project total estimated costs is $153 billion, compared with $107 billion in the 2024–25 capital statement. The total estimated cost excludes ongoing programs. The increase in total estimated cost represents cost escalations and a growing number of projects.
While there is a lower level of certainty of costs beyond the forward estimates, the total estimated cost of projects provides information on longer term capital requirements.
Figure 2B shows the growth and proportional allocation of total estimated costs for all projects across key government portfolios from 2021–22 to 2025–26. Appendix C lists the entities included in each portfolio.
Notes:
1 The figures above represent the total estimated costs, including amounts already spent, budget-year spend, and forecast post budget-year spend. This excludes ongoing programs.
2 The entities included in each portfolio may have changed due to machinery of government changes. The portfolios above reflect the 2025–26 entity mapping to enable comparison of total estimated costs with previous years’ capital statements.
3 Energy projects are delivered by energy government owned corporations, reported under the Queensland Treasury portfolio.
4 ‘Other’ includes portfolios such as Education, Queensland Corrective Services, Youth Justice and Victim Support, as well as Local Government, Water and Volunteers.
Compiled by the Queensland Audit Office from capital statements from 2021–22 to 2025–26.
The Transport and Main Roads portfolio continues to hold the largest share of total estimated costs. However, its share has decreased since 2021–22 as other portfolios have added new projects. At the same time, the total estimated cost of its projects has continued to grow due to the addition of high value projects.
Total estimated costs for energy projects increased significantly in 2023–24, following the introduction of the former government's Queensland Energy and Jobs Plan. The Energy portfolio has maintained its share of the overall capital program, supported by major projects such as CopperString and the Borumba Pumped Hydro Energy Storage project. The Queensland Government released a new Energy Roadmap in October 2025, which included announcements on various energy projects. Any changes from the roadmap will be reflected within the 2026–27 capital statement.
The State Development, Infrastructure and Planning portfolio has recorded the largest increase in its share of total estimated costs in 2025–26. This is primarily due to infrastructure projects included in the budget for Brisbane 2032.
The ‘Other’ portfolio has experienced growth in total estimated costs, driven by funding for the Arthur Gorrie and Townsville correctional centres, as well as projects such as the Paradise Dam Improvement Project and the Fitzroy to Gladstone Pipeline.
Planned capital expenditure is growing
Since 2021–22, planned capital expenditure beyond the next 12 months has continued to grow. Figure 2C shows the proportion of capital projects and their associated total estimated costs, as well as the breakdown between short-term and long-term planned capital expenditure.
Notes:
1 The figures above represent the total estimated costs, including amounts already spent, budget-year spend, and forecast post budget-year spend. This excludes ongoing programs.
2 ‘Expenditure as at 30 June’ represents the estimated actual expenditure at the beginning of the budgeted financial year.
Compiled by the Queensland Audit Office from capital statements from 2021–22 to 2025–26.
In 2021–22, planned capital expenditure beyond the next 12 months accounted for 50 per cent of total estimated costs. By 2025–26, this proportion had risen to 71 per cent. This shift reflects a growing share of future costs associated with major projects such as venues and villages for Brisbane 2032 and key transport initiatives including the Bruce Highway Targeted Safety Program, The Wave rail project, Logan and Gold Coast Faster Rail, and the Queensland Train Manufacturing Program.
Growth in long-term expenditure for projects beyond the next 12 months is outpacing that for projects scheduled within the next year. This trend may reflect the growth in the number of projects planned, as well as a range of internal and external factors impacting project delivery timelines, including labour shortages, industrial disputes, supply chain disruptions, and weather-related delays such as rain and flooding. Projects like Cross River Rail and other major road and rail developments have already experienced such challenges.
With fixed deadlines for Brisbane 2032, projects will continue to compete for limited resources to meet delivery requirements, such as skilled labourers, contractors, and suppliers. This competition may contribute to further cost increases, driven by supply and demand pressures in the market.
Construction shortages continue to affect projects
Major infrastructure projects rely on the availability of contractors with the necessary experience, expertise, and skills to deliver them on time and within budget. When workforce capacity is limited, projects can face delays or increased costs.
Infrastructure Australia identifies 3 key occupational groups essential for delivering infrastructure projects – engineers, scientists, and architects; project management professionals; and trades and labourers.
As of June 2025, Infrastructure Australia highlighted that most occupations within these groups were experiencing shortages relative to current and forecast demand. These roles typically require a mix of general, technical, and specialised skills, which take time to develop.
Construction Skills Queensland (CSQ) estimates an average shortfall of 18,200 construction workers over the next 8 years, with the shortage expected to peak at 50,000 workers in 2026–27.
CSQ notes that current employment pipelines are not sufficient to meet projected workforce needs. Within the engineering stream relevant to infrastructure projects, the largest shortage is among miscellaneous labourers, such as railway assistants and electrical or telecommunications trades assistants. These findings are consistent with the interim report published by the Queensland Productivity Commission in July 2025, which also highlighted ongoing shortages in the construction workforce across both residential and civil infrastructure.
As outlined earlier, planned estimated costs continue to increase. Because many of the shortages affect key trade occupations, there is a higher risk of delays and cost escalations across projects.
Labour shortages pose a particular risk to projects that are in the planning stage or are yet to commence. Transport projects, in particular, are expected to require project managers and engineers – occupational groups that, according to the reports discussed above, are also experiencing supply shortfalls.
Capital grant projects compete for labour and resources
Money given to build or improve infrastructure like buildings or roads in the form of capital grants helps state organisations to fund infrastructure that supports economic growth. The 2025–26 Budget Capital Statement (Budget Paper 3) (the capital statement) includes an estimated $9 billion of capital grants. These grants fund projects delivered by non-government entities (excluding departments and statutory bodies) and individuals through external contractors. These projects contribute to the overall delivery pipeline and compete with other major initiatives for labour and resources across the state. This includes major funding allocations such as the programs summarised in Figure 2D.
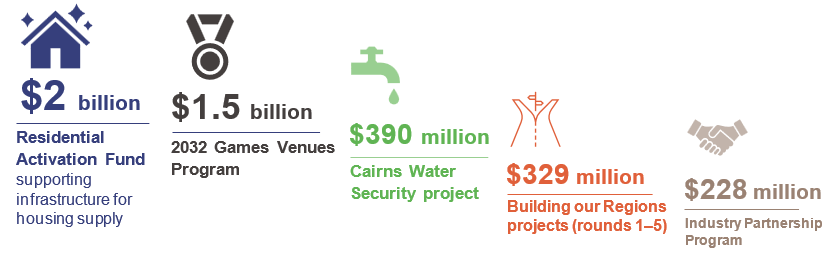
Compiled by the Queensland Audit Office from the 2025–26 capital statement.
Queensland’s major project timelines and costs are shifting
The Queensland state budget includes a comprehensive list of capital projects by portfolio, with details such as project scope, total estimated cost, and expenditure to date. Each year, these projects across the state are outlined in the capital statement.
Figure 2E shows the state’s largest capital projects, each with total estimated costs over $500 million, as of 30 June 2025. It shows expected completion dates based on agency responses, the budgeted estimated costs, and expenditure to 30 June 2025 reported in the 2025–26 capital statement (released in June 2025).
Budgeted estimated cost to date: Represents how much a project (or stage of a project) is expected to cost from commencement to completion. In some cases, this may instead represent the allocated budget to date, with further consideration from business cases to reach a final cost estimate.
Expenditure to 30 June 2025: Represents the estimated actual expenditure spent on the project per the 2025–26 capital statement.
Announced estimated completion date: The year when the project is expected to be complete and/or operational. In some cases, this represents the completion date for a particular phase of the project, rather than the underlying capital project in its entirety. The completion date is provided by the delivery agencies for each project.
Status: Represents the progress made towards each project as of 30 June 2025. Projects can go through multiple phases (such as early works, tendering and procurement, design, construction, commissioning, and completion). The status is provided by the delivery agencies for each project.
| Projects | Budgeted estimated cost to date | Expenditure to 30 June 2025 | Announced estimated completion date | Status |
|---|---|---|---|---|
| Transport and Main Roads | ||||

Cross River Rail | $8 bil. | $7.4 bil. | 2029 | Construction in progress. In 2024:
|
|
Logan and Gold Coast Faster Rail | $5.8 bil. | $898 mil. | 2031 | Design and preconstruction works in progress. |
|
Queensland Train Manufacturing Program | $4.9 bil. | $1.5 bil. | 2032 | Construction in progress. |

Coomera Connector (Stage 1), Coomera to Nerang | $3.5 bil. | $1.5 bil. | TBD | Construction in progress. In 2024:
|
|
Rockhampton Ring Road | $2 bil. | $379 mil. | 2030 | Construction in progress. In 2024:
|

Gold Coast Light Rail (Stage 3), Broadbeach South to Burleigh Heads | $1.6 bil. | $1.1 bil. | 2026 | Construction in progress. In 2024:
|
|
Pacific Motorway, Varsity Lakes (Exit 85) to Tugun (Exit 95) upgrade | $1.5 bil. | $1.3 bil. | 2025 | Construction completed for first 2 packages. Construction in progress for third package. In 2024:
|
|
European Train Control System Signalling Program: Phase 1 (pilot line, tunnel, and Sector 1 to Moorooka) | $1.3 bil. | $788 mil. | 2029 | Testing in progress. In 2024:
|
|
Beerburrum to Nambour Rail Upgrade (Stage 1) | $1 bil. | $243 mil. | 2027 | Construction to begin in late 2025. |
|
Inland Freight Route (Charters Towers to Mungindi), funding allocation | $1 bil. | $61 mil. | 2033 | Early works in progress. In 2024:
|
|
Clapham Yard Stabling (Moorooka), construct stabling yard | $693 mil. | $253 mil. | 2029 | Construction in progress. In 2024:
|
|
New Gold Coast Stations (Pimpama, Hope Island and Merrimac) | $500 mil. | $362 mil. | 2027 | Construction in progress. In 2024:
|
| Energy | ||||

Borumba Pumped Hydro Energy Storage | $18.4 bil. | $114 mil. | 2035 | Revised business case for project in development. In 2024:
|

CopperString | $13.9 bil. | $401 mil. | TBD | Queensland Investment Corporation (QIC) review is complete. In 2024:
|
|
Gladstone Project | $2.5 bil. | $47 mil. | 2029 | Commenced Priority Transmission Investment process in September 2024. |
|
Borumba Pumped Hydro Energy Storage Connection | $1.3 bil. | $35 mil. | TBD | Project is subject to the outcomes of the Borumba Pumped Hydro Energy Storage review. Powerlink is working with QIC on the associated transmission infrastructure requirements. In 2024, this was listed as 2 separate projects:
|

Lotus Creek Wind Farm | $1.3 bil. | $523 mil. | 2028 | Construction in progress. In 2024:
|

Brigalow Gas Peaking Plant | $1 bil. | $215 mil. | 2028 | Business case in development. In 2024:
|

Stanwell Battery | $688 mil. | $221 mil. | 2027 | Construction in progress. In 2024:
|
| Queensland Health | ||||

Other Major Hospital Infrastructure Improvements | $13.4 bil. | $1.2 bil. | 2028 | Commitment captures multiple capital projects each with individual project timelines. |
|
Ipswich Hospital Expansion (Stage 2) | $925 mil. | $133 mil. | 2028 | Construction in progress. |
|
Logan Hospital Expansion (Stage 2) | $875 mil. | $127 mil. | 2027 | Construction in progress. |
|
Princess Alexandra Hospital Expansion | $761 mil. | $93 mil. | 2027 | Construction in progress. |
|
Queen Elizabeth II Jubilee Hospital Expansion | $621 mil. | $102 mil. | 2027 | Construction in progress. |
| Other | ||||

Arthur Gorrie Correctional Centre | $1.3 bil. | $1.5 mil. | 2030 | Budget outcome received in June 2025 for funding. |
|
Townsville Correctional Centre | $1.1 bil. | $1.5 mil. | 2030 | Budget outcome received in June 2025 for funding. |

Paradise Dam Improvement Project | $4.4 bil. | $216 mil. | TBD | Enabling works in progress. In 2024:
|

Fitzroy to Gladstone Pipeline | $983 mil. | $888 mil. | 2026 | Construction in progress. |
|
Woodford Youth Detention Centre | $983 mil. | $219 mil. | 2028 | Construction in progress. In 2024:
|
|
Somerset Dam Improvement Project | $515 mil. | $95 mil. | TBD | Enabling works in progress. |
| State Development, Infrastructure and Planning | ||||

2032 Games Venues Program | $7.1 bil. | $1.7 mil. | 2032 | Project validation reports and planning in progress. |

2032 Games Athletes Villages | $3.5 bil. | $ Nil. | 2032 | The state has engaged with nominated landowners/developers and is progressing planning and commercial arrangements. |
Note: TBD – To be decided.
Compiled by the Queensland Audit Office from the 2025–26 capital statement for various state government entities.
Insights into project stages and delivery models for projects over $500 million
The following section provides insights into the delivery models and progress of the state’s largest capital projects, each with an estimated total cost of more than $500 million as of 30 June 2025.
Projects delivered by Queensland Government departments and statutory bodies follow the Project Assessment Framework (PAF), which guides the planning, evaluation, and delivery of major infrastructure. Projects delivered by other public sector entities generally align with PAF principles where government funding or approval is required.
Several related frameworks and policies support the PAF, including:
- Business Case Development Framework – outlines the step-by-step process for planning and assessing major infrastructure proposals. It helps agencies move from identifying a service need through to analysing options and developing a strong evidence-based investment case
- Infrastructure Proposal Development Policy – explains how infrastructure proposals are reviewed to ensure they are well planned, backed by evidence, and likely to achieve their intended outcomes
- Gateway review – provides independent reviews at key points in the project life cycle to identify risks and suggest improvements.
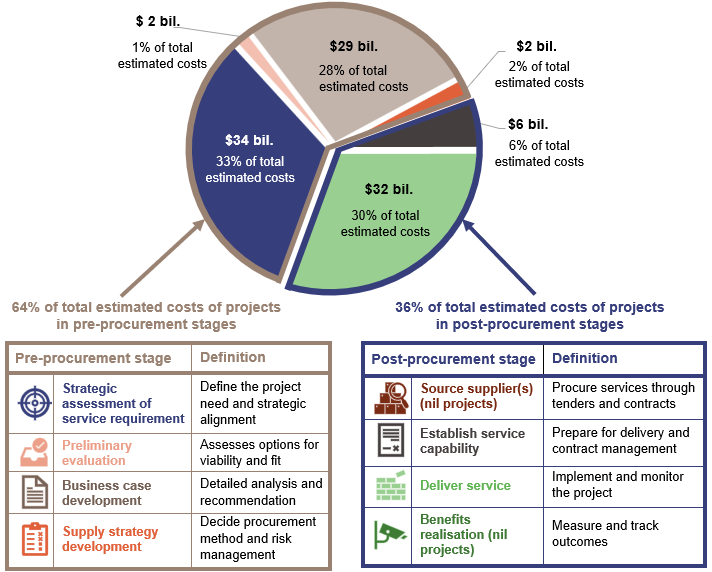
The PAF divides the project life cycle into 8 key stages, from defining the service need through to delivery and benefits realisation. These stages promote consistent decision-making and alignment with whole-of-government priorities.
At each stage, agencies assess the project’s progress and quality to ensure it aligns with strategic goals and delivers value for money. Projects must meet the requirements of each stage before moving to the next.
Around 64 per cent of total estimated project costs for projects greater than $500 million relate to projects in the pre-procurement stage of their life cycle. At this early stage, cost estimates often have lower cost certainty and are more likely to change.
As projects progress through later stages of the project life cycle, total estimated costs generally become more reliable and may increase.
Figure 2F shows the current project life cycle stages as per the PAF for projects over $500 million, grouped by their total estimated cost.
Compiled by the Queensland Audit Office from information provided by agencies.
Delivery models of projects over $500 million
Agencies use different delivery models to match the scale, complexity, and risk of each project. Common models include construct only, design and construct, public–private partnerships, and alliance contracting. Selecting an appropriate model helps achieve value for money, deliver projects on time, and manage risks effectively.
When determining the preferred delivery model, agencies assess factors such as value for money, project scope, certainty of the proposed solution, market interest, industry capability and competition, risk, and delivery time frame.
Agencies determine the delivery model during the supply strategy development stage of the PAF.
Figure 2G outlines the delivery models used for major projects, including their main advantages and disadvantages.
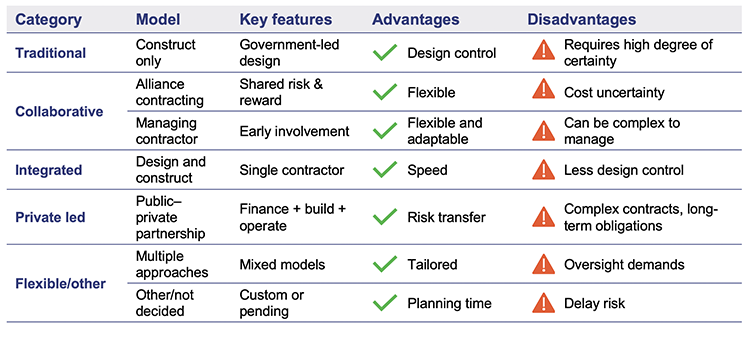
Compiled by the Queensland Audit Office from Queensland Treasury’s Project Assessment Framework, Alliance establishment and management supplementary guidance to the PAF, and the Queensland Government Building construction and maintenance guide.
The choice of delivery model varies across sectors, reflecting differences in project types and operational requirements. For example:
- In the health sector, agencies often use a managing contractor model, which enables early contractor involvement to manage design and coordinate delivery on behalf of the agency.
- In the transport sector (such as road and rail), agencies use a range of delivery models depending on the project’s size, complexity, and objectives. Common approaches include public–private partnerships, alliance contracting, design and construct, and construct only.
Figure 2H shows the delivery models used across portfolios.
Note: Energy projects are delivered by energy government owned corporations, reported under the Queensland Treasury portfolio.
Compiled by the Queensland Audit Office from information provided by agencies.
Delivery strategies also outline how a project will be delivered, including the chosen delivery model, procurement approach, and contract arrangements. While standard delivery models or processes are generally used, tailored approaches may be applied for higher value or more complex projects.
Status of major rail projects across Queensland
Several major rail projects are underway in Queensland, including The Wave (formally known as the Direct Sunshine Coast Rail Line), Logan and Gold Coast Faster Rail, Queensland Train Manufacturing Program, and Gold Coast Light Rail (Stage 3) project. Figure 2I shows a summary of each project’s budget and total expenditure to date.
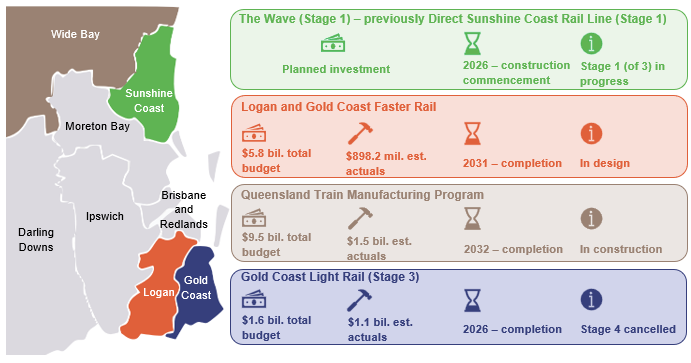
Compiled by the Queensland Audit Office from information provided by the Department of Transport and Main Roads and from the 2025–26 capital statement.
The Wave (Stage 1) – previously Direct Sunshine Coast Rail Line (Stage 1)
The Wave is a public transport route between Beerwah and the Sunshine Coast Airport. This route includes a proposed new rail line extending from the North Coast Line at Beerwah to Birtinya, connecting with a bus-based service that will connect customers to the Sunshine Coast Airport, via Maroochydore. Stage 1 involves constructing a dual-track rail line and associated infrastructure between Beerwah and Caloundra, including one upgraded station and 2 new stations.
Stage 1 of the project is estimated to cost between $5.5 billion and $7 billion. The Australian and Queensland governments have each committed $2.75 billion to jointly fund this stage. These funding estimates are preliminary and will be refined through detailed investigations and industry engagement following completion of procurement. Construction is expected to commence in late 2026, pending approvals.
Stage 2 involves a proposed extension of the rail line from Caloundra to Birtinya. This stage includes approximately 7 kilometres of dual track, approximately one kilometre of tunnel, and 2 new stations. Stage 2 remains subject to future funding decisions. Predelivery activities for both Stages 1 and 2 are underway.
Stage 3, referred to as the Sunshine Coast Metro, is planned to deliver bus-based, metro-style services from Birtinya to the Sunshine Coast Airport via Maroochydore. This stage remains subject to future funding decisions. Early investigations are underway.
In 2025, the Queensland Government committed $40 million in additional funding to accelerate the planning and market readiness for The Wave (Stages 2 and 3).
Logan and Gold Coast Faster Rail
The Logan and Gold Coast Faster Rail project involves the following works between Brisbane, Logan, and the Gold Coast:
- duplicating tracks between Kuraby and Beenleigh
- upgrading and relocating stations
- removing level crossings
- completing local road works
- improved walking and cycling connections to stations
- enabling works for the European Train Control System.
As outlined in the 2025–26 capital statement, the Australian and Queensland governments will contribute $2.875 billion each for the project.
In March 2025, the design and preconstruction contract was awarded for the major rail works package, which includes:
- track duplications
- station upgrades
- level crossing removals.
The project received formal environmental approval in July 2025. Design, planning, and site investigations are progressing, with community engagement continuing throughout 2025.
Construction is underway on the Loganlea Station Relocation project and detailed design is underway for the Open Level Crossing Removal package, with contracts awarded in September 2024. The new Loganlea Station is expected to reach practical completion in 2027.
The Logan and Gold Coast Faster Rail project is expected to be complete by 2031.
Queensland Train Manufacturing Program
In June 2023, the Department of Transport and Main Roads signed a $4.6 billion Design, Build and Maintain (DBM) contract with the Downer Group for the construction of 65 passenger trains. The contract includes delivering a maintenance facility, stabling, and an initial 15 years of maintenance. This contract formed part of the $7.1 billion commitment announced in the 2022–23 Queensland state budget, following completion of the project’s business case.
In June 2023, the estimated total project cost increased to $9.5 billion due to increased scope and higher costs for external labour and supplies after the tender process. The increased scope not included in the DBM contract will be delivered separately by the state. This includes constructing stabling roads and a test track, and providing for an additional 20 years of operation and maintenance beyond the DBM contract term.
In April 2025, a $120 million contract was awarded to construct the maintenance facility. Construction is underway at both the manufacturing and rail facility sites. The manufacturing facility building is expected to be complete in time for manufacturing to commence from April 2026, with the Ormeau rail facility scheduled for completion by late 2027.
The first train is expected to be completed to allow passenger services to commence in 2027. All 65 trains are expected to be in service by 2032.
Gold Coast Light Rail (Stage 3)
The Gold Coast Light Rail is being delivered in stages. The dual-track system currently spans more than 20 kilometres and includes 19 stations between Helensvale and Broadbeach South, with Stage 3 underway. Stage 3 involves a 6.7-kilometre southern extension of the tram network from Broadbeach South to Burleigh Heads. The project includes:
- 8 new stations
- 5 new light rail vehicles
- upgrades to the existing Southport depot and stabling facilities
- new light rail and bus connections at Burleigh Heads and Miami.
All 3 levels of government are contributing funding to the project, as shown in Figure 2J.
In September 2024, the Department of Transport and Main Roads increased the Stage 3 project budget by approximately $330 million, from $1.219 billion to $1.549 billion. Completion of the project is expected by mid-2026.
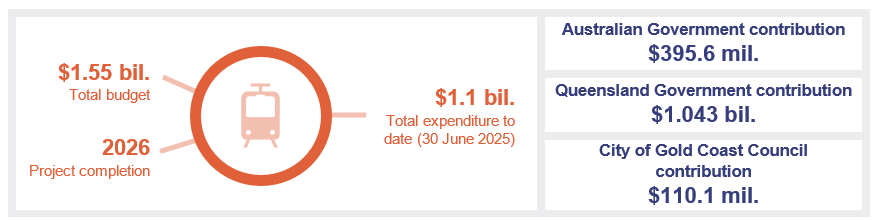
Compiled by the Queensland Audit Office from information on the Department of Transport and Main Roads' website and from the 2025–26 capital statement.
Gold Coast Light Rail Stage 4 cancelled
The Gold Coast Light Rail Stage 4 project proposed a 13-kilometre extension south of Stage 3, linking Burleigh Heads to Coolangatta via the Gold Coast Airport. The project scope included:
- 14 new stations
- 8 new light rail vehicles
- a new stabling facility and satellite depot
- ongoing maintenance of 2 northbound and southbound traffic lanes on the Gold Coast Highway.
The project was cancelled on 1 September 2025 following an independent review. The review highlighted several factors that informed the decision, including:
- community feedback on the consultation process
- a majority of respondents not supporting the project
- risks of time and cost escalation
- broader support for alternative public transport options, such as improved bus services
- the need to consider environmental and local amenity impacts in future transport planning.
Following the review, the Queensland Government has indicated it will consider public transport solutions that take account of these findings.
Advancing road safety and infrastructure in Queensland
Major upgrades to road safety and transport infrastructure are underway across Queensland. These include the Bruce Highway Targeted Safety Program, the Targeted Road Safety Program, and large-scale road projects focused on accommodating population growth and improving freight and passenger transport networks.
These projects highlight the scale of funding allocated to Queensland’s road network, delivered alongside a range of other upgrades. While progress continues, cost and delivery pressures have required ongoing adjustments to budgets and time frames. These challenges are further influenced by demand across other major infrastructure sectors, including rail, housing, and preparations for Brisbane 2032.
Bruce Highway Targeted Safety Program
Announced in January 2025, this $9 billion program aims to improve safety and reliability along the Bruce Highway through a range of infrastructure upgrades. These include wide centre-line treatments, road widening, audio tactile line marking, pavement strengthening, intersection upgrades, overtaking lanes, and new rest areas. The program is jointly funded, with $7.2 billion contributed by the Australian Government and $1.8 billion by the Queensland Government. Early works have commenced across multiple regions, with completion expected by 2030.
Targeted Road Safety Program
This $1.7 billion program funds safety treatments and route-based improvements across Queensland’s road network. Some projects receive joint funding from the Australian and Queensland governments, while others are fully funded by the Queensland Government. The program focuses on making roads and roadsides safer through targeted upgrades.
Coomera Connector (Stage 1)
Stage 1 of the Coomera Connector is a 16-kilometre motorway between Coomera and Nerang, delivered in 3 packages – north, central, and south. The project budget has increased from $2.2 billion to $3.5 billion, reflecting cost escalations across the construction sector, environmental approvals, complex ground conditions, and changes in project scope. The project is funded by the Australian Government ($1.5 billion) and the Queensland Government ($2 billion). Stage 1 North (Shipper Drive to Helensvale Road) opened to traffic on 2 December 2025. Stage 1 Central (Helensvale Road to Smith Street Motorway) and Stage 1 South (Smith Street Motorway to Nerang-Broadbeach Road) packages are currently under construction.
Rockhampton Ring Road
The Rockhampton Ring Road is a 17.4-kilometre bypass that includes a third crossing of the Fitzroy River. It is designed to improve flood resilience and freight movement in the region. The project budget has increased from $1.1 billion to $2 billion due to rising construction costs across the sector. It is jointly funded by the Australian Government ($1.4 billion) and the Queensland Government ($0.6 billion). Early works are complete, and construction of the main works package began in August 2025.
Pacific Motorway, Varsity Lakes to Tugun upgrade
The Pacific Motorway upgrade from Varsity Lakes to Tugun is a $1.5 billion project delivered in 3 packages. The project budget increased from $1 billion to $1.5 billion in November 2023. Package A (Varsity Lakes to Burleigh) and Package B (Burleigh to Palm Beach) are complete. Package C (Palm Beach to Tugun) includes road widening, a new service road, and interchange upgrades. All southbound lanes reopened in August 2025, and construction was completed in November 2025.
Queensland’s energy projects have been affected by a new roadmap
On 10 October 2025, the Queensland Government released a new Energy Roadmap outlining the direction of the state’s energy sector over the next 5 years and beyond. This roadmap affects energy projects being delivered by Queensland Government entities, including their structure and method of delivery. Further detail of the roadmap is provided in Energy 2025 (Report 7: 2025–26).
Planned capital expenditure for energy infrastructure is $6.7 billion in 2025–26, a decrease from $8.7 billion in 2024–25. The decreased budgets affect several major projects across the sector.
CopperString

| The CopperString project involves delivering more than 1,100 kilometres of transmission line across 2 sections – an Eastern Link between Townsville and Hughenden, and a Western Link between Hughenden and Mount Isa. When Powerlink led the project, the estimated cost was $5 billion, which increased to $6.2 billion in September 2024. Following a detailed review of project requirements by Powerlink, the government announced in December 2024 that the project cost had increased to $9 billion, which included contingency allowances. In April 2025, the Queensland Government clarified that this amount did not include the cost of connecting mines and electricity generation assets along the transmission corridor. A revised total budget of $13.9 billion, reflecting the expanded project scope, was also announced in April 2025. |

| In October 2025, as part of the government’s Energy Roadmap, QIC was assigned responsibility for delivering the CopperString project and attracting private sector investment to support it. |
Borumba Pumped Hydro Energy Storage
|
| In November 2024, Queensland Hydro provided the Queensland Government with a cost and schedule review for the Borumba Pumped Hydro Energy Storage project. The review indicated a $4.2 billion expected increase in capital costs, as well as a schedule delay of approximately 32 months. These changes were attributed to a clearer understanding of project scope, market escalation, increased labour costs, and delays in securing environmental approvals. In December 2024, the Queensland Government announced the project budget had increased from $14.2 billion to $18.4 billion, with the final completion date extended from November 2032 to July 2035. |

| In April 2025, the Queensland Government announced that QIC would assume management responsibilities for Queensland Hydro and oversee a revised business case for the project, expected in mid-2026. Oversight of Queensland Hydro transferred to QIC in June 2025, with the company remaining 100 per cent state owned. |
Pioneer-Burdekin Pumped Hydro Energy Storage cancelled
The Pioneer-Burdekin Pumped Hydro Energy Storage project was cancelled in November 2024. At the time of cancellation, the project was in its early stages, with land acquisition and initial site works underway. Project closure activities will continue into the 2025–26 financial year, including the sale of acquired properties back to the original landholders.
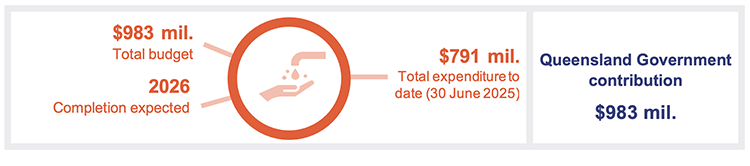
The Fitzroy to Gladstone pipeline is nearing completion
The Fitzroy to Gladstone pipeline is being delivered by the Gladstone Area Water Board (GAWB) to support long-term water security in Central Queensland.
The project will enable the transfer of up to 30 gigalitres of water annually from the Fitzroy River near Rockhampton to Yarwun near Gladstone. Key infrastructure includes:
- a 117-kilometre pipeline
- an intake structure and pumping station at Laurel Bank
- a water treatment plant, reservoir, and pumping station at Alton Downs
- 2 reservoirs at Aldoga.
The business case was completed in 2021 and, in February 2023, the state government approved funding for the project, with an estimated total cost of $983 million, as shown in Figure 2K.
The project is being delivered under a joint venture construction model, with a principal contractor engaged for delivery and GAWB overseeing project management. Completion was originally scheduled for late 2026, and the project remains on track to meet this target.
Compiled by the Queensland Audit Office from information provided by the Gladstone Area Water Board.
As of 30 June 2025:
- 116 of 117 kilometres of pipeline have been constructed
- the 2 major water storage reservoirs at Aldoga are complete
- hydrostatic testing of the pipeline is underway.
Remaining works include completing the final pipeline section and construction activities at the intake facility and the water treatment plant. Commissioning activities are scheduled for 2026.
Brisbane Metro is mostly complete and operational
Delivery of the Brisbane Metro project commenced in late 2021. The project is converting 21 kilometres of existing busway into a high-frequency, battery-electric rapid transit system. It will link key destinations including Eight Mile Plains, Roma Street, the Royal Brisbane and Women’s Hospital, and the University of Queensland.
The network includes 18 stations, with 11 designed as interchange points for existing bus services and 2 providing connections to the Cross River Rail stations at Boggo Road and Roma Street. The project also includes a fleet of all-electric, high-capacity metro vehicles.
Figure 2L outlines the total funding for the project, including contributions from the Australian Government and Brisbane City Council, and actual expenditure as of 2025.
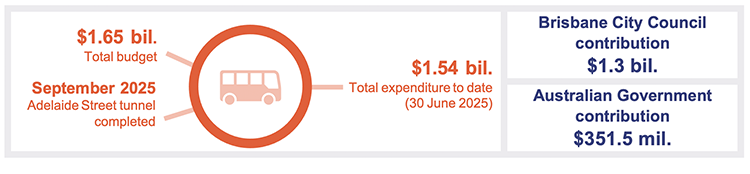
Compiled by the Queensland Audit Office from information provided by Brisbane City Council.
Budget and current progress
Brisbane City Council estimates a remaining cost of $108 million to complete major work packages for Brisbane Metro, with expenditure planned across the 2025–26 and 2026–27 financial years. Figure 2M provides details on each work package, including budgeted and actual expenditure as of 30 June 2025.
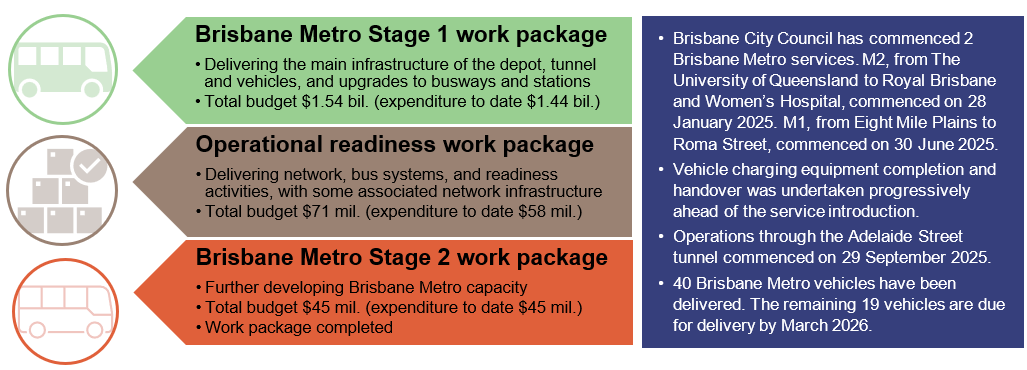
Compiled by the Queensland Audit Office from information provided by Brisbane City Council.
During 2024–25, Brisbane City Council transferred $124 million in Brisbane Metro assets to Queensland Government entities. This included the handover or upgrade of busways and stations to the Department of Transport and Main Roads. Further transfers are expected to occur throughout 2025–26 as the project moves towards completion.
Brisbane City Council and the Queensland Government are commencing a business case to assess future Brisbane Metro extensions. This work will define route alignments, depot locations, network upgrades, and staging for additional routes. The Australian Government has committed $50 million to support this planning, with a focus on proposed extensions to Carseldine, Springwood, Capalaba, and the Brisbane Airport.
Brisbane Metro – Woolloongabba Station funding commitment
In March 2022, the Australian Government, Queensland Government, and Brisbane City Council jointly committed $450 million under the South East Queensland City Deal for the proposed Brisbane Metro – Woolloongabba Station. A detailed business case was endorsed by all levels of government. The project will not proceed to delivery at this time and has now been closed out.
Olympic and Paralympic infrastructure projects
Brisbane 2032 Delivery Plan
The Games Independent Infrastructure and Coordination Authority (GIICA) was established in November 2024 to lead the delivery of new and upgraded venues for Brisbane 2032.
On 8 March 2025, GIICA finalised a 100-day review of Games-related infrastructure and planning, as requested by the Queensland Government. The review included 86 recommendations across the following areas in Figure 2N.
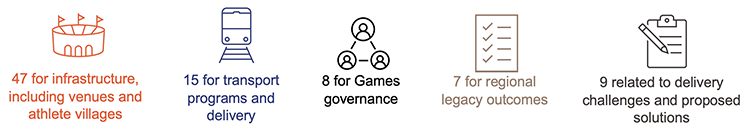
Compiled by the Queensland Audit Office from GIICA’s 100-day review.
Following the review, on 25 March 2025 the Queensland Government released the 2032 Delivery Plan, which outlines the construction of 8 new venues and upgrades to 11 existing venues. The $7.1 billion Games Venue Infrastructure Program will deliver 7 of the new venues and 10 of the upgrades. The Australian Government will contribute up to $3.435 billion, with the Queensland Government contributing $3.665 billion.
One new venue and one upgraded venue on the Gold Coast fall outside this program. The City of Gold Coast Council will fully fund and deliver a new Gold Coast Arena and an upgraded Gold Coast Hockey Centre.
Figure 2O provides an overview of the proposed venues. As of 30 June 2025, the project validation reports (PVRs) for 11 of the 17 venues were still being developed. A detailed status update for each venue is provided in Appendix G.
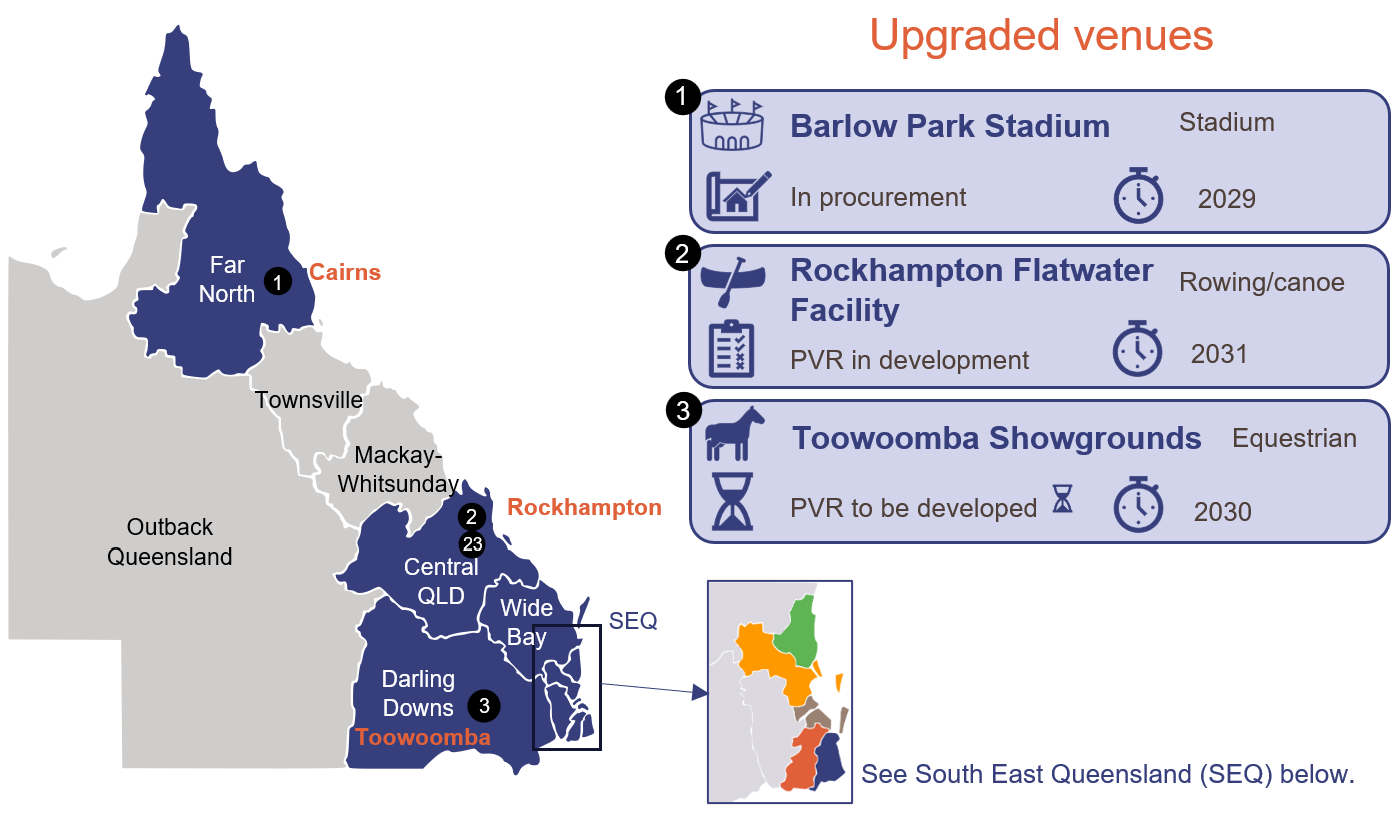
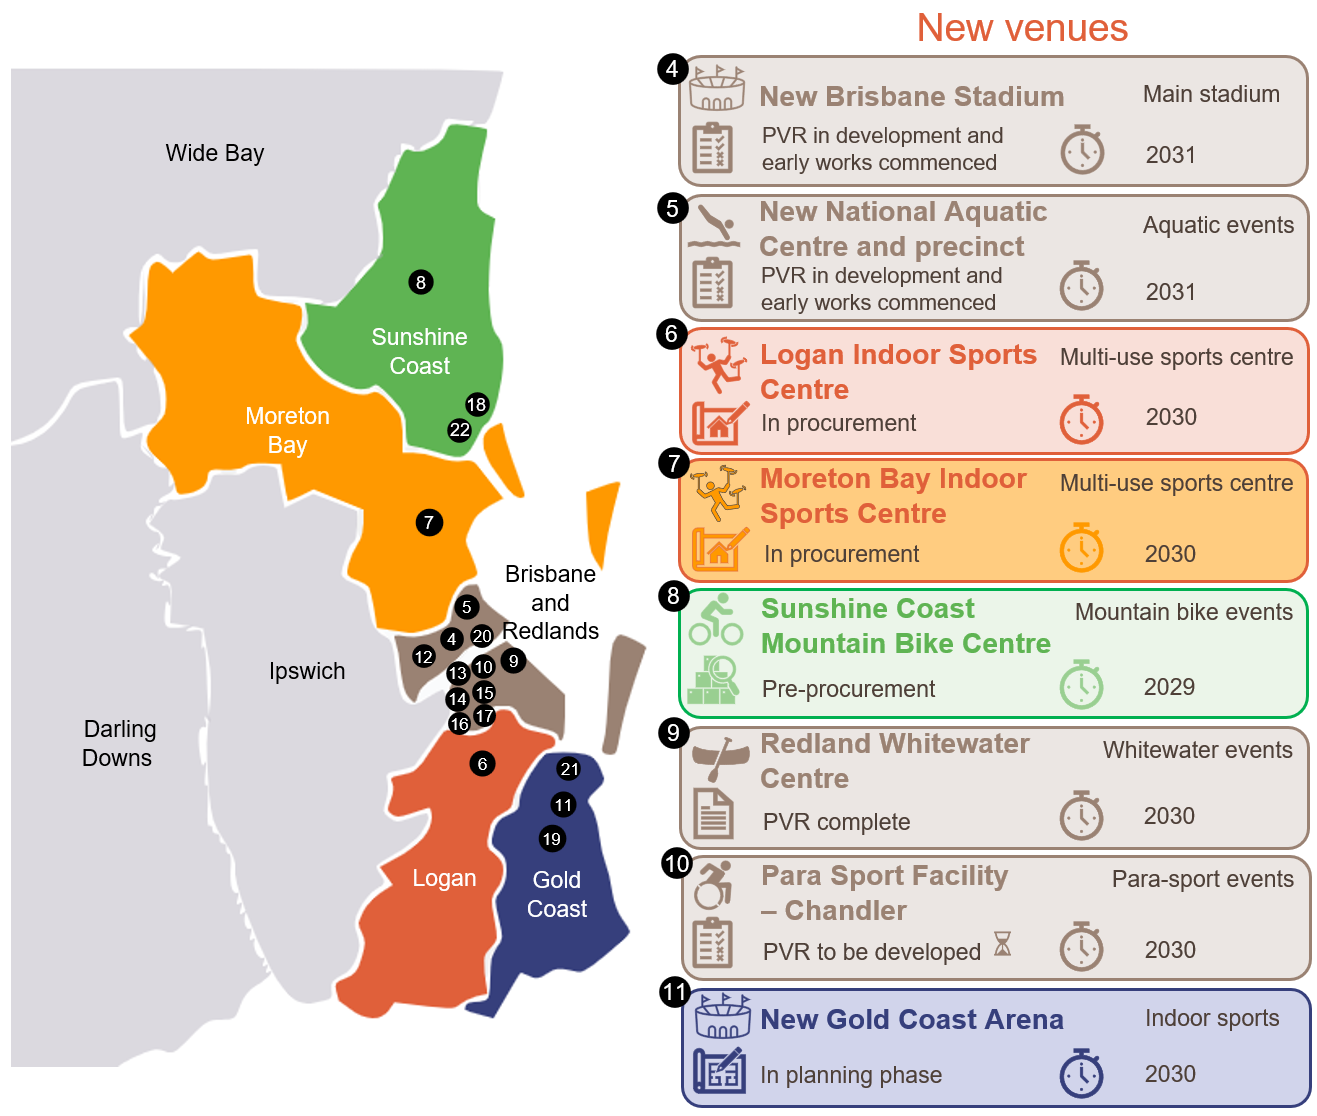
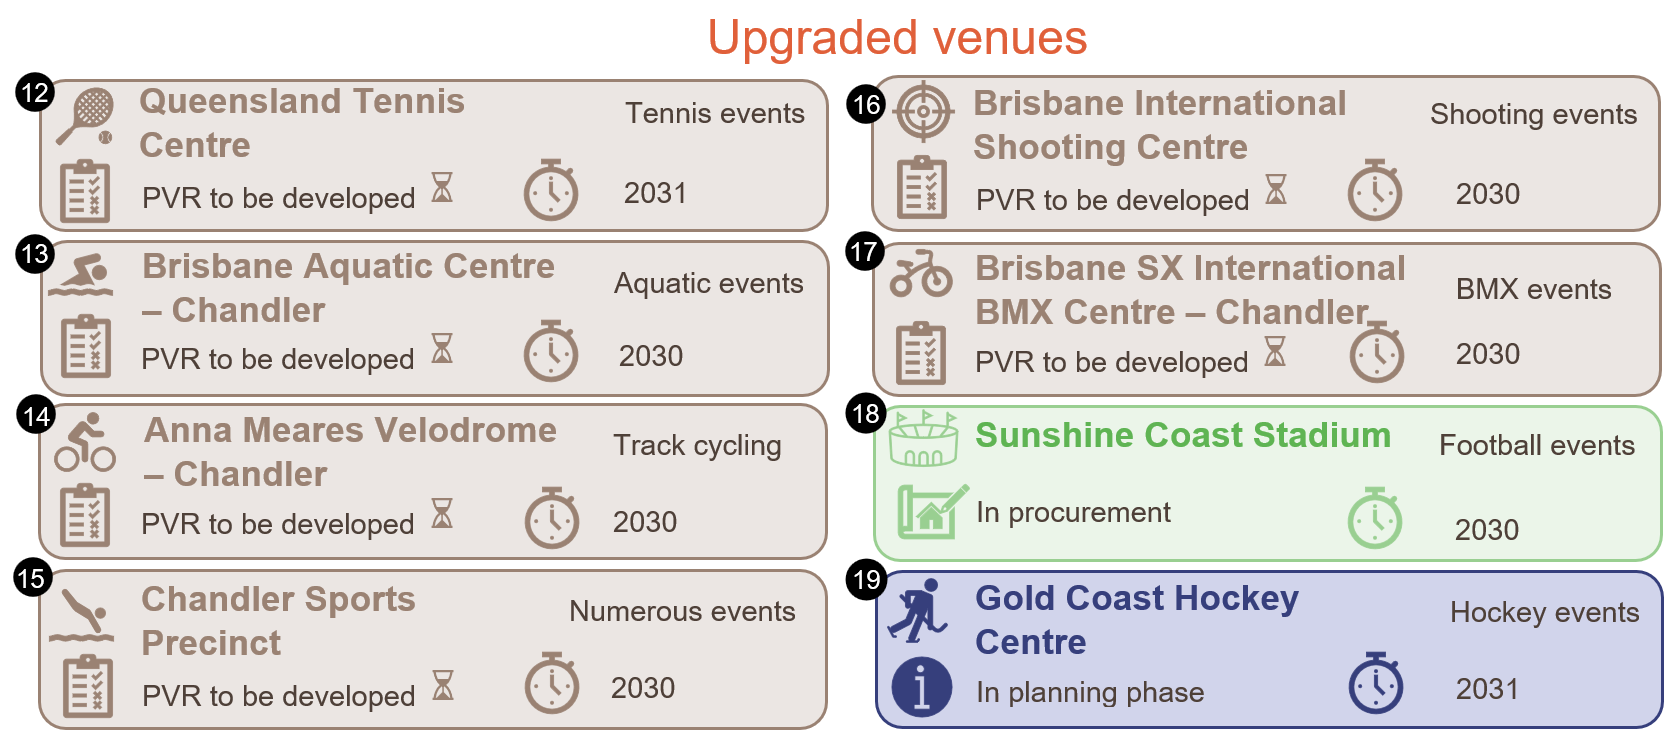
Compiled by the Queensland Audit Office from information provided by the Games Independent Infrastructure and Coordination Authority, the City of Gold Coast Council, and published in the 2032 Delivery Plan.
The 2032 Delivery Plan identified 4 athletes villages to be delivered across Queensland for the Games. Figure 2P provides an overview of the proposed village locations.
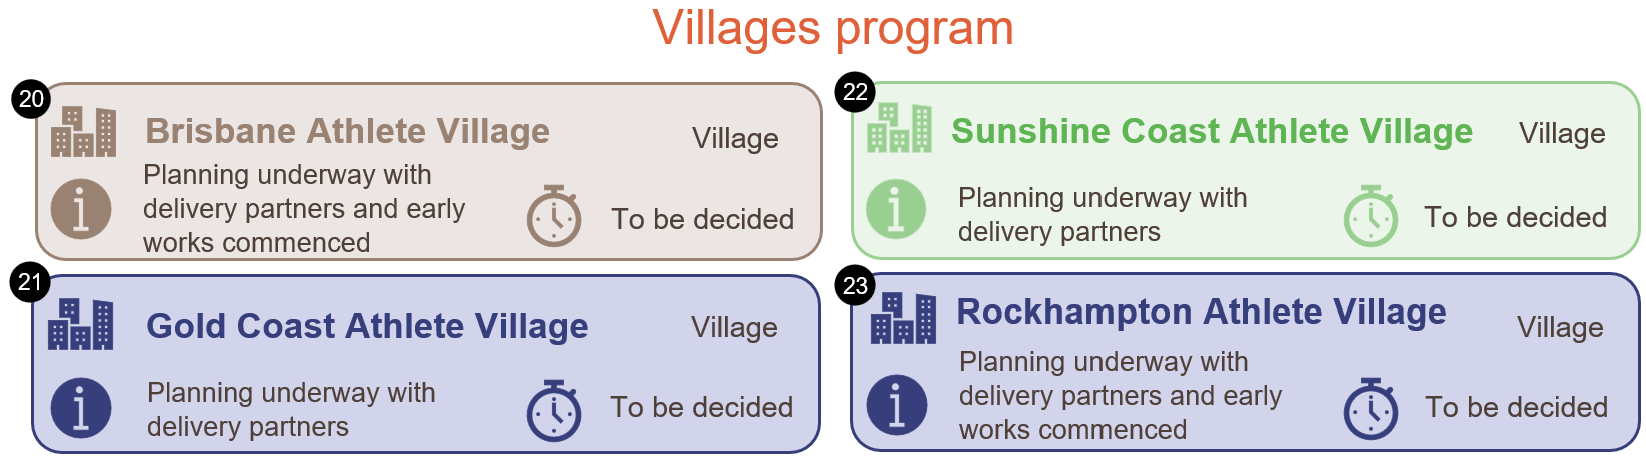
Compiled by the Queensland Audit Office from information published in the 2032 Delivery Plan.
In line with the 2032 Delivery Plan, the Department of State Development, Infrastructure and Planning is responsible for partnering with the private sector to deliver the 2032 Games athletes villages program, coordinating infrastructure planning for the Victoria Park Precinct, and overseeing the monitoring and reporting of Games infrastructure, including venues, villages, and transport-related projects.
As part of the 2025–26 state budget, the Queensland Government set aside $3.5 billion for the 2032 Games athletes villages program over the life of the program, with $950 million provisioned over the first 4 years.
3. Oversight and reporting on Queensland’s major projects
Public sector entities play a key role in managing public resources responsibly and require strong governance over procurement decisions, reporting on capital projects, and asset management.
This chapter outlines asset transfers reported during the financial year, highlights improvements in the availability and quality of capital project information, and assesses whether entities are consistently applying procurement policies and procedures.
Resolution of asset transfer issues between agencies
In Major projects 2024 (Report 9: 2024–25), we identified the need for better coordination and clearer guidelines to support timely asset transfers, particularly between the Cross River Rail Delivery Authority and Queensland Rail. The issues related to when the control of assets is transferred and the application of accounting treatment under Queensland Treasury’s Financial Reporting Requirement (FRR) 4F Equity, Contributions by Owners and Distributions to Owners.
During 2024–25, the agencies took steps to address these issues and improve coordination:
- In September 2024, they completed and executed a formal equity designation for asset transfers in accordance with FRR 4F.
- In April 2025, they secured an enduring equity designation, allowing future transfers to proceed via equity for accounting purposes.
Actions taken in 2024–25 improved how state agencies coordinate asset transfers. However, there have been some examples of delays in local governments recognising assets that are transferred from state entities.
With more infrastructure projects and asset transfers expected before the 2032 Olympic and Paralympic Games, further work in 2025–26 is needed to review the consistency of accounting practices and coordination processes for these transfers.
Improved capital project disclosures with scope to enhance transparency
The budget capital statement (Budget Paper 3) (capital statement) presents an overview of proposed capital outlays by each agency, as well as a summary of the government’s approach to delivering infrastructure.
In Major projects 2024 (Report 9: 2024–25), we highlighted the need for the government to improve the quality and consistency of information on capital projects within the capital statement.
In 2025–26, Queensland Treasury made changes to enhance the transparency of project disclosures, including explanations of changes to the total estimated cost, reallocations of funding between projects or programs, and explanation of project scope changes.

| In the 2025–26 capital statement, the Brigalow Gas Peaking Plant project total estimated cost increased from $642 million to $1.0 billion. An additional footnote was included in the capital statement: Total estimated cost has increased since the 2024–25 State Budget due to development cost increases and business case revisions. |
These changes provide users of the capital statement with better insight into how projects evolve over time and align with our earlier recommendations made in Major projects 2023 (Report 7: 2023–24).
TMR’s new approach to capital project reporting
In June 2025, the Department of Transport and Main Roads (TMR) updated how it presents its capital program, following a strategic review of the Queensland Transport and Roads Investment Program.
The review looked at how TMR manages its infrastructure pipeline and how the Queensland Government can improve cost and risk management throughout the life of major projects. One key change from the review was to classify projects as either planned or contractually committed.
Under this new approach, budget figures are only shown for projects that have reached contract award.
|
| In the 2024–25 capital statement, the Direct Sunshine Coast Rail Line Stage 1 project, which had not yet reached contract award, showed a total estimated cost of $5.5 billion, with $110 million expected to be spent by 30 June 2025. In the 2025–26 capital statement, the project was renamed The Wave (Stage 1). As it had still not reached contract award, it was included under a broader program, Rail Infrastructure Improvements – North Coast. Its total estimated cost is no longer shown until a contract is awarded. |
This updated approach is designed to reduce premature cost disclosures, promote fair competition, and support better value for money. Once a project reaches contract award, its full estimated cost is reported, helping to improve transparency, public accountability, and understanding.
Continued focus needed on procurement policy and conflict management
In Major projects 2024 (Report 9: 2024–25), we reported the need for public sector entities to strictly comply with the principles of the Queensland Procurement Policy 2023, particularly when managing conflicts of interest.
During 2024–25, we continued to identify instances of non-compliance with procurement policies and procedures.

| Opportunities for entities – strengthen procurement and contract management controls Entities should:
|
4. Progress of the Cross River Rail project
The Cross River Rail Delivery Authority (the delivery authority) is responsible for delivering the Cross River Rail (CRR) project.
The project involves constructing a 10.2-kilometre rail line, including 5.9 kilometres of twin tunnels running under the Brisbane River and the central business district, and 4 new underground stations. The delivery authority is also responsible for delivering a wide range of CRR-related works. These include rebuilding 8 existing above-ground stations, building 3 new stations on the Gold Coast, and the installation of a new signalling system on behalf of other government agencies. Since the project began in 2019, both the estimated total cost and the planned opening date for passenger services have changed.
Figure 4A outlines key announcements and changes made since the project commenced.
| Business case released: | $6.9 bil. total cost | 
2024 |
- Core project cost: $6.9 billion covering surface works, signalling, rail systems, underground stations, tunnelling, tunnel track, and acquisition of land. Funding includes $5.4 billion from the state and $1.5 billion from the private sector.
- Additional stations and signalling works were identified for future consideration to support enhanced service levels.
| Three major work packages announced: | 
$8.1 bil. total cost | 
2025 |
- Core project cost: $6.9 billion.
1. Tunnel, Stations and Development (TSD): $4.2 billion ($2.7 billion state-funded and $1.5 billion privately funded).
2. Rail, Integration and Systems (RIS): $0.8 billion state-funded.
3. Other state-funded works: $1.9 billion for land acquisition, contingencies, and other project costs. - Associated project cost: $1.2 billion, including $634 million for European Train Control System (ETCS) and $600 million for RIS, both funded by Queensland Rail, bringing the overall CRR project cost to $8.1 billion.
| Cost increase and revised opening date: | $9.5 bil. total cost | 
2026 |
- Core project cost: $7.8 billion, includes $960 million in additional state funding ($6.3 billion state-funded and $1.5 billion privately funded). The increase reflects supply chain pressures and higher material and labour costs. The revised in-service date changed to 2026.
- Associated project cost: $1.7 billion of other state-funded works, including complementary works and ETCS, bringing the overall CRR project cost to $9.5 billion.
| Estimated costs and revised opening date: | >$17 bil. total cost | 2029 |
- Core project cost: $10.6 billion, includes $2.6 billion for future operations and maintenance.
- Associated project cost: $6.5 billion, includes $1.75 billion for expected but not yet agreed costs, bringing the overall CRR project to more than $17 billion.
- Associated works include tunnel integration with the existing rail network, train stabling facilities, signalling systems, temporary bus services during construction, and maintenance equipment.
| Cost increase and revised opening date: | 
$19 bil. total cost | 
2029 |
- Core project cost: $12.4 billion, following negotiations with delivery partners for the TSD and RIS packages during 2024 and 2025. This includes $1.8 billion in additional state funding provided for the TSD and RIS work packages. The revised in-service date changed to 2029.
- Associated project cost: $6.6 billion, including $1.4 billion in additional funding from Queensland Rail and the Department of Transport and Main Roads bringing the overall CRR project cost to $19 billion.
Compiled by the Queensland Audit Office from Cross River Rail Delivery Authority management reports and Queensland Government ministerial statements.
The announced estimated total cost for the project has changed over time. Figure 4B shows the movement in the announced project budgets, with a focus on the changes that occurred during the 2024–25 and 2025–26 financial years.
Compiled by the Queensland Audit Office from Cross River Rail Delivery Authority management reports and Queensland Government ministerial statements.
Ongoing revisions to costs and delivery timeline
In Major projects 2024 (Report 9: 2024–25), we reported that the CRR project was facing challenges due to market conditions. These included rising material and labour costs, a shortage of skilled labour, supply chain disruptions, and reduced productivity from industrial action.
These challenges continued throughout 2024–25. Industrial tensions, supply chain delays, and a tight labour market in the rail infrastructure sector continued to affect progress. In response, the delivery authority negotiated revised costs with contractors for the Rail, Integration and Systems (RIS) and Tunnel, Stations and Development (TSD) work packages. The negotiations also considered the impact of updated enterprise bargaining agreements for workers employed by delivery partners.
In September 2024, the capital budget for the CRR project increased by $170 million to $8.018 billion. This funding allowed construction on the TSD package to continue while final negotiations were underway.
In June 2025, the delivery authority and Unity (the RIS alliance partner) finalised negotiations and agreed on a revised RIS budget. This amount was not included in the 2025–26 budget because negotiations were completed after the budget was finalised. This will be included in the 2026–27 capital statement.
In October 2025, the delivery authority and Pulse (the TSD delivery partner) finalised negotiations for the TSD package, confirming the cost to complete the work.
These updates affect both the total cost and timeline of the project. In October 2025, the Queensland Government announced that the total project cost will now exceed $19 billion, with first passenger services expected in 2029.
Project delivery timeline
After negotiations for the major work packages were finalised in October 2025, the expected start date for first passenger services was revised from 2026 to 2029 to reflect the challenges of delivering a complex, integrated rail system, similar to those experienced in other jurisdictions. Figure 4C outlines the revised timelines for these packages, based on information provided by the delivery authority.
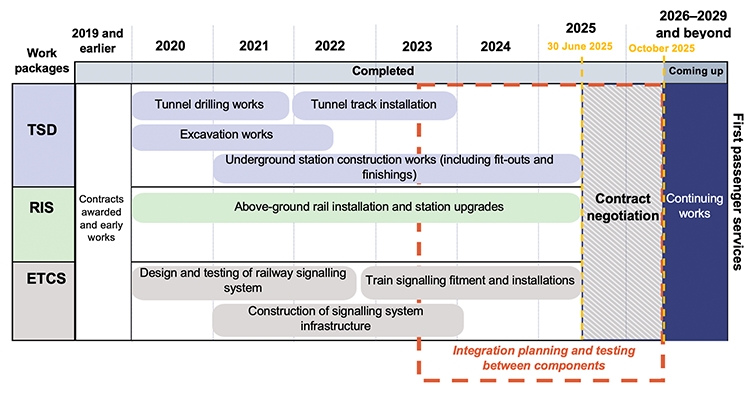
Notes: TSD – Tunnel, Stations and Development; RIS – Rail, Integration and Systems; ETCS – European Train Control System. Refer to Figure D1 in Appendix D for the project details.
Compiled by the Queensland Audit Office from Cross River Rail Delivery Authority management reports.
Project milestones achieved during the year
Figure 4C shows that the project’s final completion is now expected in 2029. However, the delivery authority continued to make progress across all major work packages during 2024–25.
Below-ground works included the ongoing fit-out of underground stations, with installation of escalators, elevators, communication systems, and platform screen doors. Testing activities also progressed. In September 2024, a train entered one of the twin tunnels for the first time and stopped at a newly built underground station platform.
Above ground, the delivery authority handed over the Rocklea, Dutton Park, and Yeerongpilly stations to Queensland Rail. It also completed the new Exhibition station, which was operational for the 2025 Royal Queensland Show (Ekka).
For the European Train Control System (ETCS) package, testing of the new signalling technology continued on the Shorncliffe line.
Additional funding for Cross River Rail-associated projects
The delivery authority is delivering several related projects for the Department of Transport and Main Roads and Queensland Rail. These include:
- upgrades to train stabling yards, bridges, and stations, funded by Queensland Rail under the Complementary and Associated Works package
- implementation of the ETCS, a new rail signalling system, also funded by Queensland Rail
- construction of Pimpama, Hope Island, and Merrimac stations on the Gold Coast, delivered under the New Gold Coast Stations project.
As part of the broader SEQ Rail Connect strategy, which aims to deliver a more integrated transport network across South East Queensland, additional rail infrastructure projects are being planned to complement and support CRR.
Figure 4D outlines the major rail and associated projects linked to CRR, including their funding sources, budget changes, and spending to date.
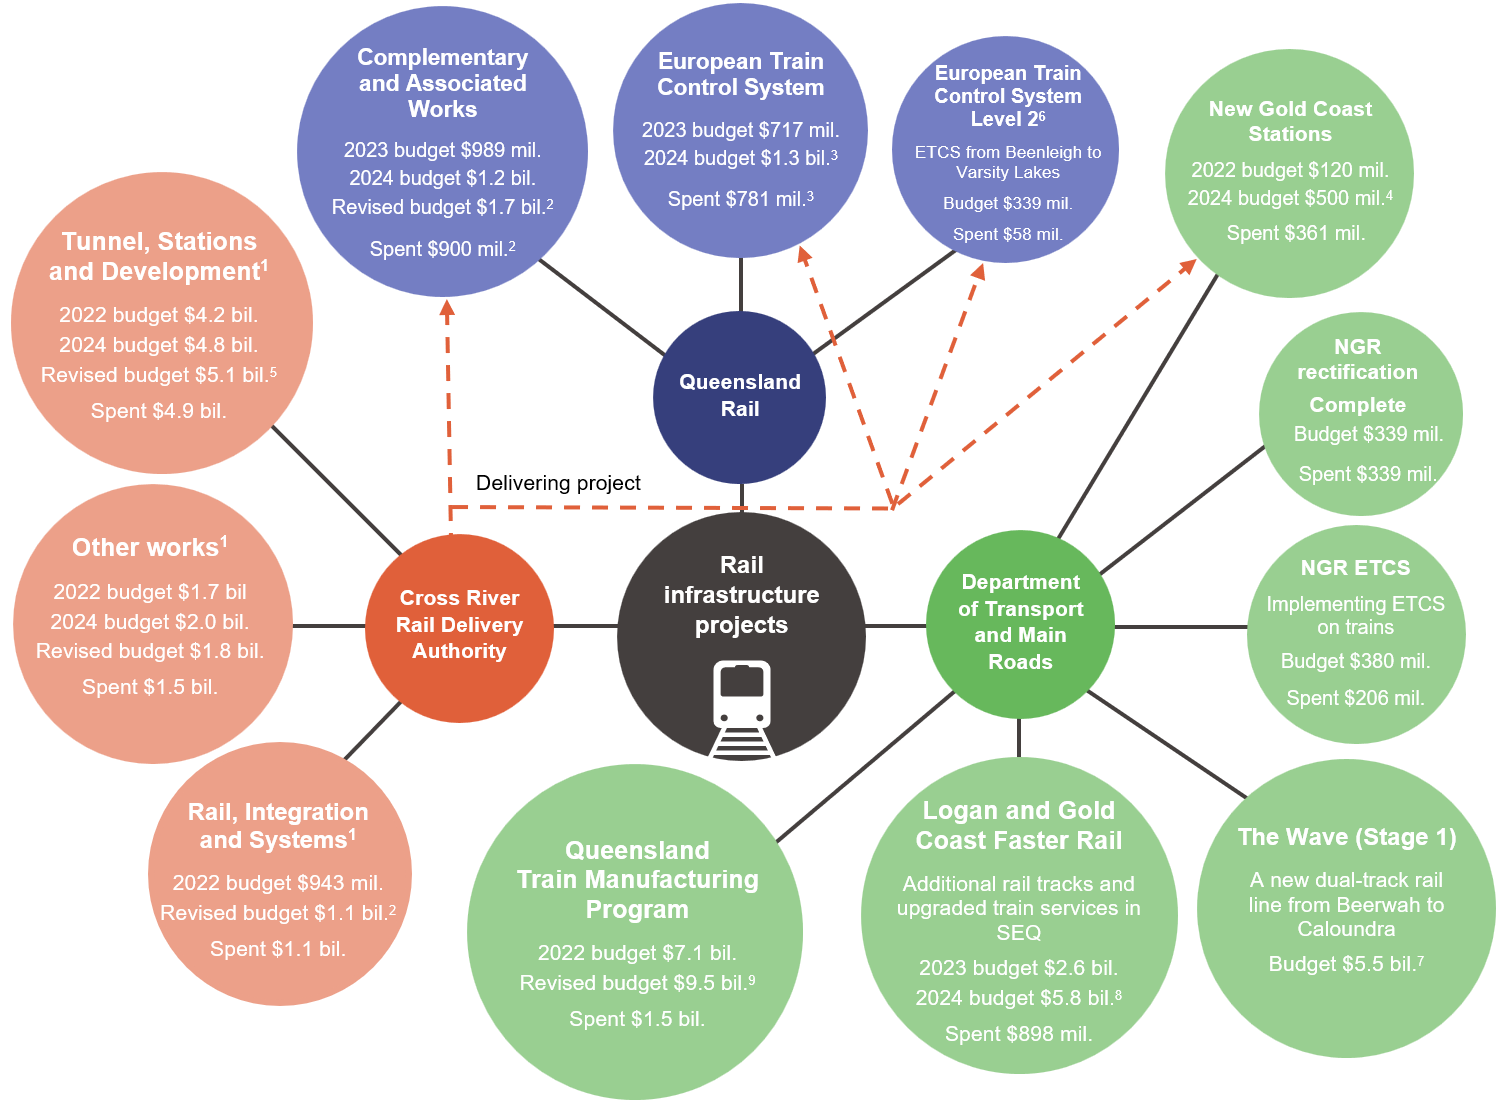
Notes:
1 The Cross River Rail Delivery Authority capital budget for the Cross River Rail project (including private finance) is $8.018 billion.
2 The total budget for the Rail, Integration and Systems work package is $2.8 billion, with Queensland Rail funding $1.7 billion and the delivery authority funding $1.1 billion. The revised budget relates to additional works for Clapham Yard Phase 3. These balances have been sourced from Cross River Rail Delivery Authority reports, and there may be minor differences in spend due to accounting treatment.
3 The total budget for the European Train Control System work package is $1.3 billion fully funded by Queensland Rail. These balances have been sourced from Cross River Rail Delivery Authority reports, and there may be minor differences in spend due to accounting treatment.
4 The total budget for New Gold Coast Stations is $500 million, with the Department of Transport and Main Roads funding $427 million, and Queensland Rail funding $73 million.
5 In 2024, the state committed additional funding of $350 million for the Tunnel, Stations and Development work package.
6 The total budget for the European Train Control System Level 2 signalling technology between Beenleigh and Varsity Lakes is $339 million, fully funded by Queensland Rail.
7 This project was previously known as the Direct Sunshine Coast Rail Line (Stage 1) and will deliver a 19-kilometre dual-track rail line from Beerwah to Caloundra. This project is a planned investment and the estimated cost for Stage 1 is between $5.5 billion and $7 billion.
8 The total budget for the Logan and Gold Coast Faster Rail is $5.75 billion, funded equally by the Australian and Queensland governments.
9 This represents the revised budget for the Queensland Train Manufacturing Program, following the completion of a tender process in 2023. The 2025–26 capital statement includes a component of this overall budget, being $4.9 billion for the manufacturing phase.
NGR – New Generation Rollingstock. SEQ – South East Queensland.
All budgets for major projects include a contingency to allow for any construction risks to be addressed as they arise. For the CRR project, this is included in the Other works revised budget of $1.8 billion. As of 30 June 2025, the contingency for the CRR project remained within the revised budget.
Compiled by the Queensland Audit Office from Cross River Rail Delivery Authority management reports, and information from the Department of Transport and Main Roads and from the 2025–26 capital statement.