
Overview
Entities within Queensland’s education sector help individuals transition through all stages of their schooling. They provide the knowledge and skills that students need to engage in future education, training, or the workforce.
Tabled 18 June 2026.

Report on a page
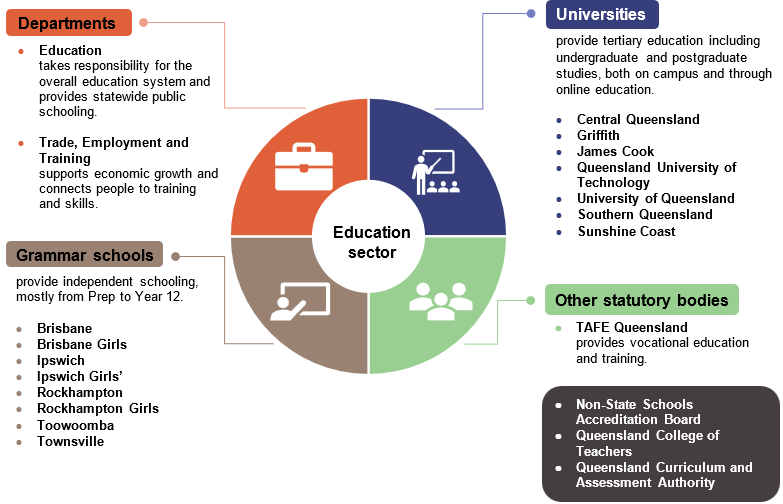
This report summarises the audit results of the entities in Queensland’s education sector. These include the Department of Education; the Department of Trade, Employment and Training; TAFE Queensland; 7 universities; 8 grammar schools; and other statutory bodies.
The entities’ financial statements are reliable
The financial statements of the education entities are reliable and comply with relevant reporting requirements. All education entities met the legislative deadlines for signing their financial statements.
The entities have resolved most of the deficiencies we identified in previous years, and we found fewer deficiencies across the sector this year. Most related to information security – specifically how they manage, secure, and restrict access to their systems. The entities must continuously strengthen all their information systems to respond to evolving cyber security risks.
The universities’ financial performance has improved
All but one university made a surplus this year. The universities reported overall operating results of $533.1 million compared to $465.5 million last year. In the 2025 calendar year, the total revenue for universities increased by approximately 5 per cent to $7.8 billion. This is because of higher student enrolments from international students and increased Australian Government funding relating to domestic students. At the same time, costs continue to escalate, primarily due to increased wages.
The Australian Government is introducing major funding reforms for the university sector. A new ‘Managed Growth Funding System’ will be phased in during 2026 and fully implemented from 1 January 2027, subject to legislation. Demand-driven needs-based funding is also being implemented. Both aim to support students from under-represented backgrounds, including First Nations students, those from low socio-economic backgrounds, and regional and rural communities.
Wage underpayments for universities remain a risk
All universities are continuing to assess the extent of their historical underpayments of staff wages. They are taking steps to address them, including making remediation payments to affected staff.
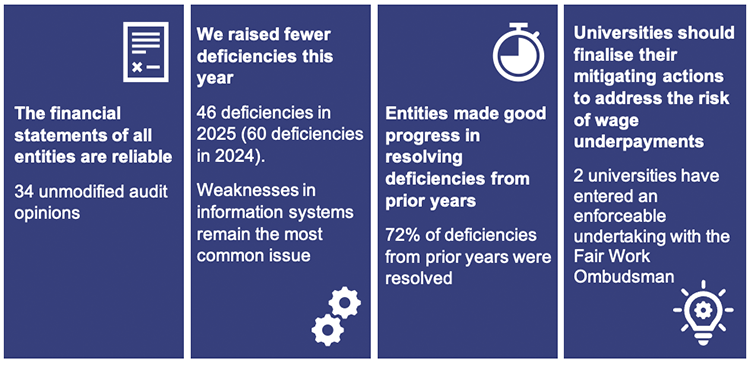
Griffith University and Queensland University of Technology have entered an enforceable undertaking with the Fair Work Ombudsman to address the concerns raised and prevent future underpayments.
TAFE Queensland’s financial sustainability remains a risk
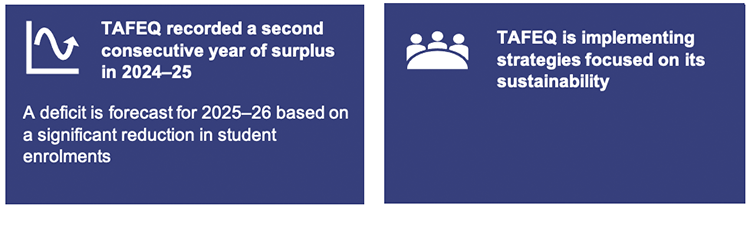
TAFE Queensland made its second consecutive surplus in 2024–25, because of new state government funding. It is forecasting a deficit in 2025–26 because it expects a significant reduction in student enrolments. TAFE Queensland is implementing strategies focused on its sustainability.
Departments are spending more money on maintenance
Departments have increased their spending on maintenance by 22 per cent during 2024–25 and continue to achieve their targets. Delivering their planned capital expenditure however has been an ongoing challenge for both departments for at least the last 5 years. The departments have improved their knowledge of their infrastructure by completing their detailed assessments of the condition of their assets. This helps inform future capital needs and maintenance programs.
1. Recommendations
We do not make any new recommendations to education entities in this report. Instead, we draw their attention to recommendations from previous years that require further action.
We have reported internal control deficiencies to individual entities during our audits.
Education entities need to take further action on our recommendations from previous years
We encourage the education entities to act on unresolved recommendations from previous years’ reports. These are summarised in the following table.
| Theme | Summary of recommendation | Education report |
|---|---|---|
| Information systems | Strengthen information and cyber security controls by reviewing access, monitoring activity, and strengthening password controls, particularly for third-party users. (Chapter 3 in this year’s report) | Report 13: 2023–24 |
| Strengthen the security of information systems by assigning only the minimum level of access, monitoring the activities of users with privileged (unrestricted) access, and implementing strong password controls and multi-factor authentication. (Chapter 3 in this year’s report) | Report 18: 2020–21 | |
| Employee expenses | Address the risk of wage underpayments by assessing historical pay practices, reviewing employment contracts and enterprise agreements, training staff, and evaluating payroll and timekeeping systems to enable accurate and thorough record-keeping practices. (Chapter 3 in this year’s report) | Report 13: 2023–24 |
| Financial sustainability | TAFE Queensland needs to continue developing its understanding of the value and costs of its services. It should use this in making decisions about its activities and implementing strategies to support its sustainability. (Chapter 4 in this year’s report) | Report 19: 2021–22 |
We have included a full list of prior year recommendations and their status in Appendix D.
Reference to comments
In accordance with s. 64 of the Auditor-General Act 2009, we provided a copy of this report to relevant entities. In reaching our conclusions, we considered their views and represented them to the extent we deemed relevant and warranted. Any formal responses from the entities are at Appendix A.
2. Entities in this report
This report summarises the financial audit results for education sector entities as at their year-end dates for preparing financial statements. For the Department of Education; the Department of Trade, Employment and Training; TAFE Queensland; and some statutory bodies, this was 30 June 2025. For universities, grammar schools, and other statutory bodies, it was 31 December 2025.
We provide 34 opinions for this sector. This report focuses on the 18 entities (and the entities they control) highlighted in Figure 2A. They represent 99.5 per cent of the revenue within the education sector.
Notes: * These do not include entities exempted from audit by the Auditor-General (see Appendix F), entities not preparing financial reports (see Appendix G), or entities audited by arrangement.
Queensland Audit Office.
3. Results of our audits
This chapter provides an overview of our audit opinions for entities in the education sector. It also provides conclusions on the effectiveness of the systems and processes (internal controls) the entities use to prepare financial statements.
Where we identify weaknesses in the internal controls, we categorise them as either deficiencies – those of lower risk that can be corrected over time – or significant deficiencies – those of higher risk that require immediate action by management. We report any weaknesses in the design or operation of those internal controls to management for action.
Chapter snapshot
Audit opinion results
We issued unmodified audit opinions for all education entities in Queensland. This means the results in their financial statements can be relied upon.
We included an emphasis of matter for 2 entities relating to the reporting framework their financial statements were prepared under. We include an emphasis of matter to help users better understand issues in financial statements. It does not change the audit opinion.
All entities reported their results within their legislative deadlines. Appendix E provides details of the audit opinions we issued for education sector entities in the 2025 financial year. For universities, grammar schools, and one statutory body, this is the 2025 calendar year. For the remaining education entities, this is the 2024–25 financial year.
Entities not preparing financial statements
Not all Queensland public sector education entities produce financial statements. Appendix G lists the entities not preparing financial statements and the reasons why.
Internal controls are generally effective
In this section, we report on the 7 universities, 8 grammar schools, and 3 other education entities. We do not analyse the departments, statutory bodies, and other controlled entities that are included in State entities 2025 (Report 11: 2025–26).
Overall, we found the education entities’ internal controls are generally effective, but they can be improved.
This year, we have reported 46 new control deficiencies, including 2 new significant deficiencies (2024: 60 new control deficiencies, including 7 new significant deficiencies).
The significant deficiencies relate to:
- one university not disabling access for terminated employee accounts in a timely manner
- staff at a controlled entity of one university approving payments that exceeded their delegations.
Figure 3A shows the types of deficiencies we identified. It includes unresolved deficiencies from prior years as of 31 December 2025.
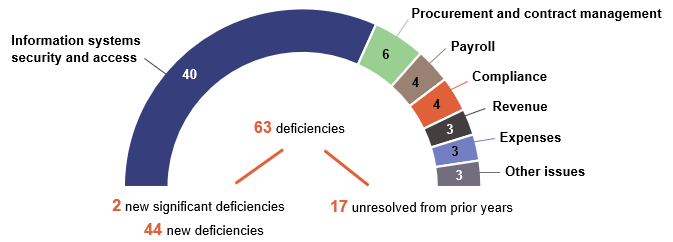
Compiled by the Queensland Audit Office, from the reports we have issued to the relevant entities.
Weaknesses in the security of information systems at universities continue to account for most of the deficiencies we identified. Despite this, we have been able to rely on the systems and processes they used to prepare financial statements.
The education entities continue to address control deficiencies we have identified in previous years. This year, they resolved 72 per cent of these issues. As at 31 December 2025, 2 significant deficiencies and 15 deficiencies remain outstanding.
The majority of these open issues relate to information systems (82 per cent), which entities expect to resolve within the next 12 months. We expanded our scope last year in response to the growing complexity of systems and cyber security risks. As a result, we identified more information system deficiencies, and the entities have been working through these.
In State entities 2025 (Report 11: 2025–26), we reported 56 deficiencies for the education entities that produced financial statements as at 30 June 2025. These included 32 new deficiencies and 24 unresolved from prior years. Of these, 82 per cent were related to weaknesses in the security of information systems and 7 per cent to procurement and contract management processes.
Universities’ controls over their information systems are improving but require ongoing attention

Information systems are an integral part of entities' day-to-day operations. They store financial and non-financial data for the entities, its employees, vendors, and students. Strong internal controls over information systems help protect sensitive data, support operational stability, and preserve public trust.
This year, we identified 25 deficiencies – including one significant deficiency – relating to weaknesses in information systems controls at universities. Of the 48 deficiencies we identified last year, 14 remain unresolved as at 31 December 2025. However, the universities had addressed all 4 of the significant deficiencies from last year. Our findings relate to:
- user access and dormant accounts. User access controls determine who can access which parts of the system. Dormant accounts are unused accounts that have been inactive for a prolonged period of time. Strong controls over user access can help reduce unauthorised access and cyber threats
- passwords and multi-factor authentication. Multi-factor authentication requires several steps to access accounts – for example, a username and password, plus a code sent to a mobile. Strong passwords and multiple layers of security can help prevent unauthorised access
- privileged users and service accounts. Privileged users have unrestricted access and can make changes to the system, while service accounts perform system-related tasks that do not require human intervention. Restricting the number of privileged users and service accounts is one of the mitigating strategies in ensuring the security of systems.
Universities need to continue strengthening their controls to manage evolving cyber security risks and to prevent inappropriate access to the information they hold.
These themes also feature in our Information systems 2025 (Report 6: 2025–26) report.
Universities continue to assess and address wage underpayments

The Australian university sector has been significantly affected by historical wage underpayments to staff. The Fair Work Ombudsman identified systemic failures in universities’ compliance, central oversight, and governance processes, which contributed to these underpayments.
In Education 2024 (Report 15: 2024–25), we reported that all 7 Queensland public universities were continuing to assess the extent of any historical underpayments of staff wages and entitlements. They were taking steps to address the issues they identified.
In 2025, 4 universities recorded liabilities of $2.3 million in total (2024: 5 universities totalling $8.8 million) relating to wage underpayments. This represented estimates of amounts still owing, or likely to be owing.
The overall decrease is due to remediation payments the universities made during the year. Collectively, the Queensland universities repaid $5.6 million to staff in 2025 (2024: $23.4 million). The decrease in liability has been partially offset as universities have identified more instances and new categories of underpayments.
Two universities have entered into a formal enforceable undertaking with the Fair Work Ombudsman during the year – Griffith University in June 2025 and Queensland University of Technology in November 2025. This is a legally binding agreement requiring these universities to:
- rectify identified workplace law breaches
- repay underpaid staff
- improve payroll systems and controls
- implement stronger governance measures to prevent future wage underpayments.
Both universities had previously engaged experts to review their compliance with the enterprise agreements and made remediation payments where they identified issues.
James Cook University has identified potential historical wage compliance concerns and is conducting a comprehensive review of 6 years of payroll records. Queensland University of Technology is also performing a detailed external review of historical payroll data over the same period, as required under its enforceable undertaking.
When these 2 universities finalised their 2025 financial statements, they were unable to reliably estimate the potential liability arising from this work. For James Cook University, this was because its data validation process was still ongoing, while Queensland University of Technology was at an early stage of its independent review.

| Universities should continue to focus on managing the risk of wage underpayments Universities that have not already done so should finalise their mitigating actions to address the risk of future wage underpayments. They should also give priority to identifying and remediating historical wage underpayments to affected employees. Mitigating actions include:
|
Education sector entities can improve internal controls in some areas
Procurement and contract management processes

We audit procurement and contract management processes and controls, with a focus on the appropriateness of procurement methods, on decision-making processes, and on whether conflicts of interest are declared and managed.
We raised 6 deficiencies relating to procurement controls this year (2024: nil). The nature of the procurement issues include:
- missing or incomplete conflict of interest forms. This raises concerns about the integrity of procurement decisions
- procurement policies and contract management frameworks that do not align with the requirements in the Queensland Procurement Policy 2023.
The new Queensland Procurement Policy 2026 was effective from 1 January 2026. Entities will need to ensure compliance with the procurement policy that is effective at the time of procuring goods or services.
In State entities 2025 (Report 11: 2025–26), we have provided further details of the obligations for entities under the revised Queensland procurement policy.
Payroll processes and controls

Entities establish controls over employee processes and payments, and we test these as part of our audits of the financial statements. Effective payroll processes and controls reduce the risk of fraud and error and help to ensure employees receive the correct payments.
We continue to identify deficiencies in payroll processes at education entities. We raised 3 deficiencies this year (2024: 4) and one remains unresolved from the prior year. The nature of the payroll issues we reported this year include:
- approvals being obtained for new employees after they had already commenced
- incorrect pay rates being applied for an employee in the payroll system, resulting in underpayment of their salary.
4. Financial performance of education sector entities
This chapter analyses the financial performance, position, and sustainability of education entities. In our discussion of sustainability, we consider both financial sustainability and emerging issues relevant to the sector.
We examine the financial performance of the departments, universities, grammar schools, and TAFE Queensland, and we also report on changes in the value of the education entities’ assets.
The universities and grammar schools have a financial year end of 31 December. For that reason, we report on their results on a calendar-year basis. As TAFE Queensland and the departments have a year end of 30 June, we use financial years – for example, 2024–25 – when reporting on them.
The financial performance of universities has improved
Section snapshot 4.1
Queensland universities reported overall operating results (revenue less expenses) of $533.1 million in 2025, an increase from the $465.5 million surplus in 2024. All universities made a surplus in 2025, except for Griffith University. It wrote off previously capitalised building works after deciding not to proceed with a project. This resulted in a deficit.
This year, the total revenue for universities increased by approximately 5 per cent to $7.8 billion. The University of Queensland represents $3 billion or 38 per cent of this revenue.
This was because of an increase in revenue from international students and higher Australian Government funding relating to domestic students across the sector. At the same time, costs continued to escalate, especially for employee expenses.
To assess the universities’ long-term financial sustainability, we calculate their operating result ratios (revenue less expenses, expressed as a percentage of total revenue) as an average over time. Figure 4A shows the operating result ratios for each university for the past 5 years.
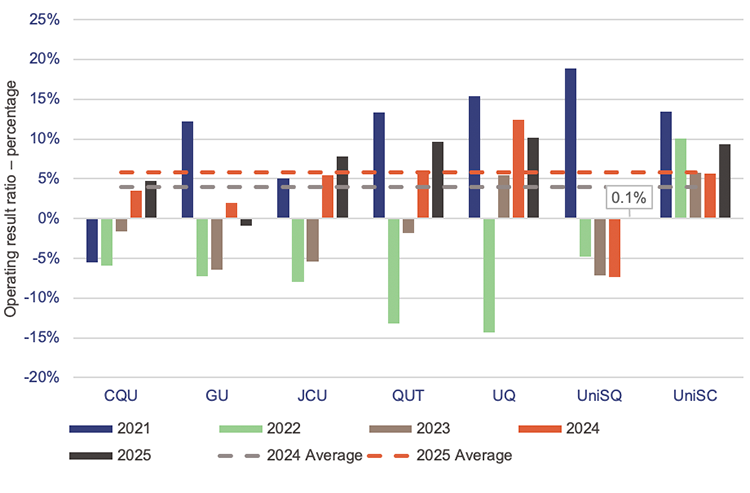
Notes: CQU – Central Queensland University; GU – Griffith University; JCU – James Cook University; QUT – Queensland University of Technology; UQ – The University of Queensland; UniSQ – University of Southern Queensland; UniSC – University of the Sunshine Coast.
These ratios include controlled entities, whose finances and operations are controlled by one of the universities.
Queensland Audit Office.
This year, Griffith University recorded a deficit of $11 million. Due to a change in strategic priorities, the university decided not to proceed with the construction of a new building at its Nathan campus in 2025. This resulted in the university writing off previously recognised capital work-in-progress costs of $66.7 million this year. Without this one-off transaction, Griffith University would have recorded a surplus.
The university is implementing 2 significant operational changes, including:
- obtaining a campus location in Brisbane City in 2024. Star Entertainment Qld Limited transferred a 99-year lease for the Treasury Building (the old casino building) to the university for $67.4 million. This is primarily made up of a cash payment of $60.5 million and the value of future lease payments to be made by the university to the state government – $5.7 million at the date of transfer. The university is currently refurbishing the building’s fit-out to open a new Brisbane CBD campus in 2027
- phasing out the Mount Gravatt campus, which sits on land owned by the state government, by 2026. While the onsite primary school and community and sporting facilities will remain operational, the state government has sought expressions of interest to help plan the future use of this campus.
University of Southern Queensland recorded a surplus of $0.4 million in 2025, after 3 years of deficits. It has implemented strategies to reduce its costs, including restructuring its organisation in 2025. The university offered voluntary redundancies to manage its future payroll costs. In 2025, it reduced its employee-related expenses by $13.6 million (4.9 per cent).
The University of Queensland’s operating results include a one-off gain of $78.8 million. This was from the sale of its shares in an entity that helps turn research developed at the university into commercial products, services, and businesses.
Financial transactions and events over the last few years have affected the results of some of the universities. For example:
- In 2021, the net results for Queensland University of Technology and University of Southern Queensland included one-off gains following the restructure of their investment in Education Australia Limited. They recorded this as revenue. Other Queensland universities recorded this as equity (assets less liabilities).
- In 2022, all universities, except University of the Sunshine Coast, experienced a loss due to investment market volatility. The university sector held $3.2 billion in financial assets at that time and was significantly impacted by a decline in global financial markets.
- In 2023, the net results of Griffith University, James Cook University, and The University of Queensland reflected a reduction in the value of a receivable of $22.8 million from the Australian Taxation Office (ATO), which they recorded as an expense. Other Queensland universities continued to record it as an amount owing from the ATO.
There is an ongoing dispute with the ATO over franking credits (see Universities continue to dispute their franking credit claims with the Australian Taxation Office later in this chapter).
Analysis of university sector revenue
In 2025, the total revenue for universities increased to $7.8 billion, representing a $0.4 billion (5.3 per cent) increase from last year. The main drivers for increased revenue this year were fees and charges and government grants.
Revenue from international and domestic student numbers has increased

The number of international students, along with increases in course fees, affects the amount of revenue received through fees and charges. The number of domestic students can also influence the amount of revenue universities receive – through government grants.
In 2025, total revenue recorded by the university sector from international students increased by $221.1 million (12.5 per cent) (2024: $204.7 million – 13.1 per cent). Total enrolments increased by 6.2 per cent (2024: 5.9 per cent) due to continued strong post-pandemic demand, targeted strategies to recruit international students, and a focus on increasing the availability of high-demand courses.
International student enrolments can be affected by policy changes related to visa processing, the geopolitical environment, and competitive offerings from other international universities. In July 2025, the Australian Government increased the non-refundable student visa application fee by 25 per cent to $2,000, following a 125 per cent increase in July 2024. In November 2025, the Australian Government also made changes to its visa policy by clarifying the order of priorities when assessing international student visa applications.
Total revenue recorded by the university sector from domestic students increased by $215.2 million (7.7 per cent) (2024: $207.6 million – 8 per cent), due to an increase in Australian Government financial assistance. Through Commonwealth Grant Scheme funding, the Australian Government subsidises tuition costs for higher education students across a wide range of study disciplines and qualification levels.
Domestic student enrolments have increased at all universities by 6.3 per cent in the last year (2024: 1.3 per cent). Increased demand in fields with skills shortages and clear job outcomes – such as teaching, health, and social services – has contributed to domestic enrolment growth.
Figure 4B shows the impact that student enrolments have had on both international and domestic student revenue over the last 5 years.
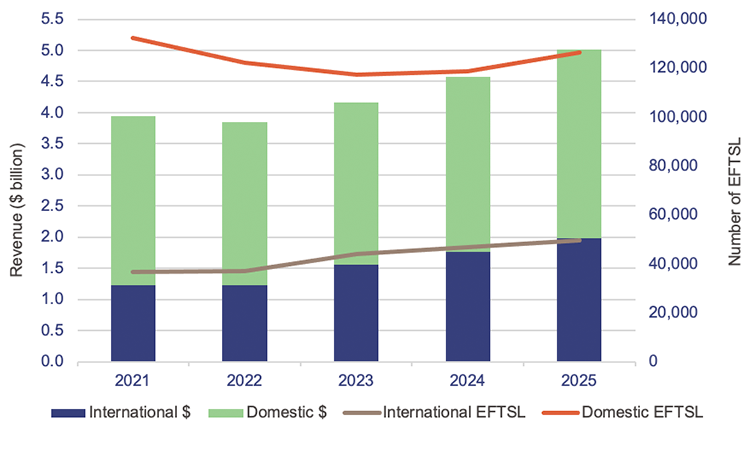
Note: Not all students study for a whole year. Equivalent full-time student load (EFTSL) is a way of representing the various study loads as a proportion of the study load the students would have if they were studying full time for one year. ‘Number of EFTSL’ adds them all together.
Queensland Audit Office.
Universities received high returns on their investments again this year

Universities’ investments in managed funds (where their monies are pooled together with that of other investors) have performed strongly since 2023, influenced by favourable market conditions and investment strategies. This can fluctuate from year to year.
In 2025, the sector recorded total investment income of $447.2 million (2024: $582 million). Investment income includes interest, dividends, and gains and losses.
Gains or losses from investments are changes in the value of an investment. These may be realised – translated into actual cash – when investments are sold or income is received. They are unrealised when investments are still held. Unrealised gains and losses can bring volatility to the university’s operating results, because investment values can fluctuate.
Figure 4C shows the impact that investment market volatility has had on the university sector’s operating results over the last 5 years.
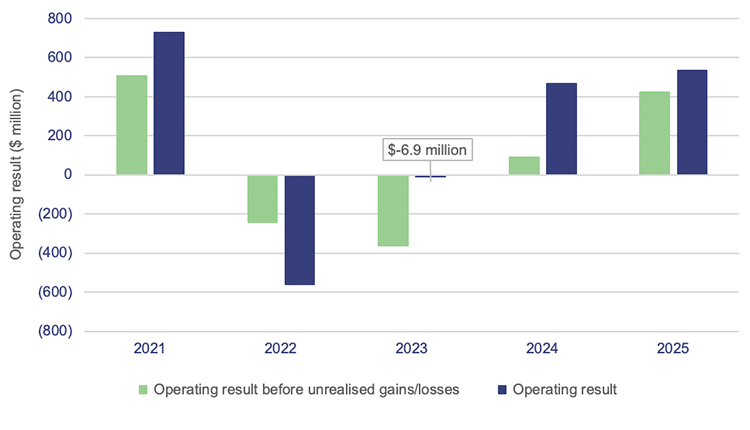
Queensland Audit Office.
Figure 4C shows that in 2025, before including any unrealised gains from investments, the sector would have recorded a surplus of $422.4 million, compared to the actual surplus of $533.1 million. Griffith University, Queensland University of Technology, and The University of Queensland hold larger investment portfolios than the other universities. As a result, they are more affected by fluctuations in market conditions.
Without the gain:
- Griffith University would have reported a deficit of $15.8 million instead of a deficit of $11 million (2024: $6.5 million deficit instead of $21.8 million surplus)
- Queensland University of Technology would have reported a surplus of $107.4 million instead of a surplus of $134 million (2024: $15.7 million surplus instead of $78.3 million surplus)
- The University of Queensland would have reported a surplus of $214 million instead of a surplus of $284.1 million (2024: $41.7 million surplus instead of $314.6 million surplus).
Analysis of university sector expenses
In 2025, total expenses for universities grew to $7.2 billion – a $0.3 billion (4.7 per cent) increase from the previous year. The main drivers for increased expenditure this year were employee-related expenses and ‘other expenses’.
Employee expenses increased, but at a slower rate than last year

Employee expenses, including wages, salaries, and associated costs such as superannuation and leave entitlements, continue to be the universities’ biggest cost – $4 billion (55.6 per cent of total expenses).
Total employee expenses incurred by the university sector increased by $128 million (3.3 per cent). This was primarily from wage increases and a 2.9 per cent increase in the number of full-time equivalent employees. Ongoing wage compliance and remediation payments made relating to prior periods (see Chapter 3) also contributed.
The growth in employee expenses was less than the 5.3 per cent increase in the previous year.
As at 31 December 2025, the university sector had 24,546 full-time equivalent employees, with the average employee expense per employee being $169,000 (2024: $170,000).
Other expenses also increased

‘Other expenses’ include scholarships and prizes, professional services fees, collaborative projects, and expenses incurred in the operation of the university. They add up to 31.3 per cent of total expenses.
In 2025, total other expenses incurred by the university sector increased by $91.5 million (4.2 per cent). Last year, it was $79 million. This represents a 3.8 per cent increase.
Some key contributors included an increase of:
- $40.6 million (9.7 per cent) in scholarships, grants, and prizes. These relate to financial support provided to students and researchers to support study, research, and academic achievement
- $28.1 million (14.8 per cent) in collaborative projects. These relate to costs incurred when working with external parties to deliver joint research, teaching, or initiatives.
Universities continue to dispute their franking credit claims with the Australia Taxation Office
In Education 2024 (Report 15: 2024–25), we reported that the 7 Queensland universities, along with 31 other Australian universities, had lodged a formal objection with the Australian Taxation Office, disagreeing with its decision to decline their eligibility for a refund of their franking credits.
Franking credits represent the tax a business pays on its profits. This saves its investors from having to pay tax on their share of profits, which are known as dividends. Universities seek a refund from the Australian Taxation Office on their investments.
The franking credit claim for each university was $22.8 million. For Queensland public universities, this totalled $159.6 million.
In January 2025, the Australian Taxation Office formally responded to 2 universities in other states (Federation University Australia and University of Wollongong), standing by its original decision. These 2 universities are appealing against the decision in the Federal Court of Australia. The objections for each of the other 36 universities remain on hold pending the outcome of the legal proceedings.
As with last year, Queensland universities have used different financial reporting treatments, which highlights the uncertainty regarding the issue. We again concluded that we have sufficient and appropriate audit evidence to support each university’s financial reporting treatment, which has not changed from last year.
Major funding reforms in the university sector from 2026
The Australian Government is committing $2.5 billion over the medium term – from 2024–25 to 2034–35 – to new higher education funding reforms aimed at supporting student growth and improving the system. A new ‘Managed Growth Funding System’ is being introduced through a staged implementation, with a transition year in 2026 and full implementation from 1 January 2027.
The transition in 2026 is progressively aligning funding with student demand, while providing guarantees that universities will not receive less Commonwealth Grant Scheme funding than they did in 2025.
In addition, from 1 January 2026, demand‑driven needs‑based funding will provide additional support to universities based on enrolments of students from under-represented backgrounds. This will operate alongside the Managed Growth Funding System.
The new system and funding are intended to better support student demand, maintain sustainable growth, and increase opportunities for students from under-represented backgrounds. These include First Nations students, those from low socio-economic backgrounds, and students from regional and rural communities.
Details on the funding approach and implementation arrangements for full implementation in 2027 is subject to further sector consultation and legislation.
To support the financial sustainability of universities and Australia’s higher education sector more broadly, a funding guarantee for publicly funded universities will remain in place until 2031, guaranteeing 97.5 per cent of Commonwealth Grant Scheme funding from each previous year.
In 2025, the Australian Tertiary Education Commission was established as an independent steward of Australia’s higher education system. It is expected to be fully operational by 2026. As a federal government entity, it will oversee the implementation and operation of the new Managed Growth Funding System and needs‑based funding to improve equity, sustainability, and alignment with national skills priorities.
TAFE Queensland’s financial sustainability remains a risk
Section snapshot 4.2
TAFE Queensland (TAFEQ) is the largest public provider of vocational education and training in Queensland. It provides services across all parts of Queensland, including rural and remote locations and areas of lower current demand. This is to ensure equitable access to all students across the state.
In 2023–24, TAFEQ met its expenses from its revenue, recording a surplus of $17.5 million – its first since the 2020–21 financial year. In 2024–25, it again recorded a surplus – $25.1 million – driven by the new Community Service Obligation funding of $46.1 million provided by the Queensland Government. Without this, it would have recorded a deficit.
This funding is in place for a 2-year period ending 30 June 2026 and is designed to support training services and activities that TAFEQ delivers where it is not in its commercial interest to do so.
Figure 4D compares the training revenue and employee expenses over the last 5 years. It highlights that the introduction of Fee-Free TAFE in January 2023 – a joint federal and state government funding initiative – led to increased student enrolments in 2023–24. This increase was largely retained in 2024–25.
The Fee-Free TAFE program is scheduled to continue until December 2026. TAFEQ is forecasting a deficit of $26.5 million in 2025–26 due to a reduction in overall student demand and enrolments, with enrolments returning to levels closer to before the program started. The removal of eligible courses previously included under the Fee-Free TAFE program has resulted in a significant decline in demand.
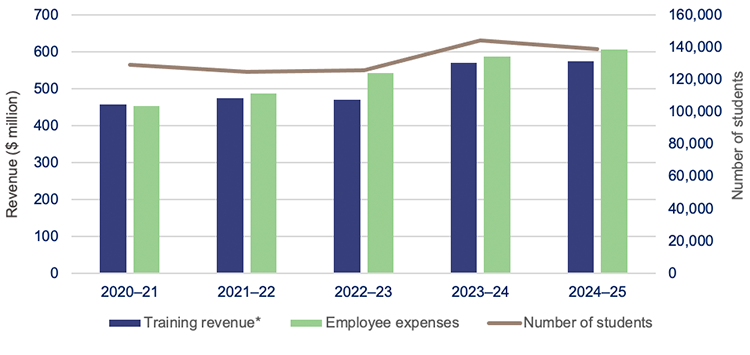
Note: * ‘Training revenue’ excludes grant contributions received from the state government to support TAFE Queensland’s operations.
Queensland Audit Office, from information provided by TAFE Queensland.
Employee expenses account for 69.6 per cent of total expenses. In 2024–25, employee expenses increased by $20.1 million (3.4 per cent) due to salary and wage increases under enterprise bargaining agreements. The growth in employee expenses was less than the 8.1 per cent increase in 2023–24.
As at 30 June 2025, TAFEQ had 4,338 full-time equivalent employees – a decrease of 1.8 per cent from 2023–24 – with the average employee expense per employee being $140,000 (2023–24: $133,000).
Long-term strategies to become financially sustainable
TAFEQ is continuing to implement strategies to improve its financial sustainability. Figure 4E shows the status of key projects to assist with this.
Project | Background | Status |
|---|---|---|

Customer Experience | This is to increase the conversion rate of student enquiries to enrolments. | This was completed in January 2026. Improvements have been noted in a range of metrics such as higher conversion to enrolments and a reduction in call dropouts. |

Education Planning Tool | This is an organisation-wide tool that will enable a consistent approach to planning and enhance reporting (for example, on class size, teacher capacity, and productivity). | Stages 1 and 2 are complete. Complexities have extended the expected completion of Stage 3 from June 2026 to December 2026. |

Business Data Improvement Plan | This is a jointly managed project between TAFEQ and the Department of Trade, Employment and Training. It started in November 2025. It involves improving the quality and transparency of data to understand the cost of TAFEQ’s activities at a product, course, and location level. | It is expected to be complete in June 2026. |

Financial Sustainability and Resilience Plan (FSRP) | This involves TAFEQ reviewing its business operations to ensure that it has a financially strong business structure. The FSRP was approved in October 2024, and it identified 27 actions to be implemented, such as reviews of administrative and support workforce structures, and of discretionary spending. | This is in progress, with one action completed as at January 2026. TAFEQ will reassess the open actions within the FSRP, and transition these into the TAFEQ Financial Strategy (refer below). The FSRP will cease in its current form. |

TAFEQ Financial Strategy | This aims to see TAFEQ return to a break-even position by June 2028. It will focus on increasing revenue and demand, reducing costs, and managing capital investments; while maintaining high-quality teaching and learning outcomes. | The strategy is expected to be approved in June 2026. |
Queensland Audit Office, from information provided by TAFE Queensland.
Financial results of grammar schools
Section snapshot 4.3
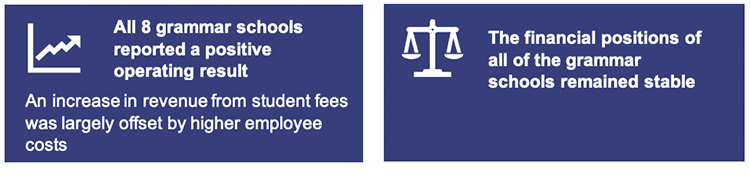
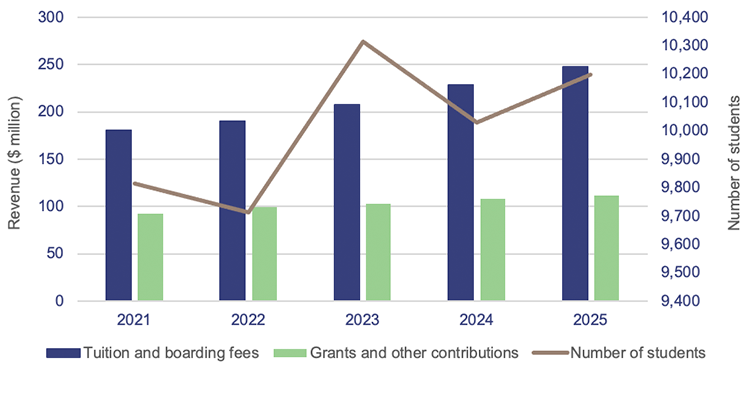
In 2025, all 8 grammar schools met their expenses from their revenue, recording overall surpluses of $17.1 million (2024: $16.5 million). An increase in revenue from tuition and boarding fees contributed to this, offset largely by an increase in employee costs.
Grammar schools generate most of their revenue from tuition, boarding fees, and government grants. From 2020, the Australian Government began phasing in a new ‘Direct Measure of Income’ methodology that uses data on parental income to determine how much funding each school receives. For grammar schools, this has slowed the growth of government funding, leading them to rely on higher student fees to cover rising costs.
Figure 4F shows that revenue from students has improved over the last 5 years, in line with an overall increase in student numbers over the period.
Queensland Audit Office.
Employee expenses account for 63.7 per cent of total expenses. In 2025, total employee expenses incurred by grammar schools increased by $18.6 million, or 7.9 per cent. This was due to salary and wage increases, and an increase in the workforce to support growth in student numbers and continued expansion of specialised programs. The growth in employee expenses was less than the 9.5 per cent increase in 2024.
As at 31 December 2025, grammar schools had 1,759 full-time equivalent employees – an increase of 6.2 per cent from the previous year – with the average employee expense per employee being $143,000 (2024: $140,000). Grammar schools are continuing to implement various cost-saving measures to manage their expenses.
Grammar schools have $1.2 billion in assets and $112 million in borrowings
Grammar schools own $1.2 billion in assets, most of which relate to land, buildings, and improvements. Their assets and capital projects are funded from surpluses and borrowings.
Borrowings of $112 million (2024: $106.7 million) are provided through Queensland Treasury Corporation. They increased by $18 million in 2025 for the first phase of Toowoomba Grammar School’s multi-year masterplan project.
Brisbane, Brisbane Girls, and Toowoomba grammar schools collectively hold 76 per cent of the total borrowings. Their ‘gearing ratios’, which measure the proportion of total capital funded by debt, range from 5 per cent to 15 per cent in 2025. This indicates that the entities are able to service the levels of debt they hold from their operating results.
Financial results of departments
Our analysis of the overall financial result of the state is included in Managing Queensland’s finances 2025 (Report 10: 2025–26). This includes the 2 departments in the education sector – Department of Education and Department of Trade, Employment and Training. We have included an overview of financial results for these departments below.
In 2024–25, the Department of Education met its expenses from its revenue, recording a surplus of $169.6 million. The Department of Trade, Employment and Training was close to a break-even position, with a small deficit.
Figure 4G shows the overall performance for the year compared to the previous year, as well as the movements in net assets (assets less liabilities) in 2024–25 for both departments.
Department of Education
| Movements from 2023–24 | Key drivers | |
|---|---|---|
Revenue 
| ▲ $1 billion or 7.7% | Revenue is mainly from appropriations (allocated by parliament during the budget process). The increase is a result of the agreement signed between the Australian Government and the department in March 2025 that enables continued funding for schools from 2025 to 2034. |
Expenses 
| ▲ $957.8 million or 7.4% | This was primarily due to an increase in employee expenses driven by a higher number of employees, and wage increases. The movement was also partially attributable to higher building maintenance costs and depreciation expenses. |
Net assets 
| ▲ $4.2 billion or 12.1% | This was mainly due to an increase in the value of the department’s property, plant and equipment. It was driven by upward movements in the valuation of assets, and capital spending of $722.5 million in schools and buildings. Current market conditions continue to increase construction and labour costs, making it more expensive to upgrade or replace buildings than in the past. |
Department of Trade, Employment and Training
| Movements from 2023–24 | Key drivers | |
|---|---|---|
Revenue
| ▼ $103.8 million or 6.1% | This was mainly due to lower appropriations, which reflect the transfer of the Youth Justice function to another department in 2023–24. If we exclude the impact of this transfer, total revenue would have increased by $76.8 million or 5 per cent in 2024–25 due to additional funding for the department’s training and skills programs. |
Expenses
| ▼ $81.6 million or 4.8% | This was primarily due to a decrease in employee expenses, as the Youth Justice function was transferred out of the department in 2023–24. If we exclude the impact of this transfer, total expenses would have increased by $99 million or 6.6 per cent in 2024–25 due to higher depreciation on assets and costs for administering grants to vocational education providers. |
Net assets
| ▲ $160 million or 6.2% | This was mainly due to an increase in the value of the department’s property, plant and equipment. Current market conditions continue to increase construction and labour costs, making it more expensive to upgrade or replace buildings than in the past. |
Queensland Audit Office.
Measuring the value of assets
Section snapshot 4.4
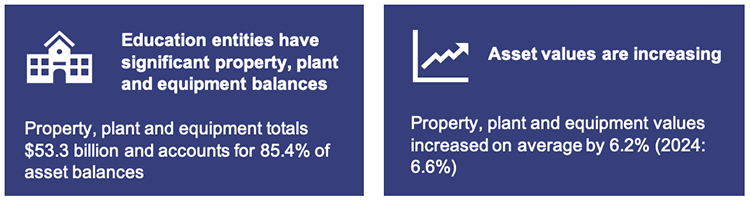
Property, plant and equipment continues to be the most significant item on the balance sheet for education entities, accounting for 85.4 per cent ($53.3 billion) of their total assets.
Each year, education entities must ensure that the asset values reported in their financial statements reflect their fair value. Fair value represents the value the asset would be worth today, based on the cost to replace it, or the income it is expected to generate.
Measuring the fair value of some asset categories (such as land, buildings, and infrastructure) for education entities can be complex. This is because there is no active market for buying and selling assets such as specialised buildings for universities and schools. It requires judgement and estimates, and various factors affect their value, including construction costs and labour supply.
Figure 4H shows the percentage increase in the value of property, plant and equipment for each education entity, resulting from valuations performed in 2025.
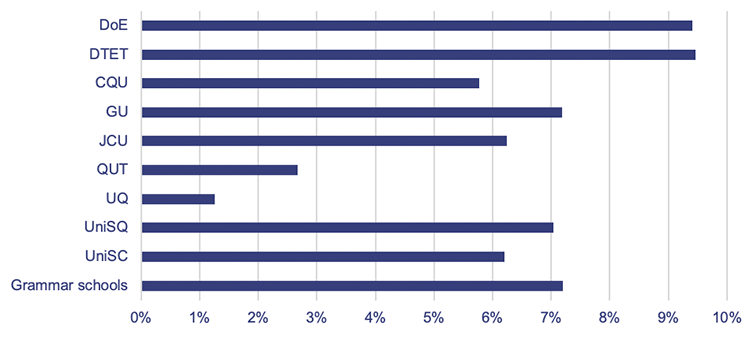
Notes: For the government departments, the movements shown are for 2024–25. For the universities and grammar schools, they are for the 2025 calendar year.
DoE – Department of Education; DTET – Department of Trade, Employment and Training; CQU – Central Queensland University; GU – Griffith University; JCU – James Cook University; QUT – Queensland University of Technology; UQ – The University of Queensland; UniSQ – University of Southern Queensland; UniSC – University of the Sunshine Coast; Grammar schools – combined movements for all 8 grammar schools.
Queensland Audit Office.
All education entities continue to see increases in the fair value of their buildings. Inflation and supply chain constraints have combined to drive up the costs of materials and labour. This means that it costs more to upgrade or replace buildings than it did in the past.
Queensland University of Technology and The University of Queensland recorded a lower overall valuation increase in 2025 compared to other education entities. While they did record an increase in their value of buildings, it was partially offset by:
- the fact that the value of land at Queensland University of Technology did not increase, based on recent comparable sales
- the value of the Warwick Solar Farm at The University of Queensland decreased by $53 million or 62.4 per cent, based on the latest cash flow assumptions adopted by management.
5. Asset management in education entities
When education entities manage their assets well, they support the delivery of high quality and efficient education services. This includes planning for future needs, considering factors such as demand for services, school-based population age, and growth.
The increasing costs to replace assets in the education sector, and their importance in the delivery of education services, means entities need to carefully plan for their maintenance, upgrade, and replacement programs. When entities do not complete maintenance at the right time, assets cannot maintain optimum performance, often leading to earlier asset replacements than originally planned. Delaying upgrades or replacements usually increases the annual maintenance costs needed to keep assets operating at a minimum service standard.
Entities need to consider future demand, technological advances, and how needs may change. Well-developed asset management plans, linked to entities’ overall strategies, can help with investment decisions. They can also ensure assets continue to be fit for purpose and can respond to changing needs over time.
Chapter snapshot
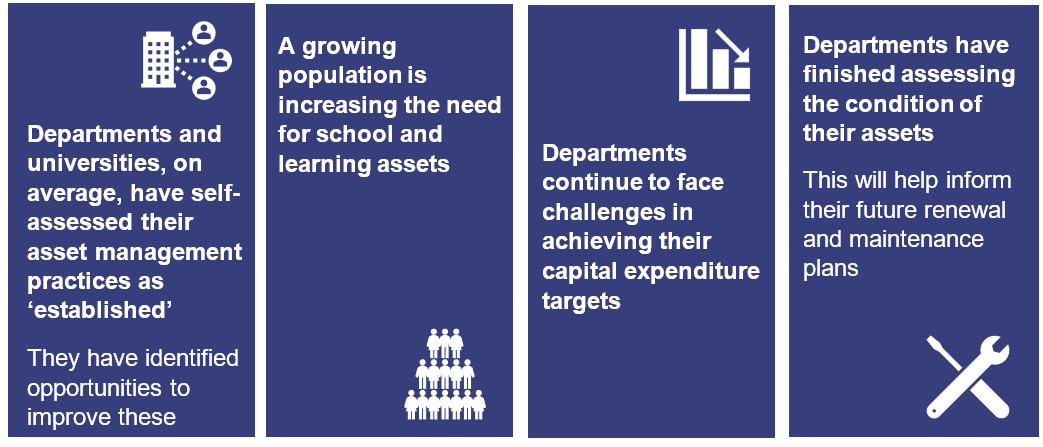
Entities have self-assessed their maturity in managing assets
We developed an asset management maturity model to help entities strengthen their asset management practices. The model is aligned with minimum requirements under the International Standards Organisation standard 55000 on asset management.
In 2025, all universities, the Department of Education, and the Department of Trade, Employment and Training, self-assessed their asset management maturity using our model. The model helps entities determine and understand the maturity of the processes they use to manage existing assets and plan for new assets.
As this was a self-assessment, we provide no assurance that the ratings reflect the actual maturity of their approaches. However, we have collated the results to show how the education entities view the gaps in their current level of maturity and where improvements can be made.
Because education entities have had stable business models, without significant restructures, they should at least have reached the ‘established’ maturity level in the model. In Figure 5A, we show the self-assessed average maturity levels for all 7 universities and both departments.
The 4 levels of maturity from the model are as follows:
| Optimised | an entity is a leader of best practice for asset management |
| Integrated | an entity’s asset management practices are fundamentally sound; however, some elements could be improved |
| Established | an entity shows basic competency in asset management |
| Developing | an entity does not have key components of asset management, or they are limited |
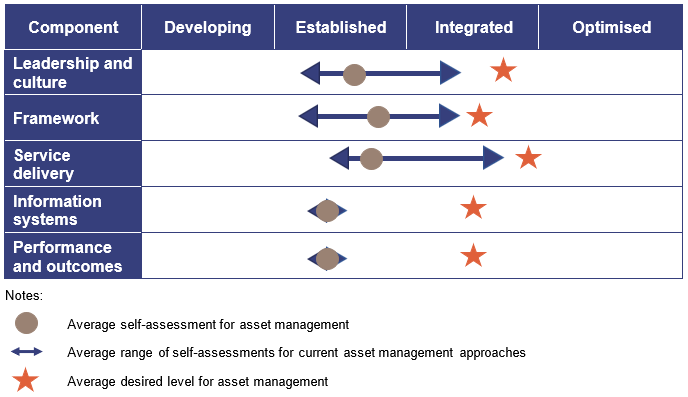
Compiled by Queensland Audit Office, from the self-assessments by education entities against the asset management maturity model.
The average outcome across the education entities was ‘established’, which means that they consider their asset management practices are at a minimum acceptable or adequate level, but there is room for improvement.
Each education entity’s desired level of maturity will be different. What might be required for a large entity in a metropolitan area may not necessarily work for smaller entities in regional areas. As shown in Figure 5A, all education entities are currently below their desired level of asset management maturity.
As part of the self-assessment process outlined in our asset management maturity model, each entity reflected on its strengths and opportunities for improving its asset management processes. We have summarised the key themes from their self-assessments in Figure 5B.
| Insights |
|---|
Common improvement opportunities identified by education entities include: Leadership and culture:
Framework:
Plan for service delivery:
Information systems:
Performance and outcomes:
|
Compiled by Queensland Audit Office, from the self-assessments by education entities against the asset management maturity model.
Investment in schools is generally aligned with population growth
State school enrolments are subject to fluctuations because of demographic factors in the communities they serve. As a result, changes in the school-aged population as well as local population movements affect forward planning for new schools.
While population growth for the state has been 18.7 per cent over the last 10 years, growth has been stronger in the greater Brisbane area, at 22.2 per cent. The Logan–Beaudesert, Brisbane Inner City, and Ipswich regions have experienced the greatest growth, with increases of more than 29 per cent in each region. To address this, the Department of Education has built 6 schools in Logan–Beaudesert, one in Brisbane Inner City, and 11 in Ipswich.
Across the state, the department is actively planning to deliver 19 new schools and 5 expansions – 6 schools and one expansion in 2027, and a further 13 schools and 4 expansions from 2028 onwards. Of the schools planned from 2028 onwards, 6 remain without an investment decision at the time of this report. The timing of these projects will be dependent on ongoing monitoring and analysis of residential growth and enrolment demand in these areas.
Figure 5C shows the department’s planned delivery of schools and expansions in high-growth areas from 2027. It does not show all planned infrastructure across the state. Overall, higher-growth areas are generally aligned with plans for new and expanded schools.
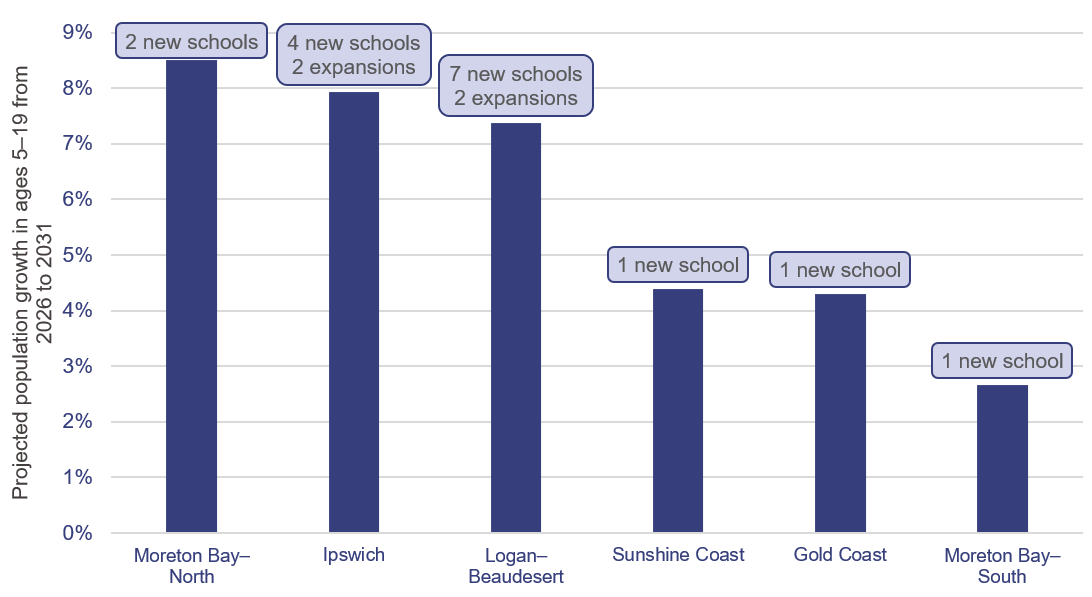
Compiled by Queensland Audit Office, using data from Queensland Government Statistician’s Office and the Department of Education’s website as at 26 May 2026.
Over the last 5 years the departments experienced challenges in spending their capital expenditure
The departments’ capital programs have costs allocated to specific projects and programs. These capital programs are designed to respond to growing student numbers and modernise infrastructure to address changing technology and educational needs.
Both departments have faced challenges in achieving their capital expenditure targets for at least 5 consecutive years. In 2024–25, the Department of Education underspent by 17 per cent and the Department of Trade, Employment and Training by 27 per cent, compared to their planned programs.
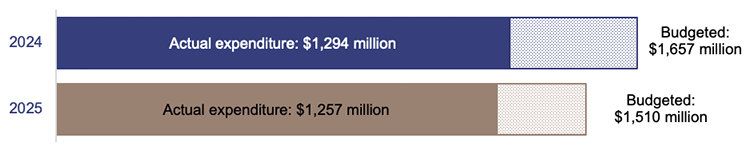
Figure 5D shows the budgeted capital expenditure compared to actual capital expenditure for both departments.
Department of Education
Department of Trade, Employment and Training
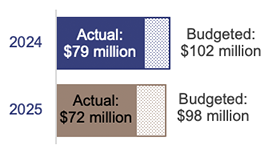
Compiled by Queensland Audit Office. Information adapted from agencies’ capital programs as reported to the Department of State Development, Infrastructure and Planning.
The Department of Education advised us that the primary reasons for not reaching its targeted spend in 2025 were:
- additional approvals for project commencement needed following the tender process. This was required as the total value approved for the project (based on the department’s estimates) was lower than the quotes provided by developers to deliver the project
- additional procurement processes undertaken to support achieving value for money, including further supplier negotiations and, in some cases, obtaining more quotes
- unexpected site conditions, including poor ground quality, asbestos materials, and wet weather, which required the department to undertake further work.
The Department of Trade, Employment and Training advised us that the primary reasons for not reaching its targeted spend in 2025 were:
- delays in defining the project scope, which subsequently impacted the timing of construction commencement
- contractor capacity constraints that affected delivery time frames.
Over the next 7 years, these pressures will increase, as many major projects are rolled out across Queensland. These include the Olympic and Paralympic Games; and transport, energy, health, and water initiatives. The departments risk facing higher construction costs than they initially budgeted for due to delays in project delivery.
The Department of Education plans to spend $1.3 billion in 2025–26, primarily in planning and constructing new schools. The Department of Trade, Employment and Training plans to spend $79 million on the construction and revitalisation of training infrastructure. If the departments cannot achieve this, there is a risk that assets will not be delivered, upgraded, or replaced when required.
Meeting education infrastructure challenges
While the expansion of education infrastructure is ongoing to meet the demands of the growing population, existing infrastructure is continuing to age, requiring regular maintenance, upgrade, and replacement as it reaches end of life.
Figure 5E shows the value of assets that the Department of Education estimates it needs to replace each year over the next 30 years. It highlights that in the next:
- 10 years, approximately 15 per cent of buildings (equal to $4.45 billion) will need to be replaced
- 20 years, more than 49 per cent of the current buildings – equivalent to $15.68 billion – will need to be replaced.
The replacement year is based on the remaining useful lives the department has recorded for its assets. ‘Useful life’ is the number of years an entity expects to use an asset – not the maximum period possible for the asset to exist.
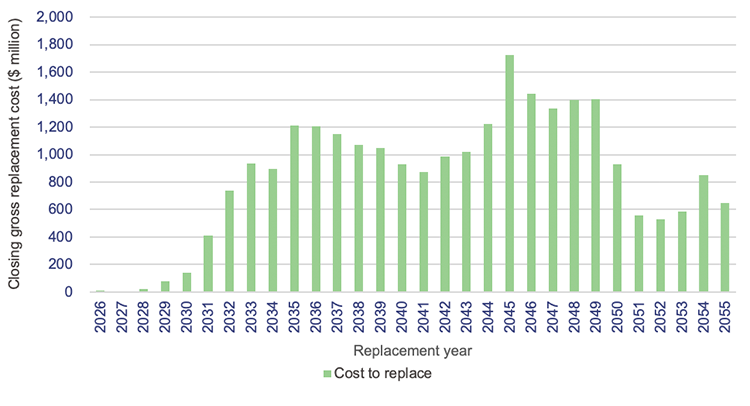
Note: Closing gross replacement cost is the estimated cost to construct a similar asset, without adjustments for the age and condition of the existing asset, as of 30 June each year.
Queensland Audit Office, from Department of Education asset register 2025.
Maintaining departmental assets
Education entities’ building assets must be maintained to at least a minimum level for them to continue to support delivery of services.
The Department of Education recorded $699.4 million on maintenance through its profit and loss statement in 2024–25, while the Department of Trade, Employment and Training recorded $59 million. Together, the departments increased their expenditure on repairs and maintenance in 2024–25 by $134.5 million (21.6 per cent).
The Queensland Government Building Policy Framework states that departments must develop and maintain a strategic maintenance plan. This plan should consider factors such as the age, functionality, maintenance requirements (both planned and unplanned), and condition of the buildings (condition assessments). Both departments have an approved strategic maintenance plan in place.
Performing regular condition assessments enables the departments to have a thorough understanding of the maintenance required on their assets – including the expected timing. This should help them to achieve better value for money by grouping similar services – for example, painting several classrooms at the same time – and prioritising the order of work.
Figure 5F shows that, over the last 5 years, both departments have adhered to the Queensland Government framework by meeting their annual minimum maintenance requirements, which is one per cent of the replacement cost of their building portfolios.
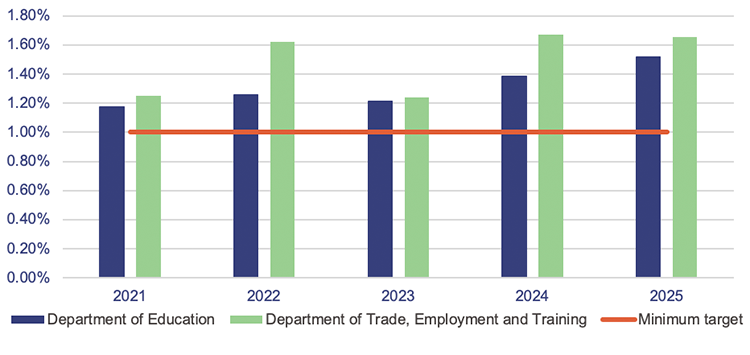
Compiled by the Queensland Audit Office.
Departments have assessed the condition of their assets
In Education 2024 (Report 15: 2024–25), we reported that the departments were progressing with their assessment of the condition of their assets, and with integrating this data in their future maintenance plans. We had previously recommended (in our 2021 report) that both departments complete regular and timely condition assessments.
In the following sections, we provide an update on the progress each department has made.
Department of Education
Last year, the department completed the integration of the condition assessment data into its finance system and was working with schools to use this data to develop each school’s multi-year maintenance plan.
The department has developed a maintenance application that interfaces with the finance system. Within this application, schools develop a 4-year maintenance plan, which is refreshed and approved on an annual basis. The application uses data from the condition assessments to add required maintenance to the plan. Additional maintenance needs outside of the condition assessments can also be added. All schools now have an approved maintenance plan in place.
The next condition assessment program is scheduled to start in 2027.
Department of Trade, Employment and Training
Last year, the department changed its approach to condition assessments and began inspecting its buildings and infrastructure assets (TAFE campuses) in line with its new program schedule.
It has now finished inspecting all 41 campuses. It has consolidated the data from the condition assessments into its new Digital Asset Management System. This system provides the department with a 4-year risk-based remediation plan and a 10-year condition-based capital renewal program.
The department is currently reviewing the quality of the data to ensure it is accurate and complete. It has also engaged QBuild to start delivering the priority work outlined in the plan.
The next condition assessment program is scheduled to start in 2028.
Analysis of university capital expenditure
Universities need to invest in property, plant and equipment. They must maintain modern infrastructure to support student experience, achieve research outcomes, and contribute to long-term financial sustainability.
Figure 5G shows the capital expenditure over the past 5 years for all universities.
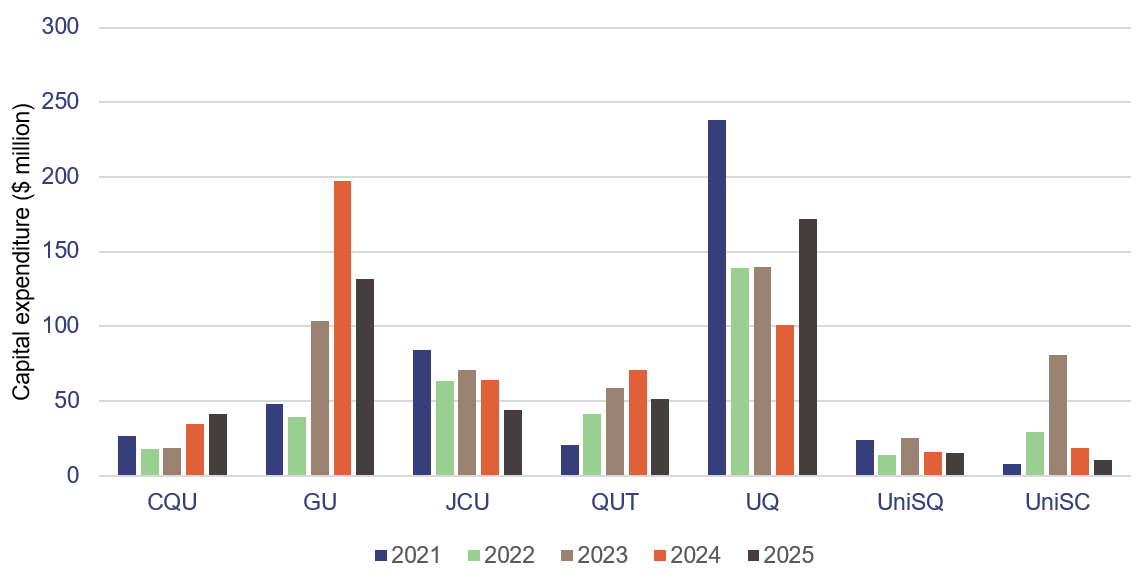
Note: CQU – Central Queensland University; GU – Griffith University; JCU – James Cook University; QUT – Queensland University of Technology; UQ – The University of Queensland; UniSQ – University of Southern Queensland; UniSC – University of the Sunshine Coast.
Compiled by the Queensland Audit Office.
University capital spending has historically been shaped by growth in student demand, strategic priorities, and the need to renew and expand campus infrastructure. Some of the key capital investments over the last 5 years are outlined below:
- In 2021, The University of Queensland capitalised costs of $238.2 million, primarily related to stage 1 of its Student Residences Project for student accommodation. In 2025, construction began on part of stage 2 of the project, for an additional 3 buildings to meet the growing demand for student housing.
- In 2023, University of the Sunshine Coast spent an additional $51 million – a 173 per cent increase in capital expenditure. This was primarily for stage 2 of the Moreton Bay campus extension. It included the opening of 3 new buildings for additional teaching facilities, research labs, student hubs, and industry space.
- In 2024, Griffith University spent an additional $93.7 million – a 90 per cent increase in capital expenditure. This was primarily for the 99-year lease for the Brisbane Treasury Building for $67.4 million. The university is currently refurbishing the building’s fit-out to open a new Brisbane CBD campus in 2027.
6. Enabling digital learning in state schools
In Education 2024 (Report 15: 2024–25), we reported on the progress made by the Department of Education in increasing internet speeds at schools.
In December 2021, the department signed a 5-year agreement with a supplier to upgrade internet speeds across state schools. It has significantly improved average internet speed per student since then. It began phase 2 of this project in 2024 to increase internet speeds to an average of 5,000 kilobits per second (kbps) for each student by 2026.
The Department of Education reports that it has since revised how it allocates bandwidth for state schools, using a needs-based approach instead of just a student enrolment-based approach. It now allocates bandwidth based on a combination of:
- school level classifications, which are determined by a combination of factors including the number of students the school has and the complexity of their operations
- minimum service levels, where a baseline level of connectivity is provided if supporting telecommunications infrastructure is available
- demand patterns, such as usage trends and peak usage.
This ensures schools have what they need to meet their actual usage requirements while maintaining a consistent experience across the state.
The department is continuing to roll out this bandwidth allocation model throughout 2026.