
Overview
The COVID-19 pandemic highlighted the crucial need for workforce proficiency in digital technology, which touches every aspect of our lives. To prepare students and embed digital literacy into daily learning practices, the Department of Education and schools need to provide digital technology and infrastructure efficiently and consistently across Queensland.
Tabled 20 July 2021.

Summary
The COVID-19 pandemic accelerated progress towards a digital society. Within a few months of its arrival in Australia, schools, universities, government services, businesses and families adapted to new ways of working and staying connected. We saw a significant increase in remote working, online businesses and online education. These trends highlight the imperative of a workforce that is proficient in using digital technologies—one that can create new ways of working, learning and interacting. Innovation in using digital technologies is important for Queensland to be nationally and internationally competitive and for our continued economic wellbeing.
Using video conferencing and online learning as part of daily practice in classrooms gives students opportunities to improve their proficiency in digital technology. To offer these opportunities, the Department of Education (the department) and schools need to provide digital technologies and the supporting infrastructure in an efficient and consistent manner across the entire state. They can then embed digital literacy into daily learning practices.
The purpose of this audit brief is to share key facts about how the department is reliably connecting learners and staff of state schools to digital resources and online content. It focuses on:
- student access to the internet and devices (such as computers, laptops, and tablets)
- technology infrastructure that connects schools to the department, to the internet, and to learning and student administration systems
- required planning and investment to improve internet speeds and digital technologies.
Figure A shows the main facts about the department’s technology intended to support digital learning.
|
Student access to high-speed internet and devices |
|
|
Technology infrastructure |
|
|
Planning and investment for digital learning |
|
Department of Education and Queensland Audit Office.
1. Recommendations
We recommend the Department of Education:
Student access to the internet and a device (computer, laptop, or tablet)
- reviews its targets for internet speeds and actively explores new types of services to increase internet speeds in schools in order to support equitable access to digital learning
- collaborates and shares information with the Queensland Government Chief Customer and Digital Officer to ensure the regions where schools need improved infrastructure for high-speed internet are considered in any relevant whole-of-government initiatives
- collaborates with schools and continues to provide guidance materials and support for students’ access to devices. It could review its funding model to ensure all students have access to a device
Technology infrastructure for digital learning
- reviews its current policies for maintaining its technology infrastructure to better support digital learning outcomes in schools. New policies could include
- replacing hardware on a regular basis or with services that keep the technology up to date
- implementing processes for regular updates to software and operating systems
- supports schools to manage their technology including
- setting clear guidelines on how schools use the funding they receive from the department for information technology
- monitoring that schools develop and fund plans for maintaining their technology
Planning for digital learning
- reviews its:
- digital strategy, including targets for upgrading its technology infrastructure and internet speeds in schools
- portfolio of projects, with an investment plan and project delivery dates that align with the revised strategy
- monitoring processes, to enable effective delivery of the revised strategy and related projects
- supports schools to have:
- a clear digital component in their strategic plans, which could include how they will embed digital literacy into daily learning practices and their preferred digital technologies in the contexts of their teaching and learning methods
- monitoring processes in place to enable effective delivery of their strategic plans, including the digital component.
Reference to comments
In accordance with s. 64 of the Auditor-General Act 2009, we provided a copy of this report to the Department of Education. In reaching our conclusions, we considered its views and represented them to the extent we deemed relevant and warranted. Any formal response from the entity is at Appendix A.
2. Introduction
Technology touches every aspect of our lives, including work, home, recreation, our environment and education. The Department of Education (the department) reports that 90 per cent of future jobs will involve digital literacy.
To prepare students for the workforce, schools introduce digital literacy from an early age, and learning is evolving to be online, self-directed, and on demand. Given the increasing use of wireless access, laptops, tablets, and mobile phones, learning no longer needs to occur within a school building or on a school day.
COVID-19 lockdowns have shown us that out-of-school access to the internet and digital learning has the potential to contribute significantly to the student learning experience. The department has identified a risk that insufficient investment in technology and workforce capability will mean that it will not be able to take full advantage of the increased use of technology that occurred during the lockdown.
Teachers also use digital technology to collaborate with colleagues and participate in professional development.
However, for this to work well, students and teachers need access to reliable, affordable internet services in the school and at home.
The objective of this audit brief is to share key facts about how the department is reliably connecting learners and staff of state schools to digital resources and online content. We have focused on three important factors that will contribute to enabling the department’s digital strategy:
- student access to internet and devices (such as computers, laptops, and tablets)
- the department’s technology infrastructure for connecting students and teachers to digital resources
- the department’s plans and investments for continually improving internet speeds and technology so digital literacy can be embedded in schools’ day-to-day learning practices.
Along with the benefits, digital technologies bring risks that range from cyber-bullying to online security and privacy. These security aspects are not in the scope of this audit brief, but we have planned an audit of the effectiveness of cyber safety in schools in our forward work plan for the year 2022‒23.
Australian Digital Inclusion Index for Queensland
The Australian Digital Inclusion Index (ADII) measures whether a person can access and afford online technologies and has the digital ability to connect to and use them effectively. According to the national research report: Measuring Australia’s digital divide: Australian Digital Inclusion Index 2020, Queensland is lagging in its digital inclusion index, coming fifth out of the eight states and territories.
Figure 2A is taken from the report. The sample sizes for some areas were small, which means caution needs to be exercised in drawing across-the-board conclusions from the results. That said, this figure shows the digital inclusion score of 62.2 for Queensland, which is less than the national average of 63. The digital inclusion index of some parts of Queensland is significantly less than the national average. For example, North West Queensland has the third lowest score (52.6) in Australia.
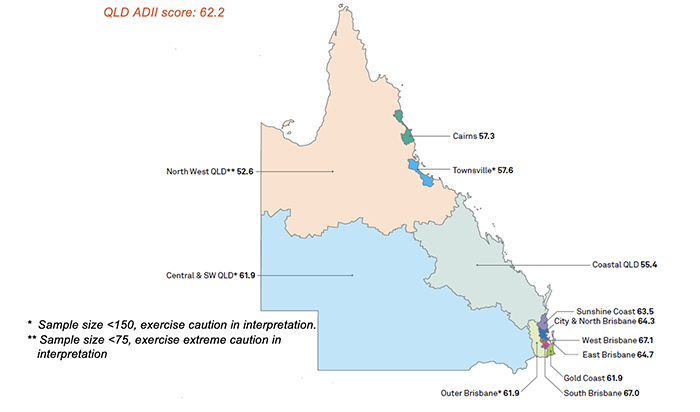
Note: QLD—Queensland.
Measuring Australia’s digital divide: Australian Digital Inclusion Index 2020.
The Queensland Government Chief Customer and Digital Officer is gathering information to assess the type and extent of investment that may be needed in the less digitally included regions of Queensland.
Queensland Government’s digital readiness
Intermedium, a consultancy company that has published a digital government readiness indicator report annually since 2016, ranks Queensland as eighth out of 10 Australian and New Zealand governments.
Figure 2B shows Intermedium’s rankings since 2016. The index has a maximum value of 10, and Intermedium assesses governments as being digitally ready when they gain a score of nine or higher. The Queensland Government’s ranking has fallen over time. While its index has increased since 2016, each year it has been below the benchmark for being digitally ready.
|
Rank |
July 2016 |
June 2017 |
January 2019 |
January 2020 |
January 2021 |
|---|---|---|---|---|---|
|
1 |
NSW 9.4 |
NSW 9.2 |
NSW 9.4 |
NSW 9.7 |
NSW 9.8 |
|
2 |
QLD 7.4 |
QLD 7.8 |
VIC 8.6 |
FED 9.2 |
FED 9.5 |
|
3 |
SA 7.4 |
FED 7.8 |
FED 8.6 |
NZ 9.2 |
NZ 9.4 |
|
4 |
VIC 7.3 |
VIC 7.7 |
QLD 8.5 |
VIC 8.6 |
ACT 8.9 |
|
5 |
FED 6.9 |
SA 7.5 |
SA 7.8 |
QLD 8.7 |
SA 8.6 |
|
6 |
WA 6.1 |
ACT 6.3 |
ACT 7.5 |
SA 8.5 |
VIC 8.5 |
|
7 |
ACT 5.1 |
WA 5.9 |
WA 6.8 |
NT 8.0 |
NT 8.2 |
|
8 |
TAS 4.8 |
TAS 4.8 |
NT 6.3 |
ACT 7.9 |
QLD 8.0 |
|
9 |
NT 4.1 |
NT 4.5 |
TAS 5.5 |
WA 7.4 |
TAS 7.1 |
|
10 |
- |
- |
- |
TAS 7.0 |
WA 6.8 |
Note: NSW—New South Wales; QLD—Queensland; SA—South Australia; VIC—Victoria; FED—Australian Government; WA—Western Australia; ACT—Australian Capital Territory; NT—Northern Territory; NZ—New Zealand.
Queensland Audit Office, using data from the 2021 Intermedium Digital Government Readiness Indicator Report.
Queensland Government’s digital strategy
The Queensland Government’s digital strategy was developed in 2017 and has never been updated. Some of the initiatives outlined within the strategy will continue to need investment to address the increasing demand on use of technology across the state.
This is consistent with the results of the Australian Digital Inclusion Index and the Intermedium readiness indicator report, which show that Queensland has not kept up the investment in technology compared with other states and territories.
Department of Education’s digital strategy
The department has developed a digital strategy, with a vision of connected and engaged learners through digital technologies—now and in the future. Figure 2C is a summary of the strategy. It includes providing the technology infrastructure to support digital technologies. The department can then embed digital technologies into learning practices in schools.
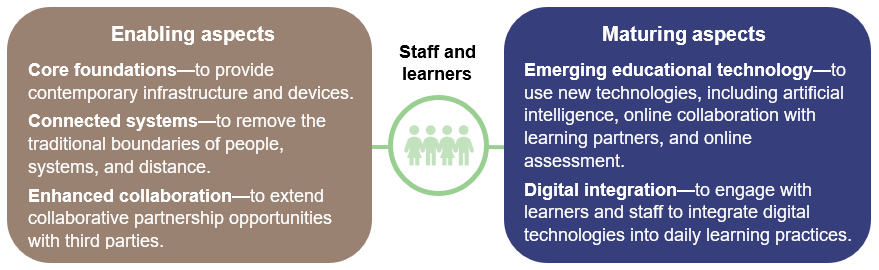
Queensland Audit Office, using information from the Department of Education.
The department developed and costed the implementation plan for this strategy. When the 2020 COVID-19 lockdown occurred, the department was in the process of seeking funding of $754 million over six years. This funding was not made available to the department due to the current economic conditions and the changes in technologies since the plan was developed.
3. Student access to the internet and a device
One of the keys to improving access to digital resources is ensuring that students can access affordable, high-speed internet and a device (such as a computer, laptop, or tablet) in school and at home. It is also a critical factor in determining which online content and applications students and teachers can use effectively.
Internet speed in schools
The target for the Department of Education (the department) for internet speed is 25 kilobits per second (kbps) per student. This is well below that of other states, as shown in Figure 3A. By comparison, the benchmark for New South Wales is 5,000 kbps per student.
|
|
|
The department started a two-phase procurement process in July 2020 to increase internet speed in schools. As part of the second phase, it invited offers from suppliers in April 2021.
|
State/territory |
Current internet connection |
Target internet speed |
|---|---|---|
|
Queensland |
83% fibre connection |
25 kbps per student |
|
New South Wales |
99.99% fibre connection |
5,000 kbps per student |
|
Western Australia |
97.5% fibre connection |
2,000 kbps per student |
Note: We have excluded Australian Capital Territory, Victoria, Northern Territory and South Australia as their targets for internet speed are on a per school basis, and are, therefore, not easy to compare with Queensland (which has targets for per student).
Department of Education and Queensland Audit Office.
Most states are bringing all their schools onto a fibre connection, which enables consistent speed when sending messages online.
Internet speed for a sample of online activities
In 2012, the American State Educational Technology Directors Association (SETDA) published a report on download internet speeds for a sample of activities in schools, shown in Figure 3B.
Almost ten years on, the department’s target speed of 25 kbps per student is well below the SETDA 2012 recommendations for basic online activities in schools. The lowest speed in Figure 3B is 250 kbps.
|
Activity |
Average download speed per user |
|---|---|
|
Online learning |
250 kbps |
|
Email and web browsing |
500 kbps |
|
Download a 1 megabyte digital book in 5.3 seconds |
1,500 kbps |
|
High-definition quality video streaming |
4,000 kbps |
|
Skype group video session (7–10 people) |
8,000 kbps |
The Broadband Imperative: Recommendations to Address K-12 Education Infrastructure Needs, a State Educational Technology Directors Association report.
Current internet speeds in schools across Queensland
While the department’s benchmark for internet speed is 25 kbps per student, schools can request and pay for additional internet speed. The department considers the request based on the capacity of its technology infrastructure.
|
98 per cent of students in Queensland state schools have access to internet speeds of less than 250 kbps. |
Figure 3C shows average internet speed per student (including additional speeds that schools have purchased) across the state.
As of March 2021, 98 per cent of students had internet speeds of less than 250 kbps. This is the lowest speed shown in Figure 3B for SETDA’s sample of activities involving digital learning.
|
Internet speed |
Number of school sites |
Percentage of school sites |
Number of Students |
Percentage of students |
|---|---|---|---|---|
|
19 to 24.9 kbps |
24 |
1.9% |
13,336 |
2.3% |
|
25–49.9 kbps |
392 |
31.2% |
186,681 |
32.7% |
|
50–99.9 kbps |
446 |
35.5% |
269,979 |
47.3% |
|
100–249.9 kbps |
198 |
15.8% |
91,664 |
16.0% |
|
250–999.9 kbps |
130 |
10.3% |
6,071 |
1.1% |
|
1,000 kbps or more |
67 |
5.3% |
3,709 |
0.6% |
Queensland Audit Office using data from the Department of Education.
During the 2020 COVID-19 lockdown, the department upgraded internet speeds for 118 schools. Of these schools, 67 (57 per cent) have not retained the higher speeds, even though the service is available.
|
School internet speeds ↑ 118 schools upgraded during 2020 COVID-19 lockdown ↓ 67 (57 per cent) of these schools have not retained the upgraded speeds |
The fact that schools (as mentioned earlier) need to pay for the additional internet speed may be one of the reasons several have not maintained the higher internet speed.
We have included data on internet speed per student by region in Appendix C.

|
Recommendation 1The department reviews its targets for internet speeds and actively explores new types of services to increase internet speeds in schools in order to support equitable access to digital learning. |
From 2015 to 2017, the department ran a project to upgrade the internet speeds in schools from an average of eight to 25 kbps per student. The department’s project closure report showed this included increasing the number of schools with fibre connections from 41 per cent to 80 per cent in 2017.
The work the department did at this time was not enough to keep up with the increasing demand on internet speed. Figure 3D shows the percentage of school sites that are currently not on fibre connections, by region.
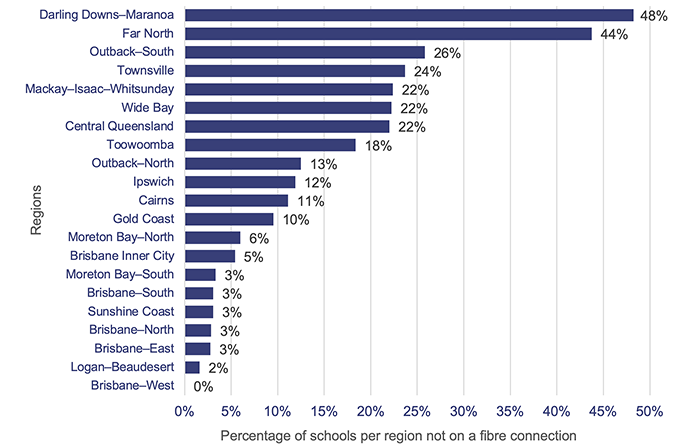
Queensland Audit Office using data from the Department of Education.
The department reports that currently, 227 out of the 1,347 state school sites are not on fibre connections. A total of 5,572 students (one per cent of all state school students) are enrolled in these schools, the majority of which are in more remote areas of the state. For example, 887 of these students (16 per cent) attend schools in the Far North region.
While the Darling Downs–Maranoa region has the highest percentage of school sites that are not on a fibre connection, its schools have a smaller number of students enrolled, with a total of 1,572 students across 55 school sites. Some have less than 10 students.
The total speed available through internet service providers is also different for some schools. As a result, their internet speed per student is variable, ranging from 32 to 12,500 kbps per student. When not on a fibre connection, they may experience a slowing down of the internet service during interactive sessions (such as video conferencing). A fibre connection is an important enabler for consistent speed when sending messages from one place to another online.
The department needs to work with the schools that are not on fibre connections to assess any impact on digital learning outcomes for students, and whether there is a need to improve infrastructure for high-speed internet.
|
A whole-of-government approach is needed to deliver improved infrastructure and internet speed. |
It may be very expensive to provide some school sites with a fibre connection. A whole-of-government approach is needed to increase access to affordable high-speed internet for schools.
|
|
Recommendation 2The department collaborates and shares information with the Queensland Government Chief Customer and Digital Officer to ensure the regions where schools need improved infrastructure for high-speed internet are considered in any relevant whole-of-government initiatives. |
Student access to high-speed internet and a device at home
The department conducts annual school opinion surveys to collect the views of parents or caregivers, students, and school staff on learning and student achievement. The surveys focus on what the department and schools are doing well and where they could improve.
Last year’s survey had the additional objective of reviewing the department’s response to COVID-19. It included detailed questions about access to the internet, devices, and other technologies.
In this report, we have used the data on how students have responded to the survey questions to report on:
- student access to high-speed internet at home
- student access to a device.
Last year’s survey was made available to students in Year 4 through to Year 12. The department’s survey report states that 119,295 students responded, but that rural and remote students were under-represented in the respondents. The department reports that as of February 2020, 386,467 students were enrolled in Year 4 through to Year 12.
Student access to high-speed internet at home
Access to high-speed internet at home is critical for online learning and for doing homework or remote learning online. Through the department’s survey, students and parents or caregivers reported that not all students have access to the internet at home. The percentage of students without internet access increases for low-income households.
|
Not all students have internet access at home. |
Figure 3E shows how students responded in the department’s survey on the question of whether they had access to data or the internet at home during the 2020 COVID-19 lockdown. We have presented the data according to the Australian Bureau of Statistics’ categorisation of socio-economic groups (which divides them into ‘quintiles’). Appendix C shows responses to this survey question by region.
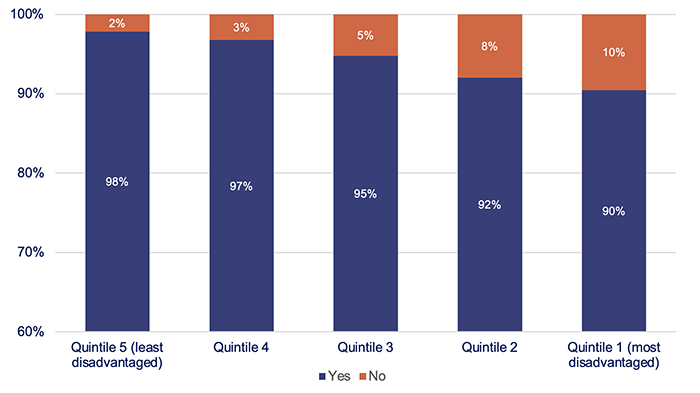
Queensland Audit Office using data from the Department of Education.
The department’s survey report shows that rural and remote students were under-represented in the respondents. While we have used this data to show the trend, the actual percentage could be different if all schools were represented in the survey.
Student access to a device
Most students (92 per cent) reported that they had access to a device during the 2020 COVID-19 lockdown period.
Schools achieve student access to a device in a variety of ways. These include a ‘bring your own device’ policy or where devices are part of a student resource scheme (a scheme run by schools that allows parents or caregivers to pay an annual amount to access learning resources). Both are influenced by a parent’s or caregiver’s ability to pay for the device(s).
During the 2020 COVID-19 lockdown, the department distributed around 5,200 devices to schools.
|
The percentage of students without a device increases in lower socio-economic groups. |
Figure 3F shows how the percentage of students who did not have access to a device changed depending on their socio-economic group.
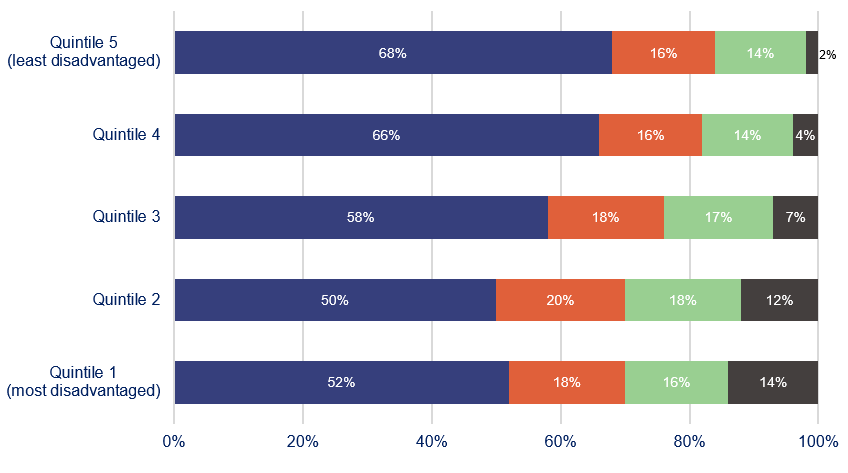
Queensland Audit Office using data from the Department of Education.
Fourteen per cent of students in the most disadvantaged socio-economic quintile reported that they did not have access to a device, compared to two per cent of students in the least disadvantaged socio-economic quintile.
Currently there is no funding allocated to schools specifically for providing students in low socio-economic groups with access to devices and the internet.
From the survey results, we noted that 28 per cent of students reported that they mainly received paper-based learning materials during the 2020 COVID-19 lockdown. The survey report stated this may be due to:
- reliability of access to information technology systems
- confidence of staff in the method of delivery
- inability to support all students equally without the students needing access to technology at home.
|
|
Recommendation 3The department collaborates with schools and continues to provide guidance materials and support for students’ access to devices. It could review its funding model to ensure all students have access to a device. |
4. Department of Education technology infrastructure
The infrastructure with which the Department of Education (the department) provides its technology plays a crucial part in digital learning in schools.
|
|
Technology infrastructure forms the foundation for digital learning. |
For digital technology to be part of normal practice in schools, the network hardware, the operating systems and the software all need to function reliably and well. Importantly, they also all need to be current versions—which means their suppliers still provide ongoing support for them.
To achieve this, the department needs to:
- plan to replace its network hardware and operating systems regularly, based on the dates on which the suppliers will end their support. Alternatively, it needs to use external suppliers that keep hardware on current versions
- update its software, at frequent intervals, keeping up with new features and updates in software security on a routine basis so they do not become outdated.
In this chapter, we provide facts on the department’s infrastructure for its information technology network and software that it provides for schools.
The information technology network
The department’s information technology (IT) network has around 1,347 sites and 634,000 users (students and staff) located throughout Queensland. The department and schools share responsibility for the network infrastructure, the main components of which are as follows:
- The core network is the central hub, through which regional offices and schools access the internet and business applications. The Queensland Government’s information technology service provider (CITEC) hosts and supports this infrastructure for the department at an agreed fee.
- The department’s core network connects to the networks for internet services (carriage network). The department has contracts with external service providers who operate and maintain the carriage networks. These also connect to local networks in schools.
- Schools are responsible for managing and supporting their own local networks. These are made up of information technology assets, for example, computers, equipment that assists in transmitting messages, cabling, and wireless access points (wi-fi). They connect the school’s computer equipment, including student and staff devices, telephones, and printers.
|
Department IT network has around:
|
Figure 4A provides a simple illustration of the organisation and responsibilities for these components of the information technology network.
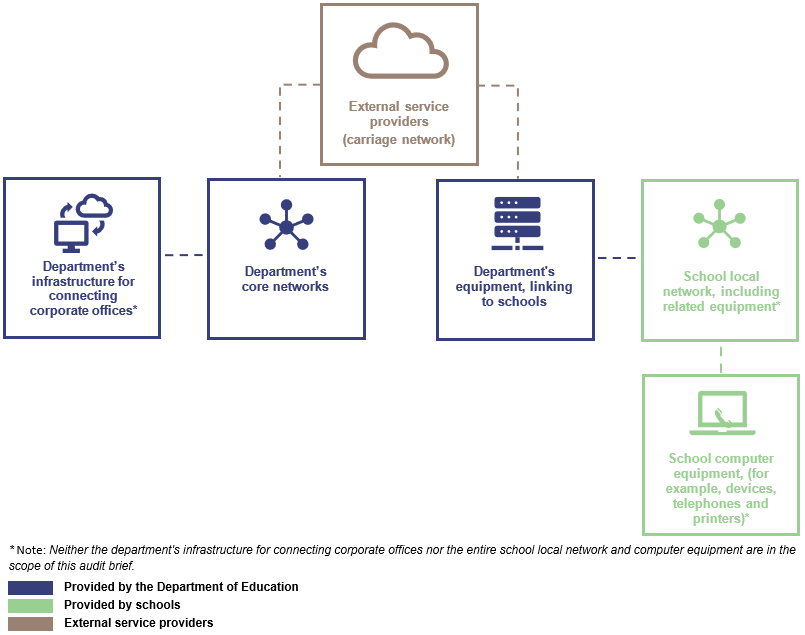
Department of Education and Queensland Audit Office.
Components of the network that the department manages
The department has assessed that in its current state, its core network can support a maximum speed of 2,000 kilobits per second (kbps) per student. However, the target for internet speed for schools is 25 kbps because it is dependent on the contracts with the internet service providers and the state of technology throughout the entire network to the ‘end point’ (that is, staff and student devices).
The core network has several limitations. The department is considering options for addressing its capacity and performance, to improve the experience for online learning.
During the 2020 COVID-19 lockdown, the department increased its technology infrastructure, including storage, hardware, software, and licences.
|
COVID-19—infrastructure increased, including:
|
Suppliers are currently providing regular updates for most of the department’s equipment that joins the core network to the carriage network.
At present, suppliers’ support has ended for only 0.4 per cent of the equipment. However, suppliers’ support for 56 per cent of the equipment will end in the next two years.
The department does not have a documented operational and investment plan for replacing this network equipment. It currently replaces equipment when it fails or when the department needs to change the technology.
While this may be an acceptable policy for the technologies the department is currently using, the trend for digital technologies is to keep all aspects of the technology up to date. When parts of the technology infrastructure are not up to date, they have the potential to increase security risks and may not provide the network capacity and performance needed for digital learning.
|
|
Recommendation 4The department reviews its current policies for maintaining its technology infrastructure to better support digital learning outcomes in schools. New policies could include:
|
Components of the network that third-party service providers manage
The department engages third-party service providers to deliver the internet to schools. Currently, it is assessing new technologies and considering how it can design third-party contracts to maximise internet speeds for schools.
During the 2020 COVID-19 lockdown, a third-party service provider donated around 4,300 SIM cards for the department to distribute to schools that needed them.
Components of the network that schools manage
The department’s reports show that around 10 per cent of equipment linking schools to the department’s network is no longer on current versions—which means that their suppliers no longer provide ongoing support. The reports also show that the quality and condition of equipment relating to school wi-fi, coverage, and service experience is variable.
There is no consistent model by which all schools plan for and maintain their technology infrastructure assets to ensure they are still supported by their suppliers. Some schools have developed plans (and budgets) to replace the equipment and saved these plans in the department’s information system.
Schools that do not maintain their hardware appropriately, and do not provide access to consistently good wireless service, can have unreliable services that may not allow students and staff to connect from anywhere at any time.
State schools receive funding for implementing and maintaining information technology. Over the last three years, they have received a total of around $198 million. (Data on information technology funding by region is in Appendix C.) However, the department does not require the schools to report on how this funding is used.
|
$198 million in IT funding to state schools over the last three years. |
|
|
Recommendation 5The department supports schools to manage their technology including:
|
Software the department provides for state schools
The department provides software for school and student administration, and tools for online collaboration and digital learning. The schools have a choice as to whether they use the software the department provides, except for OneSchool—which they must use.
Figure 4B shows the main department-provided software that state schools are currently using. At the time of our audit, apart from Microsoft Office 365, the software in Figure 4B was either no longer supported by their original suppliers or would have run out of support in the near future. To address this, the department has current projects to:
- enhance the student management system (OneSchool)
- replace the eLearning and content management systems (The Learning Place and Equella)
- update the operating systems (the managed operating environment)
- replace the online portal that presents information for parents (QParents).
|
Application |
Functions |
|---|---|
|
OneSchool |
This is a student management system. Its main functions include learning and resource management, finance, and performance reporting. |
|
The Learning Place |
This is an eLearning environment that provides access to digital resources and online spaces for teaching and learning, collaboration, and networking. |
|
Equella |
This is a learning content management system for eLearning. |
|
Microsoft Office 365 |
This is an office automation and collaboration platform for schools. |
|
Managed operating environment |
This provides access to the department’s network and corporate systems. |
|
QParents |
This is an online portal that presents information, including student timetables, attendance records, and report cards. |
Department of Education and Queensland Audit Office.
During the lockdown in 2020, the department rolled out Microsoft Teams software for online meetings and for connecting with staff and students. Schools also used functions in the online learning tool (The Learning Place) for video conferencing.
Schools use other online learning applications. They decide which applications they wish to make available to students and have a process for obtaining consent from parents or caregivers.
5. Department of Education plans for technology infrastructure
The Department of Education (the department) has undertaken significant work since 2018 to assess the current information technology (IT) environment. In 2019, it developed its digital strategy, and in February 2020, it developed detailed implementation plans to bridge the gap between its existing and planned technology environments.
Implementation plans for the digital strategy
The department produced comprehensive reports in 2019 on the then current state of the technology infrastructure for the network it uses to connect schools (the core network).
These reports show that the department lacked the technology capabilities needed to meet its levels of service at that time and to fulfil future digital learning needs. Based on these reports, the department developed plans, but did not start work on them, to increase its targets for internet speed per student as shown in Figure 5A.
| Year | Per student speed target |
|---|---|
| 2018 | 25 kbps |
| 2019 | 250 kbps |
| 2020 | 500 kbps |
| 2023 | 1,000 kbps |
| 2025 | 5,000 kbps |
Queensland Audit Office using the Department of Education’s documents.
Instead of starting work to increase its targets for internet speed, the department developed a plan to upgrade its core network and other related technologies to support digital learning. It was also going to negotiate higher internet speeds with its major internet service provider in June 2020, when its five-year contract ended. The department is currently in the market to enter into contracts for higher internet speeds for schools.
Estimated cost of the implementation plans
The department had estimated its February 2020 implementation plan would cost around $754 million and intended to deliver the plan over six years. Around this time, the COVID-19 pandemic started. Due to economic constraints, and changes in technologies since the plan was developed, the budget was not progressed and funding was not made available.
Currently, the department is continuing with existing projects relating to digital transformation in schools, with total estimated costs of around $23 million. These are shown in Figure 5B. These projects will not be enough for the department to achieve its vision of embedding digital literacy into daily learning practices.
|
Project |
Description |
Estimated costs |
|---|---|---|
|
Internet service contracts |
Procure new contracts for internet services to schools. |
Currently in procurement |
|
Digital learning project |
Replace the outdated learning management system. |
$8,116,662 |
|
Dynamic service broker (data exchange between applications) |
Develop integration capability to enable data exchange between the OneSchool and third-party applications for use in schools. |
$1,490,000 |
|
OneSchool (functional improvement) |
Improve functions of the student management system (OneSchool). |
$1,698,126 |
|
Managing user identities and access |
Progress the department’s strategies for managing computer users’ identities and access to departmental systems. |
$650,000 |
|
EQGlobal (international student management system) |
Replace the current international student management system. |
$4,968,000 |
|
School online reporting dashboard |
Develop an online reporting tool for corporate reports relating to school performance. |
$6,200,000 |
Queensland Audit Office using the Department of Education’s documents.
The department is progressing the projects in Figure 5B, but it has not developed:
- a revised digital strategy and expected digital learning outcomes in line with the changing technologies in the market and the current economic environment
- a revised portfolio of projects with new timelines for improving the technology (including internet speeds) to support digital learning in schools
- guidance materials and processes for supporting schools in developing and implementing their digital strategies aimed at embedding digital literacy into daily learning practices.
The department’s digital strategy needs to be revised to reflect what is achievable with the new technologies, and funding that can be made available, for educating for the digital future.
|
|
Recommendation 6The department reviews its:
|
|
|
Recommendation 7The department supports schools to have:
|
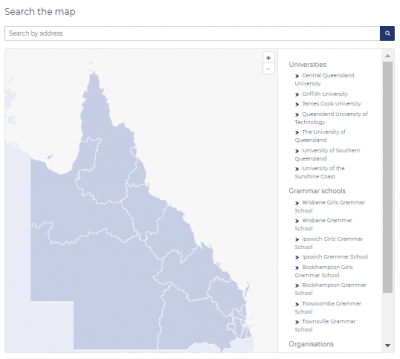
2020 education dashboard
Our interactive map of Queensland allows you to explore information on education entities and compare to other regions, including data on revenue, expenses, assets, liabilities, other measures like student and staff numbers, as well as internet speeds per student by region, school information technology (IT) funding, and student access to the internet and devices.