
Overview
In Queensland, state government owned corporations (GOC) generate, transmit, and distribute most of the state’s electricity needs. Tabled 21 November 2019.


Report on a page
Results of our audits
We found that the financial statements of all entities in the energy sector are reliable and comply with relevant laws and standards. All entities prepared their financial statements in a timely manner.
Internal controls are reliable
Overall, we found that energy entities’ controls over financial systems and processes are reliable. While we did not find any significant issues relating to controls, we made 12 recommendations to the entities for strengthening their controls, mostly relating to their information systems.
Sector finances are steady
Energy entities have solid financial positions and are investing in their assets to ensure they can deliver a stable and reliable supply of electricity. Within the national wholesale electricity market, Queensland continues to have the lowest wholesale electricity price, which influences the price consumers pay.
Profits were marginally lower this year, largely driven by the decisions of the Australian Energy Regulator to reduce the amount of revenue that energy transmission and distribution businesses can earn. The generators delivered increased profits this year, but almost half of these were from activities other than generating electricity, such as rebates from export sales of coal.
Future challenges
Queensland relies on coal for electricity, with the state-owned coal-fired generators producing more than 70 per cent of the state’s electricity. But the energy sector is changing. Based on market forecasts, renewable energy sources (such as solar and wind) will replace coal as Queensland’s main energy source by 2050. How the transition from coal to renewable energy will be managed is still uncertain, as there are no clear national policies to support an orderly change.
The Queensland Government aims to have 50 per cent of electricity coming from renewable energy sources by 2030. This year, to help achieve the target, it established CleanCo, a renewable and low-emission-focused generator. CS Energy and Stanwell will transfer their existing renewable and low-emission assets to CleanCo in 2019–20.
The existing generators will then be left with coal-fired power plants that are scheduled to be retired progressively over the next 30 years. This will affect the amount of electricity generated by these state-owned businesses. They are currently diversifying into other revenue-generating activities to prepare for the change.
Shifting to renewable energy sources will change our electricity system. Traditionally, electricity generators are large, centralised power stations. They are now becoming smaller and more widely dispersed. Also, unlike coal, renewable energy sources depend on natural forces like the weather, which makes managing supply more difficult. Our electricity system needs to adapt to these changes to maintain stable and reliable electricity supply for Queenslanders.
Actions for entities
From our sector analysis, we identified the following action points for each entity to consider.
Resolve accounting issues early
We encourage entities to continue working to resolve accounting issues prior to year end. Due to the nature of the industry, the accounting issues faced by energy entities are highly complex. This complexity is likely to increase as the industry continues to change and entities enter into more non-standard contracts and transactions.
Resolving accounting issues early will assist in the timely completion of year end close processes and the preparation of high-quality draft financial statements.
Secure information systems
The energy entities rely on information systems to operate large and critical infrastructure assets that produce and deliver electricity to consumers. With increasing reliance on technology and rising threats from cyber attacks, entities must continue to safeguard their data and information assets and systems. Security measures they should consider include:
- ensuring users have the appropriate level of access to databases and applications
- implementing strong password controls
- keeping databases, applications, and computer operating systems up to date
- ensuring key processes are not performed by the same person so checks and balances are in place.
This will aid in preventing fraud or error in financial systems and ensuring the security and reliability of electricity supply.
1. Overview of entities in this sector
In Queensland, state government owned corporations (GOC) generate, transmit, and distribute most of the state’s electricity needs. Electricity retailing outside of South East Queensland is also mostly state owned. The following diagram shows the state-owned entities’ roles in the Queensland energy sector supply chain.
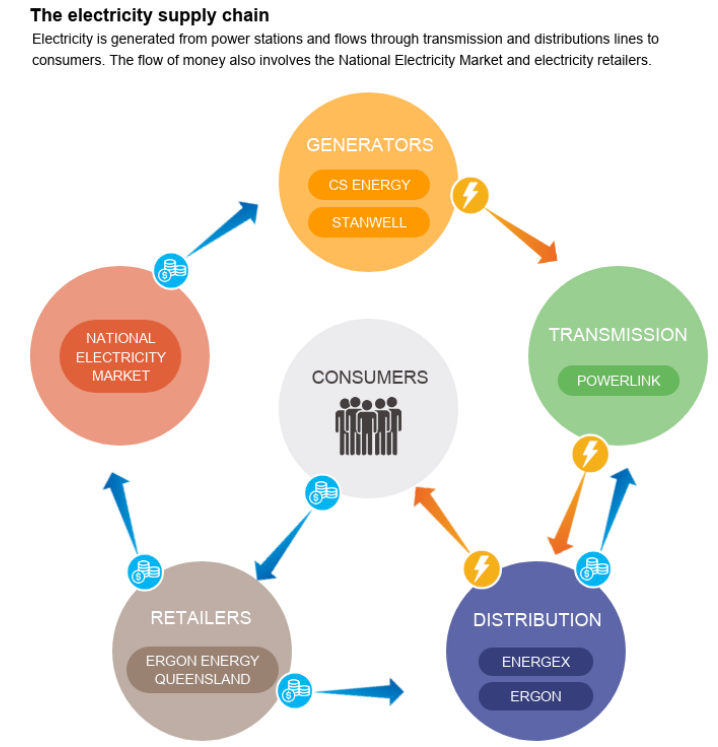
Note: The National Electricity Market is the cross-state wholesale electricity market where generators and retailers trade electricity. Stanwell and CS Energy also participate in the retail market. CleanCo is not included as a generator as it did not generate electricity in 2018–19. Energex, Ergon and Ergon Energy Queensland are subsidiaries of Energy Queensland Limited.
Compiled by Queensland Audit Office.
2. Results of our audits
This chapter provides an overview of our audit opinions for each entity in the energy sector and evaluates the timeliness and quality of their financial reporting. It also provides conclusions on our areas of audit focus.
Chapter snapshot
Chapter summary
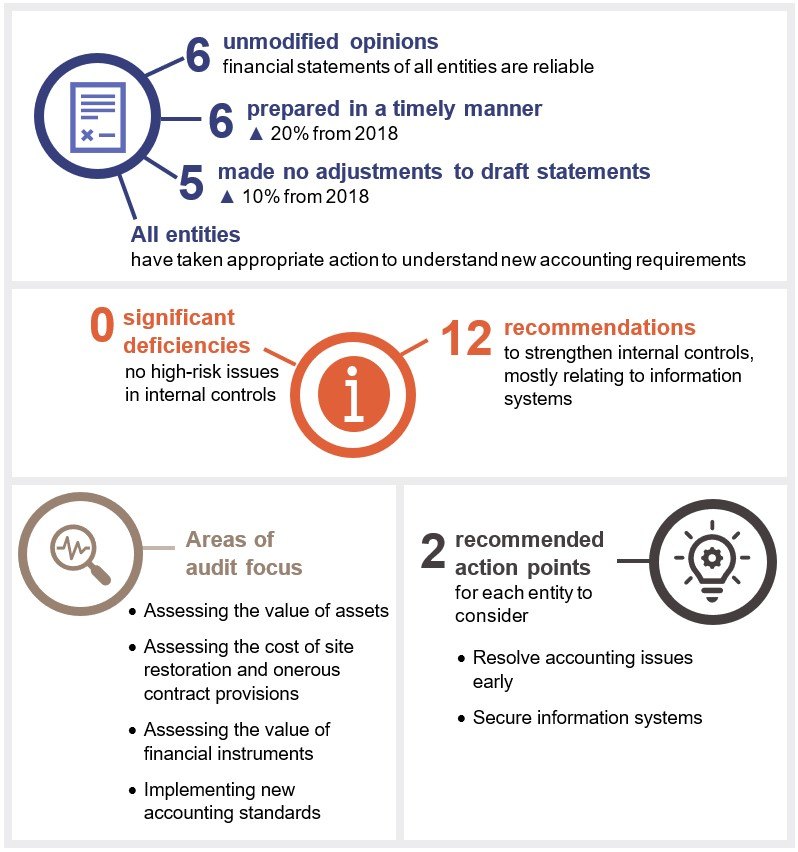
All entities in the energy sector received unmodified opinions in 2018–19, meaning their financial statements present a true and fair view of their financial position and performance.
We saw improvements in the timeliness and quality of financial statements for the sector.
Although we didn’t identify any significant (high-risk) control deficiencies in 2018–19, we noted an increase in control deficiencies throughout the sector. These mostly related to controls over information systems. Management undertook significant work to resolve outstanding issues from prior years and is working to resolve the identified deficiencies in the current year.
Energy entities apply significant judgement in determining the value of their assets and the contracts used to manage the risk of changes in electricity prices. They also use judgement in estimating their environmental obligations to restore their power station and mine sites and in the supply of electricity under unfavourable contract conditions. We focused on these areas in conducting our audit.
We concluded that readers can rely on the values of assets and liabilities reported in the energy entities’ financial statements.
Audit opinion results
We issued unmodified audit opinions for all energy sector financial statements. By doing so, we confirm that readers can rely on the audited financial statements of the energy entities.
We express an unmodified opinion when the financial statements are prepared in accordance with the relevant legislative requirements and Australian accounting standards.
Other audit certifications
We also provided assurance over the regulatory information notices (RIN) that Energex Limited (Energex) and Ergon Energy Corporation Limited (Ergon) provided to the Australian Energy Regulator. The regulator then determines the maximum revenue these entities can earn. To enable it to make these determinations, it issues notices (RIN) to collect information from the entities. The notices are subject to an audit or a review, depending on whether the information used is actual (historical) or estimated.
We issued Energex and Ergon with eight unmodified audit opinions on historical information and nine unmodified review conclusions about estimated data for the notices they submitted to the regulator.
Entities not preparing financial statements
As well as the government owned corporations, the sector includes 30 entities they control. Ergon Energy Queensland is the only one of these that prepares separate financial statements. The remainder either have an exemption from the Australian Securities and Investment Commission or are not required to prepare financial statements under the Corporations Act 2001 (as they are dormant or small companies).
Appendix E lists the entities that do not prepare financial statements.
Quality of financial statement preparation
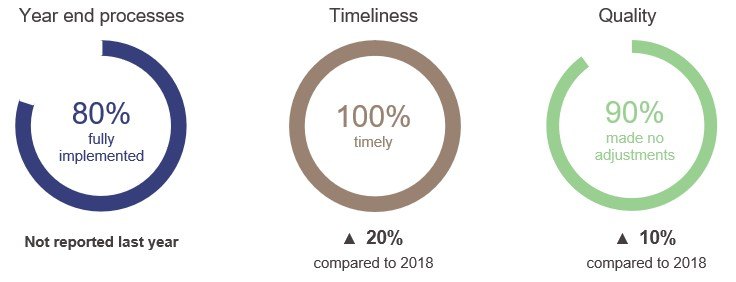
Overall, energy entities implemented year end close processes that allowed them to produce high-quality financial statements on time. This is a good result.
Compiled by Queensland Audit Office.
Energy entities are faced with complex accounting issues due to the nature of the industry and the non-standard contracts and transactions entities enter into. When accounting issues are not resolved early, there can be delays in preparing financial statements, and adjustments may need to be made to the financial statements.
We noted that the timeliness and quality of financial statements improved from last year due to the earlier resolution of accounting issues.
Action for energy entities
We encourage entities to continue working to resolve accounting issues prior to year end. Due to the nature of the industry, the accounting issues faced by energy entities are highly complex. This complexity is likely to increase as the industry continues to change and entities enter into more non‑standard contracts and transactions.
Resolving accounting issues early will assist in the timely completion of year end close processes and the preparation of high-quality draft financial statements.
Appendix D outlines our assessment criteria and the results.
Financial reporting maturity model
The Queensland Audit Office is developing a new reporting tool for assessing financial statement preparation—the financial reporting maturity model. This model will allow assessment of public sector entities’ processes for preparing financial reports, and it can be adapted for entities of different sizes and circumstances. We will include a self-assessment tool to help entities evaluate themselves against their expected maturity level and highlight areas for improvement.
Areas of audit focus
We focus on areas with a higher risk of fraud or error in the financial statements. Risk increases when there is a higher degree of complexity, or subjectivity (in terms of judgements, assumptions and estimates), or when there are significant changes or developments. In the energy sector, we focused on entities’ implementation of new accounting standards and on the following higher-risk areas:
- assessing the value of assets
- assessing the cost of site restoration and onerous contract provisions
- assessing the value of financial instruments.
The energy entities use complex financial models to determine these values and costs. The models include assumptions about the market and estimates of future cash flow. The entities convert the cash flow estimates into today’s dollars to calculate the value they record in their financial statements.
To ensure the values recorded in the financial statements can be relied on, we assessed the:
- design, integrity, and appropriateness of the valuation models used
- reasonableness of the key inputs and assumptions used in the valuation models
- competence, capability, and objectivity of the experts used.
Assessing the value of assets
The value of the transmission and distribution network remained stable
Powerlink and Energy Queensland (the network entities) calculate infrastructure asset values by estimating future cash flows generated by these assets, considering the Australian Energy Regulator determinations, and making assumptions about the market. Every year, each entity revisits the value of its assets.
In 2018–19, the value of network entities’ infrastructure assets increased by only one per cent ($413.7 million). There were no significant changes in the network entities’ cash flow assumptions or estimates.
Power stations continue to be profitable
The generators assess the value of their power stations annually. They record an impairment loss when a power station’s current value is greater than the amount the power station can recover through its sale or use. This loss decreases profit, as the entity records it as an expense in its income statement.
In 2018–19, the generators recorded no impairment loss for any of their power stations. The generators expect that wholesale electricity prices and demand will remain at levels that will ensure the power stations are sufficiently profitable until their scheduled closure date.
Stanwell is unlikely to develop its Kunioon coal resource
Stanwell uses coal from its Meandu mine to run the Tarong Power Station in the South Burnett region. It also owns the nearby, undeveloped Kunioon coal resource.
In the 2018–19 financial year, Stanwell assessed that there is enough coal in the Meandu mine to meet the future coal requirements of Tarong Power Station until its closure. Accordingly, it is unlikely that Stanwell will develop the Kunioon resource into a coal mine.
As Stanwell does not expect to realise the estimated value of this resource through future use or sale, it recorded an impairment loss of $105.3 million in its income statement.
Assessing the cost of site restoration and onerous contract provisions
Stanwell’s site restoration costs increased due to a change in the rate used to convert the cash flows into today’s dollars
The generators have a legal obligation to environmentally restore their power stations and mines to their former state.
In 2018–19, Stanwell’s site rehabilitation liability increased by $93.6 million (27 per cent). This was mainly due to a 1.85 per cent reduction in the rate used to convert the estimated future cash flows into today’s dollars. The reduction in rate is influenced by external factors such as the decline in interest rates of government bonds.
CS Energy’s onerous contract for the Gladstone Power Station
CS Energy has an agreement that entitles it to the trading rights of the Gladstone Power Station. Under the agreement, CS Energy is required to supply electricity to the Boyne Island aluminium smelter and can sell any excess electricity from the Gladstone Power Station to the national wholesale electricity market.
CS Energy’s costs in supplying the smelter with electricity are greater than the revenue it expects to earn from the contract. Therefore, CS Energy reports a liability, called an ‘onerous contract provision’, for this agreement.
In 2018–19, the increase in the onerous contract provision resulted in CS Energy’s profit decreasing by $25.1 million. Changes in CS Energy’s estimates for electricity prices and fuel costs were the main reasons for this increase.
Assessing the value of financial instruments
Generation and retail entities enter into contracts to manage the risk of fluctuating electricity prices. Typically, they lock in a fixed price for electricity that will be produced or consumed in the future. For accounting purposes, these contracts are derivative financial instruments.
The value of these contracts changes depending on electricity prices, among other factors. When the contract is favourable to the entity, it is reported as an asset. Otherwise, it is reported as a liability. The change in values affects profits unless the contract meets certain accounting requirements. When this happens, the change in value is recorded in the balance sheet until such time that the contract is settled.
At 30 June 2019, the energy entities reported $506.8 million in assets and $675.9 million in liabilities arising from these derivative contracts. In 2018–19, the sector profits increased by $106.4 million and equity decreased by $228.8 million due to changes in the values of these contracts.
Implementing new accounting standards
The energy entities applied two new accounting standards for revenue and financial instruments from 1 July 2018. The impact of these new standards did not have a major effect on their financial statements.
Internal controls
We assessed whether the systems and processes (internal controls) used by entities to prepare financial statements are reliable. We report any deficiencies in the design or operation of those internal controls to management for their action. The deficiencies are rated as either significant deficiencies (those of higher risk that require immediate action by management) or deficiencies (those of lower risk that can be corrected over time).
Internal controls of energy entities can be relied on
In 2018–19, we did not identify any significant deficiencies. To the extent of our testing, we found that the internal controls energy entities have in place (to ensure reliable financial reporting) are generally effective.
However, controls relating to information systems can still be improved. In 2018–19, we identified 12 deficiencies (lower-risk matters). Nine related to information technology system controls and limitations.
We reported all identified deficiencies to those charged with governance. Entities are working to resolve them.
Action for energy entities
The energy entities rely on information systems to operate large and critical infrastructure assets that produce and deliver electricity to consumers. With increasing reliance on technology and rising threats from cyber attacks, entities should continue to safeguard their data and systems. Security measures they should consider include:
- ensuring users have the appropriate level of access to databases and applications
- implementing strong password controls
- keeping databases, applications, and computer operating systems up to date
- ensuring key processes are not performed by the same person so checks and balances are in place.
This will aid in preventing fraud or error to financial information and ensuring the security and reliability of electricity supply.
Figure 2B shows the status of internal control deficiencies reported, as at 28 August 2019. Energy entities have worked to resolve the control issues outstanding from prior years.
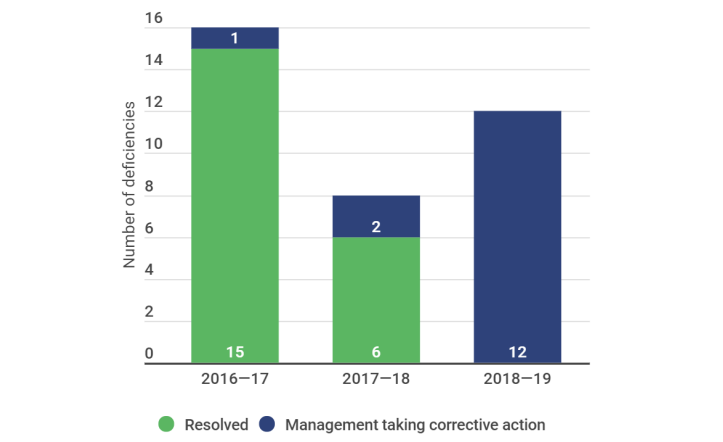
Compiled by Queensland Audit Office.
3. Financial performance of energy entities
This chapter analyses the financial performance, position, and sustainability of energy entities.
Chapter snapshot
Chapter summary
Energy entities continue to invest in assets to ensure they deliver a stable and reliable supply of electricity. In 2018–19, the sector invested $2 billion to maintain, update, or replace existing assets, including information systems.
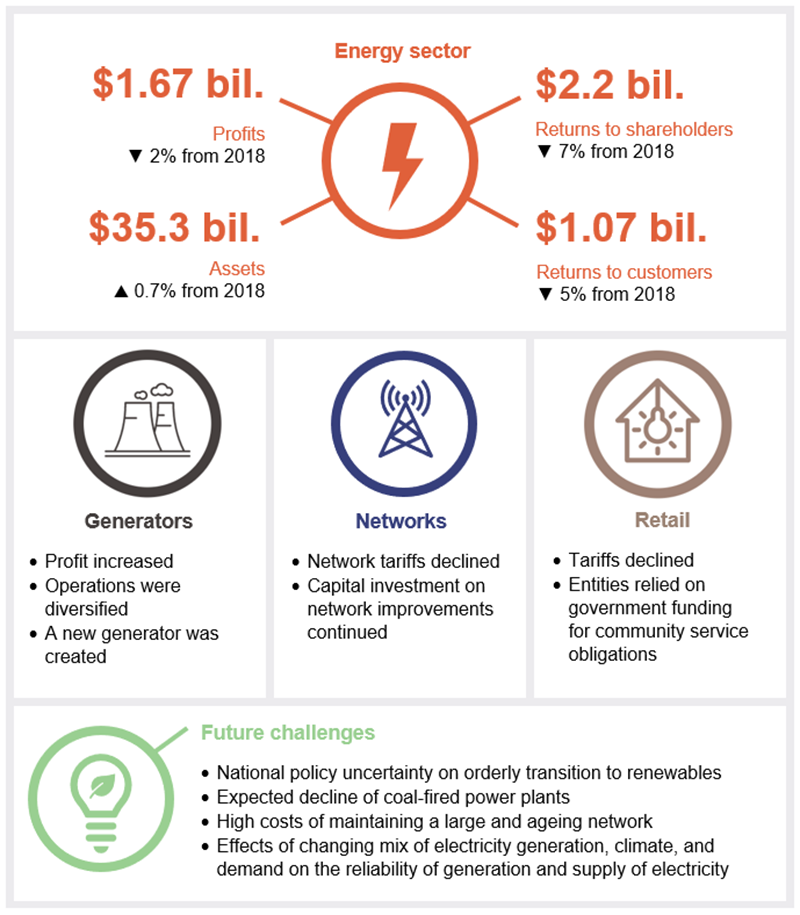
Despite wholesale electricity prices in Queensland continuing to be the lowest in Australia, all entities remain profitable. The sector posted a net profit of $1.7 billion, down two per cent on last year. This allowed the sector to return $2.2 billion to the state government, made up of $1.5 billion in dividends and $713.8 million in state taxes.
The state government gave back $1.07 billion to consumers in the form of rebates and subsidies. This included funding to support the additional cost of supplying electricity to regional Queensland.
Generators’ profitability continued to grow, due to increased wholesale electricity prices and diversification of their operations. They contributed $895.2 million in net profits in 2018–19.
In contrast, transmission and distribution profits are on the decline as a result of the decisions (determinations) by the Australian Energy Regulator to reduce the revenue these entities can earn. The current and proposed determinations will see further reductions in revenues.
The Queensland Government continues to pursue a target of 50 per cent of energy from renewable sources by 2030. In 2018–19, it created a third generator (CleanCo), which is focused on low-emission and renewable energy.
In the absence of clear national policies to assist with an orderly transition, shifting to renewable energy sources is posing several challenges.
Over the next 20 years, electricity generated from coal is likely to decrease. Coal power plants will reach the end of their useful lives and will likely be replaced by renewable energy sources. Unlike coal, renewable energy generation, such as solar and wind, is dependent on the weather. This makes it more challenging to ensure there is adequate supply of electricity at the time consumers want it.
Additional investment in networks is likely as more renewables connect to the electricity grid. Renewable energy sources are smaller and more scattered, compared to traditional coal-fired power plants. Upgrades to the network may be required to manage the changing mix of generation to deliver a reliable and secure electricity supply.
Profits for the sector decreased by two per cent
Profits for the energy sector decreased by $31.8 million (two per cent) this year. Figure 3A shows the trend in profits for the last three years by supply chain element.
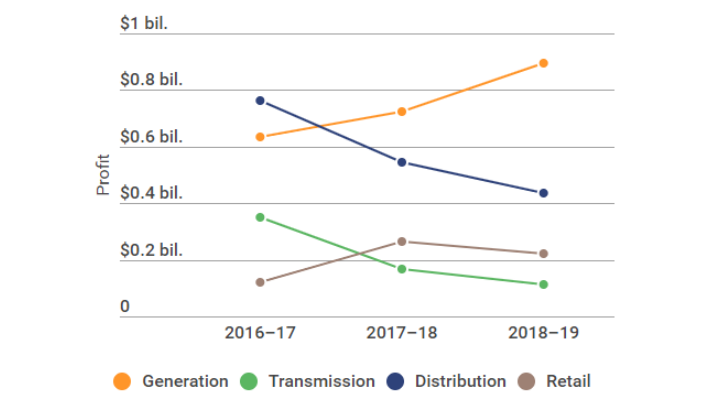
Compiled by Queensland Audit Office.
As shown in the graph, profits are trending down for the sector, except for generation. Generators’ profits grew by $173.4 million (24 per cent) driven by increased share in income from coal export sales and one-off gains from contracts.
Transmission and distribution profits declined by $53.3 million (32 per cent) and $109.3 million (20 per cent), respectively, due to the Australian Energy Regulator reducing the amount of revenue these entities can earn.
Retail profits declined by $42.7 million (16 per cent) due to the Queensland Competition Authority setting lower tariffs this year.
Queensland continues to have the lowest prices
Revenue from electricity generation increased by $253 million (10 per cent) from 2017–18. This was due to Queensland’s average wholesale price rising from $72.87 per megawatt-hour (MWh) to $80.29 per MWh (10 per cent).
Despite this increase in price, Queensland continued to have the lowest and most stable prices in the National Electricity Market (NEM) throughout the year. Figure 3B compares the average wholesale prices in Queensland to those in the rest of the NEM over a 24-hour period. It shows the average price for every 30-minute interval throughout the year is lower in Queensland than in the rest of the NEM.
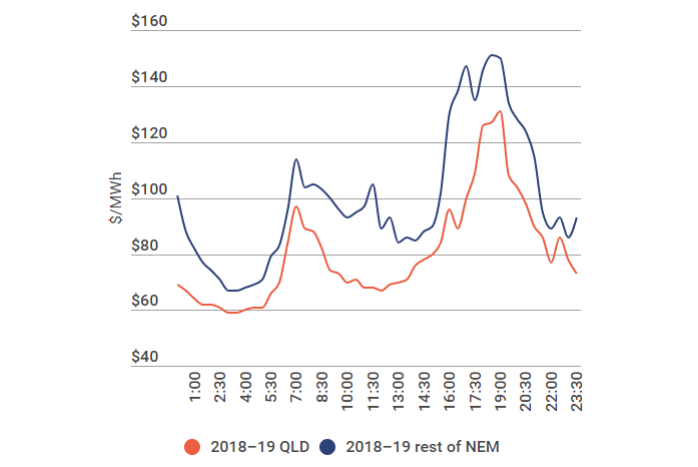
Compiled by Queensland Audit Office from Australian Energy Market Operator (AEMO) data.
In June 2017, the Queensland Government introduced its Powering Queensland Plan. Its objective was to ensure affordable, secure, and sustainable energy supply by requiring the generators to adopt strategies to place downward pressure on wholesale prices. Since
2016–17, Queensland prices have become less volatile, partly due to:
- the generators offering more electricity at lower prices over the past two summers
- the return of Stanwell’s gas-fired Swanbank E Power Station to service in January 2018.
In 2018–19, prices in Queensland were above $100 per MWh for only 19 per cent of the year (the average for the rest of the NEM was 37 per cent.)
Figure 3C shows Queensland’s average wholesale prices have become less volatile during the peak daily demand periods since 2016–17.
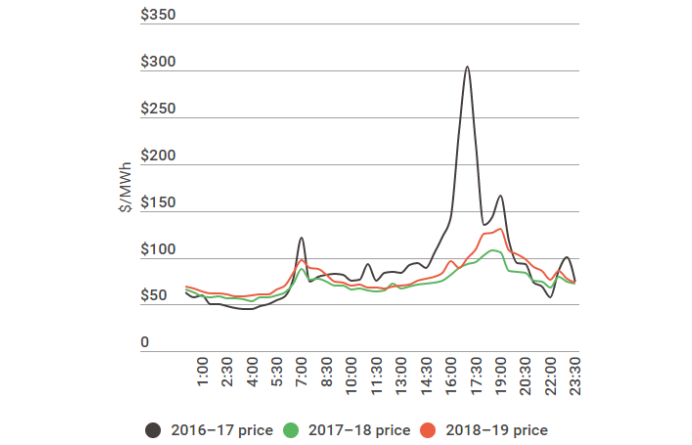
Compiled by Queensland Audit Office from Australian Energy Market Operator (AEMO) data.
On 13 February 2019, high temperatures across the state resulted in Queensland recording a new record demand of 10,044 megawatts1 (MW). Despite this, the price remained relatively low at $144 per MWh, because the generators offered enough supply at relatively low prices.
In 2018–19, Stanwell and CS Energy (including the Gladstone Power Station) generated approximately 64 per cent of Queensland’s total energy demand for the year (2017–18: 64 per cent).
1 Source: Australian Energy Market Operator's Quarterly Energy Dynamics – Q1 2019.
Generators continue to expand their non-generation revenue streams
Of the generators’ total revenue, 48 per cent was earnt from non-generation revenue streams (2017–18: 45 per cent) such as rebates from export sales of coal. Stanwell has a standing coal supply agreement which entitles them to a share in income from export sales of coal. During 2018–19, Stanwell earnt $260.7 million in coal rebates.
Another significant source of non-generation revenue was Stanwell’s negotiation of a new coal contract with Coronado Curragh Pty Ltd. The agreement is for supply of coal for its Stanwell Power Station from 2027 to 2038. Under the deal, Stanwell will receive $210 million (plus interest) in exchange for its rights to coal resources at the Curragh Mine in Central Queensland. Stanwell recognised this amount as income in its 2018–19 financial statements.
In 2018–19, the generators also increased their retail revenue by $342 million (29 per cent) to $1.51 billion. Figure 3D shows the growth in the generators’ retail revenue since 2014–15.
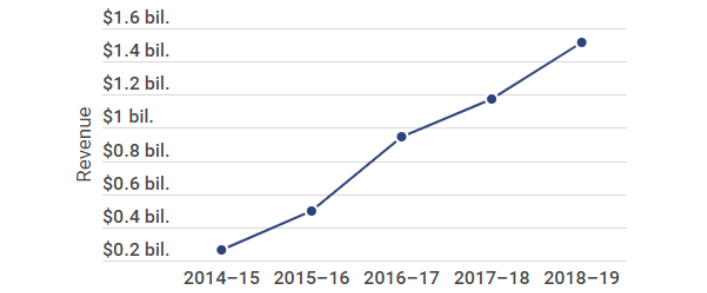
Compiled by Queensland Audit Office.
The main reasons for the increase in retail revenue during 2018–19 were:
- Stanwell negotiated several new long-term energy contracts with major businesses. In 2018–19, Stanwell contributed 86 per cent ($1.3 billion) of the generators’ total retail revenue.
- CS Energy entered into a new agreement with the Queensland Government to supply electricity to government entities from 1 January 2019. The agreement aims to provide long‑term price stability to government entities.
- CS Energy’s retail joint venture with Alinta Energy is now in its second year and continues to grow. The joint venture sells electricity to residential and small business customers in South East Queensland. In 2018–19, the joint venture’s total number of customers grew by 97,855.
Maximum allowed revenue of transmission and distribution entities decreased
Every five years, the Australian Energy Regulator issues a determination that caps the amount of regulated revenue distribution and transmission entities can earn. The current determinations for Powerlink and Energy Queensland’s distribution businesses capped revenue at lower levels than previous determinations.
The determinations issued to Energy Queensland will end in 2020 and it has submitted its proposal for the next regulatory period from 2020 to 2025. Based on the proposal, revenues from distribution are expected to decline further. The Australian Energy Regulator has yet to release its final decision on the new determination.
Figure 3E shows the trend in transmission and distribution revenue for Powerlink and Energy Queensland over the last five years.
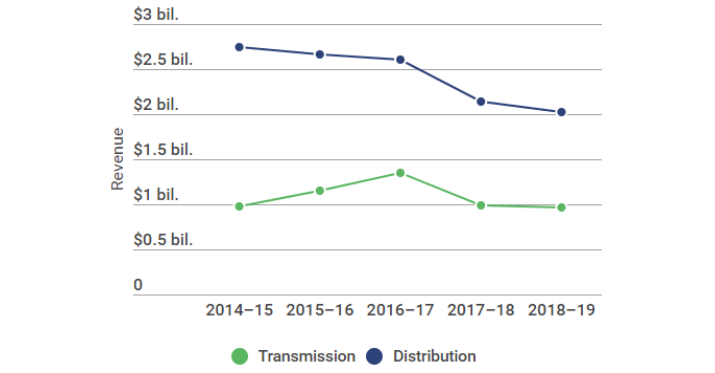
Compiled by Queensland Audit Office.
The reduction in regulated revenue contributed to the decreased profitability of the network service providers. In response, they are looking to expand their unregulated businesses. Unregulated revenue from contracts with customers increased by $25.9 million (seven per cent) during the year.
Government subsidies and returns to shareholders decreased
Returns to shareholders decreased
Returns to the state government are made up of dividends and state taxes. Total returns to the state government amounted to $2.2 billion—a decrease of $175 million (seven per cent) from the previous year.
Energy Queensland contributes the largest percentage (43 per cent) of returns for the sector. In 2018–19, it declared $657 million in dividends and recognised $282 million in tax payments to the state government. This is a 19 per cent decrease from the previous year.
Returns from transmission also decreased by $130 million (44 per cent). The current and proposed Australian Energy Regulator determinations for Energy Queensland and Powerlink are expected to reduce profits in the future. This is likely to affect returns to the state government as well.
Returns from CS Energy and Stanwell are the highest on record, but this trend is unlikely to continue. As more renewable energy projects enter the market to meet the state’s 50 per cent renewable energy target, Queensland’s coal plants will be progressively retired over the next 30 years (as they reach the end of their lives). This means that the generators may not be able to sustain their high level of income in the future, which will affect the returns to the state government.
Returns to consumers decreased
In 2018–19, the Queensland Government returned $1.07 billion to consumers, down $50 million from the previous year.
Figure 3F shows the returns to consumers for the last three years. Electricity rebates and concessions have been relatively consistent for the past three years. They provide financial assistance to pensioners, seniors, low-income households, and other eligible customers.
The large increase from 2016–17 was due to the funding of the Solar Bonus Scheme and Affordable Energy Plan in 2018. The Affordable Energy Plan includes initiatives such as a $50 dividend to households, rebates for energy-efficient appliances, and interest-free loans for solar and battery systems.
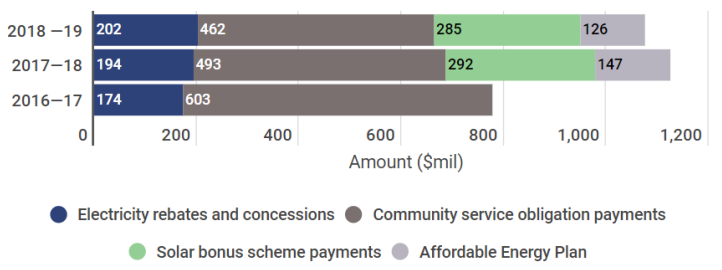
Compiled by Queensland Audit Office.
Government continues to support the cost of supplying energy to regional customers
The Queensland Competition Authority regulates energy prices for customers in regional Queensland. Currently, all retail household customers in Queensland pay the same price for energy, regardless of location. But the cost of supplying electricity to regional Queensland is high, as there is a relatively small number of customers spread across a large area.
This cost is subsidised by the Queensland Government through what is known as community service obligation payments. They are paid to Energy Queensland, which then transfers them to Ergon Energy Queensland.
In 2018–19, the community service obligation payments amounted to $462 million, a $31 million decrease from the previous year. This is due to a reduction in the average retail tariff rates. Without this funding, Ergon Energy Queensland would have recorded a loss of $241.5 million in 2018–19.
Solar Bonus Scheme funding
In 2008, the Queensland Government introduced a Solar Bonus Scheme as an incentive for Queenslanders to install rooftop solar systems. The scheme pays eligible participants an additional tariff for unused electricity they feed back into the network until 1 July 2028. The cost of the scheme was funded by network tariffs levied on electricity customers.
In 2017, the government removed this cost from network tariffs for the three years ending in 2020 by providing grant funding to Energy Queensland. The grant ensured payments would continue to be made to eligible customers, but the cost of the scheme would not be borne by electricity customers.
During 2018–19, Energy Queensland paid customers $285 million in solar feed-in tariffs, which included eligible customers under the Solar Bonus Scheme. The remaining grant funding is $287 million, which is the expected cost of the scheme over the next year.
Asset sustainability
Asset maintenance and capital projects
The energy sector requires significant investment to maintain, update, or replace its existing asset base. The total value of assets for the sector increased by $579.5 million (one per cent), mainly due to an increase in investment in these assets.
Capital expenditure increased
In 2018–19, the energy entities spent a combined $1.8 billion for capital expenditure on property, plant and equipment, a five per cent increase from the previous year. Energy Queensland contributed the largest expenditure, investing $1.1 billion towards capital investment in its network. This involved upgrading substations and transformers to improve network performance and reliability.
The generators regularly overhaul their power stations to ensure they are operating reliably and efficiently. In this financial year, the generators invested $137 million in overhauls, an increase of $19 million (16 per cent) from the previous year. This consisted of work performed on the Stanwell, Tarong and Callide power stations.
To ensure a reliable supply of electricity, Powerlink continually invests in their transmission assets. In 2018–19, Powerlink invested $178.5 million (73 per cent) of its total capital expenditure in refits or replacements of transmission lines and substations that have reached the end of their useful life.
Figure 3G compares the amounts spent on assets (capital additions) with the reduction in the assets’ values over time (depreciation). The graph shows that capital additions decreased over the last five years, mainly due to reductions in capital expenditure in distribution.
Depreciation remains lower than capital expenditure. This means the entities are investing more on new and replacement assets than they are consuming each year.
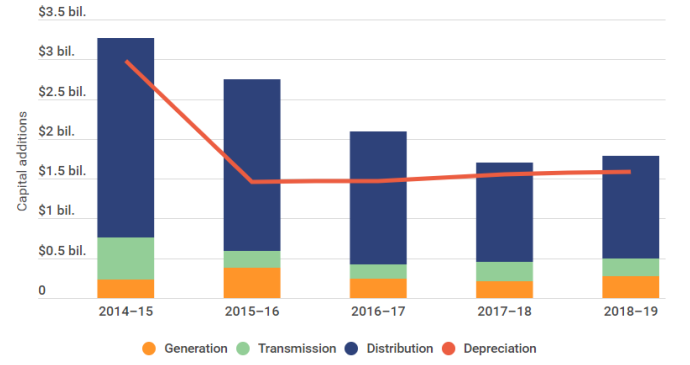
Compiled by Queensland Audit Office.
In addition to investing in infrastructure assets, the energy sector spent $196 million to upgrade and replace information systems. These systems are necessary for power plants and networks to function.
Energy Queensland will replace its information systems
A significant portion of this investment relates to the current replacement of Energy Queensland’s information system.
Energy Queensland is in the process of consolidating the systems used by Ergon and Energex by implementing a new enterprise resource planning and enterprise asset management (ERP EAM) system. This project aims to align the key business processes of the two entities and achieve cost efficiencies from the merger.
Implementation of the new system is ongoing and is expected to be finalised by 2021. The Australian Energy Regulator approved $228.9 million as funding for this project. At 30 June 2019, Energy Queensland had spent $92.9 million, and it expects to spend a further $161.1 million to complete the project. This may result in an overspend of $25.1 million over the amount approved by the Australian Energy Regulator. If Energy Queensland spends more than the approved funding, it may not be able to recover the excess through network charges that are passed on to customers.
Transition to renewable energy sources
The energy sector is faced with several challenges in the transition to renewable energy sources, including:
- flattening demand for electricity
- integrating advances in technology to the existing system
- maintaining reliable supply while managing the retirement of coal-fired power stations.
There is also uncertainty about a national energy policy that will support an orderly transition to renewable energy sources while ensuring security of the power system, reliability of electricity supply, and affordability for consumers.
A new renewable energy-focused generator was established
As part of the Powering Queensland Plan, the Queensland Government created a third government owned corporation—CleanCo Queensland Limited (CleanCo). It is a renewable energy-focused electricity generator that is expected to help decrease electricity prices and provide more reliable energy for Queenslanders.
On 31 October 2019, CS Energy and Stanwell will transfer their existing renewable and low‑emission energy generation assets to CleanCo to form part of its foundation portfolio of assets. The portfolio has a total capacity of 1,100 MW and includes Wivenhoe Power Station, Swanbank E Power Station, Kareeya Hydro, Barron Gorge Hydro, and Koombooloomba Hydro.
Stanwell will also transfer its interest in the Kogan North Joint Venture, which provides gas to Swanbank E.
The value of the assets and liabilities to be transferred to CleanCo is $136.1 million. CS Energy and Stanwell reported these as being ‘held for distribution’ in their financial statements at 30 June 2019. They will continue to provide operating and maintenance support after the date of transfer.
CleanCo will take over the Queensland Government’s Renewables 400 (R400) Program, an initiative under the Powering Queensland Plan. R400 is a reverse auction under which private entities submit bids for renewable energy projects for which the state will provide financial support. CleanCo will recommend the preferred renewable energy and storage projects in Queensland.
In addition to the R400 program, the state government had previously invested in renewable energy generation through the Solar 150 program. The program involves the state providing financial support to eligible private solar generators for 20 years. Stanwell fulfilled the contractual obligations of the state for the year ended 30 June 2019. They will continue to meet these obligations for the next 12 months. The Department of Natural Resources, Mines and Energy holds the $121.2 million liability for the remaining life of the agreement.
Demand for coal-fired power stations will decrease
Queensland has historically relied on coal for electricity. The Australian Energy Market Operator forecasts that electricity from coal will decrease over the next 20 years. This is due to several factors including the declining cost of renewables, retirement of coal power stations, and renewable energy targets.
Figure 3H highlights the expected changes in how electricity is generated in Queensland. This is based on the Australian Energy Market Operator’s (AEMO’s) 2018 Integrated System Plan—a whole-of-system roadmap for the efficient development of the national electricity market over the next 20 years.
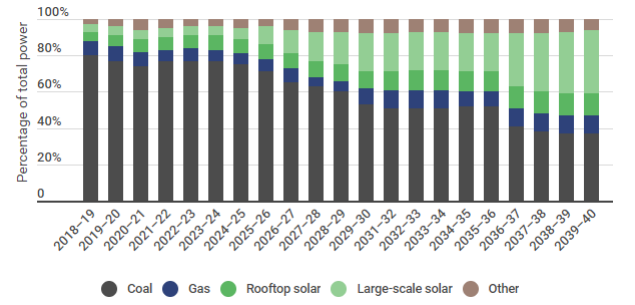
AEMO 2018 Integrated System Plan—Neutral scenario.
As shown in Figure 3H, 80 per cent of electricity came from coal in 2018–19, but this is expected to drop to 37 per cent by 2039–40. Electricity from solar is expected to grow to 46 per cent of the generation mix over the next 20 years. AEMO reports that there are more than 13 gigawatts of solar projects being proposed in Queensland by privately owned companies.
The other reason for the rise of other sources of electricity is the impending closure of the coal‑fired power stations as they reach the end of their technical lives. Figure 3I shows the timing of the closure and the generation capacity of the state-owned coal-fired power stations in Queensland. This is based on data submitted by the plant owners to AEMO.
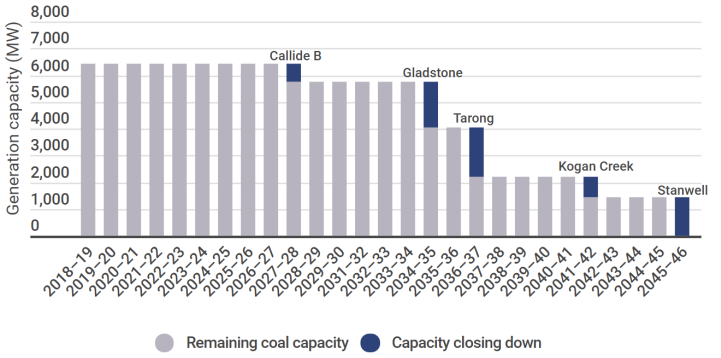
Note: The figure above does not include Callide C, as this information is yet to be submitted to AEMO.
AEMO generating unit expected closure Year 2 September 2019.
Retirement of state-owned coal-fired power plants is scheduled to start in 2027–28. By 2037–38, the government-owned generators are scheduled to retire over 60 per cent of their existing coal-fired generation capacity.
The forecast decline of coal and the growth in renewable energy is likely to impact on the government-owned generators’ ability to maintain high levels of profitability in future financial years.
Compiled by Queensland Audit Office from AEMO data.
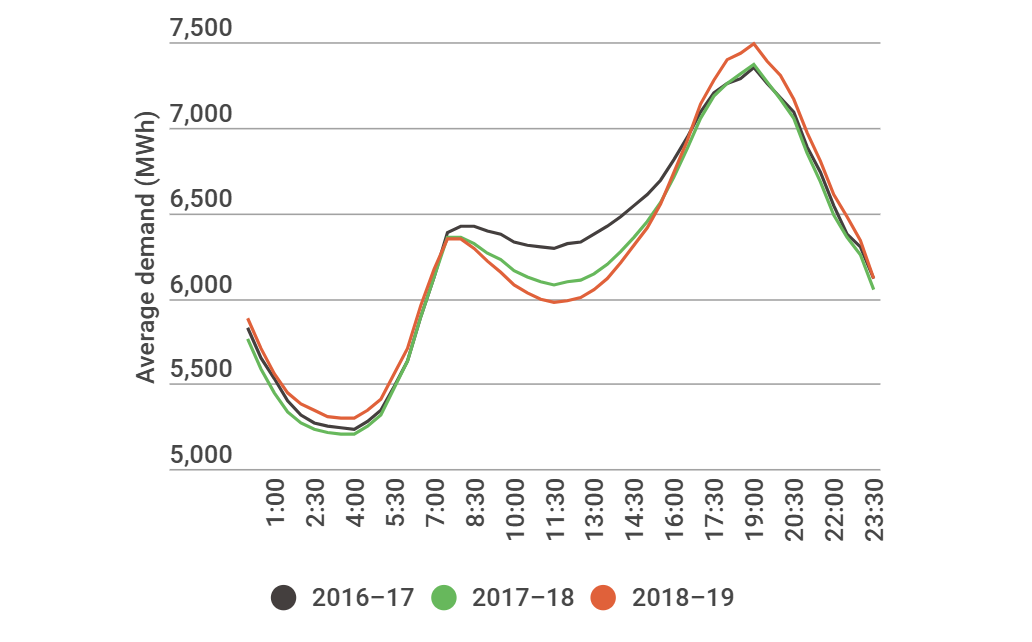
Electricity from solar energy is currently only a small percentage of the total generation in Queensland, but it is already impacting demand patterns.
Figure 3J shows the average demand in Queensland over a three-year period. As more solar generation is added from residential rooftop systems, demand for electricity during the day decreases. However, if demand is low during the time when solar energy is abundant, it may lead to overgeneration. Overgeneration is where more electricity is being generated than used.
On the other hand, demand at night has increased—when solar energy is not available. This means coal-fired generators have to quickly ramp up to meet the high demand at night. This rise and fall in supply and demand in the daily cycle also affects the performance of the network.
Electricity from solar is expected to grow over the next 20 years. This will likely change the supply and demand patterns even more.
Reliability and sustainability of electricity networks in Queensland
Queensland’s transmission and distribution networks are the largest in Australia. There are high costs associated with maintaining large networks, including the physical network infrastructure and the information systems that operate the networks.
As we shift towards renewable energy sources, electricity generators are becoming smaller and more geographically dispersed, meaning more network connections are needed.
In the current financial year, Powerlink and Energy Queensland (the network entities) connected 34 large-scale solar farms and one wind farm to the grid, with total generation capacity of 1,645 MW. (This is almost as much capacity as the Gladstone Power Station, the largest coal‑fired power station in Queensland, with a generation capacity of 1,680 MW.)
Consumers are also generating their own electricity through rooftop solar panels, and they usually feed excess electricity back to the network.
Network entities may need to invest more to integrate these distributed electricity sources into the grid to ensure a reliable and secure electricity system.
Changing climate patterns also affect the reliability of the networks. Rising temperatures across Queensland has caused new record demands for the past three years, and there is potential for further peak demand records.
Without adequate investment, the networks may not be able to withstand fluctuations in demand caused by extreme weather conditions.