
Overview
The entities in Queensland's health sector work together to provide a range of healthcare services to Queenslanders and support the wellbeing of Queensland communities. Tabled 26 November 2019.

Report on a page
This report assesses the audit results of the Department of Health (the department) and 16 hospital and health services (HHSs). We refer to these entities collectively as Queensland health entities.
This report also assesses the audit results for 12 hospital foundations and three other statutory entities.
Financial statements are reliable
The financial reports prepared by entities in the health sector are reliable and comply with relevant laws and accounting standards.
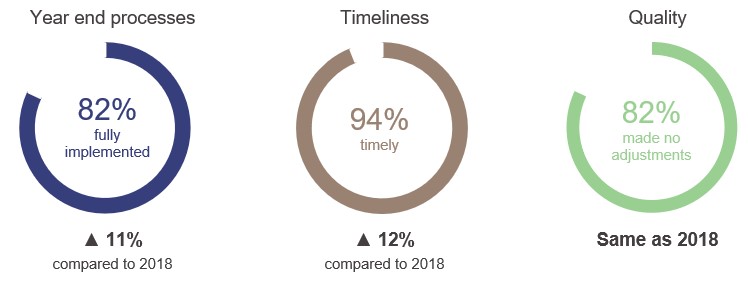
The HHSs continued to improve their year end processes and timeliness of preparation, and the quality of their draft financial statements remained high.
Internal controls are generally effective
Controls and processes were in place to enable Queensland health entities to prepare reliable financial statements.
We have made new recommendations to improve controls and processes within Queensland health entities. Common areas for improvement were compliance with procurement policies and procedures, and maintenance and management of the replacement of buildings and medical equipment.
Queensland health entities continue to address recommendations from previous years. Some will use the new finance system, which was implemented in August 2019, to refine manual controls and processes to address their control weaknesses. The implementation of the new system will be a focus area for our 2019–20 audits.
Financial results are declining
The financial sustainability of the Queensland health entities is declining. The sector is facing an ongoing challenge to maintain financial sustainability while ensuring patients are not waiting longer for care than clinically recommended. In 2018–19, eight HHSs reported operating deficits (one more than last year), despite only three having budgeted for an operating deficit. The operating deficits in five of these HHSs predominantly resulted from the board-approved investment of prior year surpluses into non-recurrent projects, such as the integrated electronic medical records (ieMR).
Increasing demand and costs for healthcare services are impacting on the long-term sustainability of the HHSs. At some HHSs, staff numbers are growing faster than activity, putting upwards pressure on their cost to deliver services.
The HHSs have $11.35 billion in property, plant and equipment assets, and there is a growing anticipated maintenance for these assets. This was estimated at $893 million as at 30 June 2019, and is likely to put additional pressure on the sector’s long-term sustainability
Recommended actions
Strengthen controls and processes
- Queensland health entities should strengthen their controls and processes by acting on outstanding audit recommendations. Where possible, the entities should use the functionality of the new finance system to effectively and efficiently act on these recommendations.
- Audit committees of the Queensland health entities should continue to regularly review the status of outstanding audit issues and ensure the risks are addressed in accordance with agreed timelines.
Improve asset management
- Queensland health entities should continue to ensure that they are allocating enough time and resources early in the financial year to complete the asset valuation and asset accounting processes before year end.
- Queensland health entities should continue to prioritise high-risk maintenance, and the hospital and health services should work with the department to find ways to mitigate the operational, clinical, and financial risks associated with anticipated maintenance.
1. Overview of the sector
Queensland Audit Office.
2. Results of our audits
This chapter provides an overview of our audit opinions for each entity in the health sector and evaluates the timeliness and quality of their financial reporting. It also provides conclusions on our areas of audit focus.
Chapter snapshot
Department of Health and hospital and health services
Chapter summary
The Department of Health (the department) and all hospital and health services (HHSs)—referred to collectively as health entities—received unmodified audit opinions in 2018–19, meaning their financial statements are reliable.
The Queensland health entities’ building assets are highly specialised and significant judgement needs to be applied to determine their fair value. In addition, recording healthcare activity is complex, and requires a team separate from the clinical staff to record the activity.
We focused on these two areas, and concluded that readers can rely on the values of the hospital buildings and the completeness and accuracy of activity-based funding revenue.
We encourage all health entities to do their valuations earlier in the financial year and ensure enough resources are allocated to reviewing the valuers’ work.
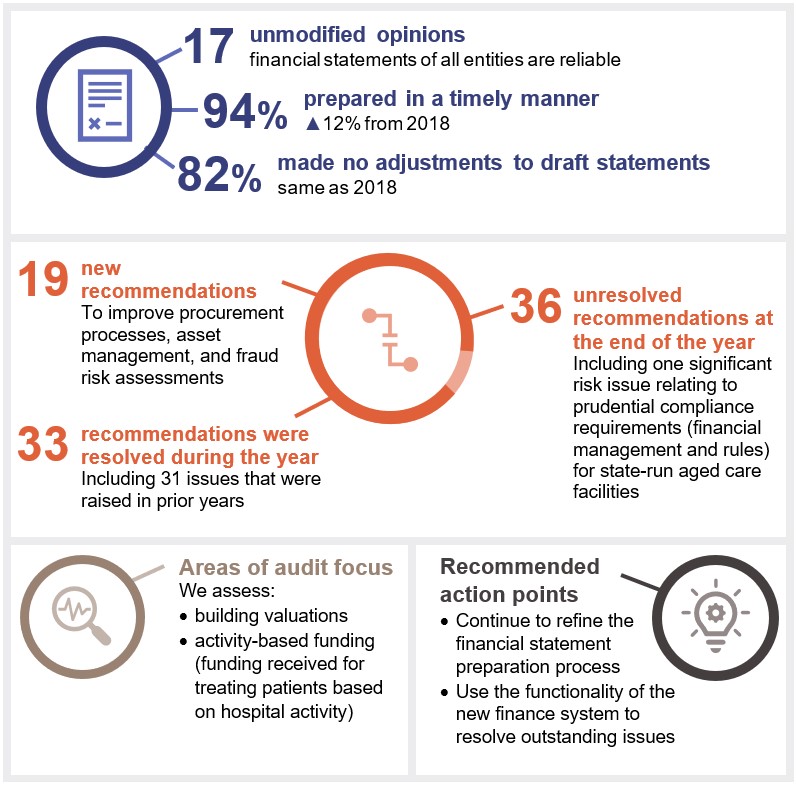
Across the department and the HHSs, we made 19 new recommendations. These primarily related to improving procurement processes, asset management, and fraud risk assessments. A total of 36 recommendations had not been resolved as at 31 August 2019 (including 19 raised in previous years).
For the other entities in the health sector, we issued unmodified audit opinions, except for two hospital foundations.
Audit opinion results
We issued unmodified audit opinions for all Queensland health entities. In doing so, we confirm that readers can rely upon the audited financial statements. All Queensland health entities met their legislative deadlines.
We also audited 12 hospital foundation statutory bodies and three other statutory bodies. All 15 entities, except for Gold Coast Hospital Foundation and Townsville Hospital Foundation, received an unmodified opinion.
Gold Coast Hospital Foundation and Townsville Hospital Foundation’s audit opinions were qualified on the basis that we were not able to obtain enough appropriate audit evidence over the completeness of cash sales and donations. We are working with these foundations to improve their control environments.
We express a qualified opinion when the financial statements as a whole comply with relevant accounting standards and legislative requirements, with the exceptions noted in the opinion.
Gold Coast Hospital Foundation, Townsville Hospital Foundation, and Mackay Hospital Foundation did not meet the legislative deadline for their audits to be completed.
Appendix D provides detail about the audit opinions we issued.
Other audit certifications
In 2018–19, we issued opinions for other audits and assurance engagements performed in the Queensland public health sector.
Appendix E lists these audits and the opinions issued for them.
Entities not preparing financial statements
Not all Queensland public sector health entities produce financial statements.
Appendix G lists the entities not preparing financial statements and the reasons.
Q-Pharm Pty Ltd was a controlled entity of QIMR during 2018–19. All shares in this entity were sold to a private company on 25 January 2019. This report does not include results of Q-Pharm Pty Ltd.
Effectiveness of financial statement preparation
Overall, Queensland health entities implemented year end processes that allowed them to produce high-quality financial statements on time. Year end close processes and the timeliness of draft financial statements improved significantly from last year, while the quality of draft financial statements was consistent with last year.
The results of our assessment for each entity and our assessment criteria are outlined in Appendix F.
Queensland Audit Office.
Action for hospital and health service entities
The HHSs brought forward their asset valuation and asset accounting processes this year to assist in the transition to S/4HANA, their new financial management information system. In most cases, this greatly assisted the year end processes.
We recommend the HHSs continue to ensure that they are allocating enough time and resources early in the financial year to complete the asset valuation and asset accounting processes before year end.
Financial statement preparation maturity model
We have developed a new reporting tool for assessing financial statement preparation—the financial statement preparation maturity model. This model allows for an assessment of public sector entities’ processes for preparing financial reports and can be adapted for entities of different sizes and circumstances. We have provided a self-assessment tool to help entities evaluate themselves against their expected maturity level and highlight improvement areas.
Areas of audit focus
We focus on areas with a higher risk of fraud or error in the financial statements. Risk increases when there is a higher degree of complexity or subjectivity in calculating values and amounts, or when there are significant changes or developments. In the health sector, our audit focused on:
- valuation of hospital buildings, because they are specialised and there is not an active market to buy or sell them (which makes it difficult to place a value on them)
- completeness and accuracy of activity-based funding revenue (funding received for treating patients based on hospital activity), due to the complexity in measuring and recording health activity.
Valuation of hospital buildings
The department and the HHSs reported $9.7 billion in buildings at 30 June 2019, which is consistent with the prior year. As a result of the valuations conducted in 2019, buildings increased in value by $367 million. This was offset by the annual depreciation expense (decrease in the value of the assets over time).
Queensland health entities use valuers to estimate the value of the buildings and provide professional judgement about certain subjective assumptions. During our audit, we confirmed the value of the hospital buildings by assessing the:
- competence, capabilities, and objectivity of the experts used
- appropriateness of the valuation methodology used
- assumptions used in the process
- depth and quality of management’s review of third-party valuers’ work
- changes to how assets are used, are expected to be used, and their remaining useful lives.
Completeness and accuracy of activity-based funding
The department funds most of the HHSs based on the number and complexity of clinical services provided to patients. To measure this, the department uses Queensland weighted activity units (QWAU). Funding the HHSs based on the number of QWAUs delivered is referred to as activity-based funding.
Some hospital activity is funded by a set dollar amount, regardless of how much activity is undertaken. This is referred to as block funding.
To calculate how much activity-based funding each HHS receives, the number of activity-based funded QWAUs is multiplied by the funded amount for each QWAU for that HHS.
The activity-based funding for the HHSs continues to increase each year, in line with the rise in patient services. The number of activity-based funded QWAUs has increased by 4.9 per cent from last year. Growing community demand for health services across Queensland will continue to increase the need for funding from the state and federal governments.
Determining the correct QWAU amount based on what clinical service was provided to each patient is complex. There are risks associated with recognising and measuring each HHS’s activity-based funding. These include:
- the possibility of errors in manual data entry
- the complexity when converting data from patient charts to clinical activity, including administration staff confirming with clinical staff what treatment the patient received.
Our response to these risks included:
- reviewing the qualifications and experience of staff coding patient charts into the system
- reviewing the results of management assurance processes over the integrity of activity data
- analysis of activity trends at the procedure, specialty, and hospital level.
Impact of new accounting standards
In the 2018–19 financial period, the new Australian Accounting Standards Board (AASB) standard 9 Financial Instruments became effective. It did not have a significant impact on Queensland health entities.
Accounting standards to be introduced in the 2019–20 period are:
- AASB1058 Income of Not-for-Profit Entities
- AASB15 Revenue from Contracts with Customers
- AASB16 Leases.
The majority of Queensland health entities have analysed the impact of the new standards, and they are not expecting them to have a significant impact on their financial statements.
Internal controls
We assess whether the systems and processes (internal controls) used by entities to prepare financial statements are reliable. We report any deficiencies in the design, implementation, and operation of those internal controls to management for their action. We rate each as either a significant deficiency (higher risk, requiring immediate action by management) or a deficiency (lower risk, that can be corrected over time).
Overall, to the extent that we have tested them, we found the internal financial controls in Queensland health entities are generally effective and can, therefore, be relied upon.
Internal control weaknesses
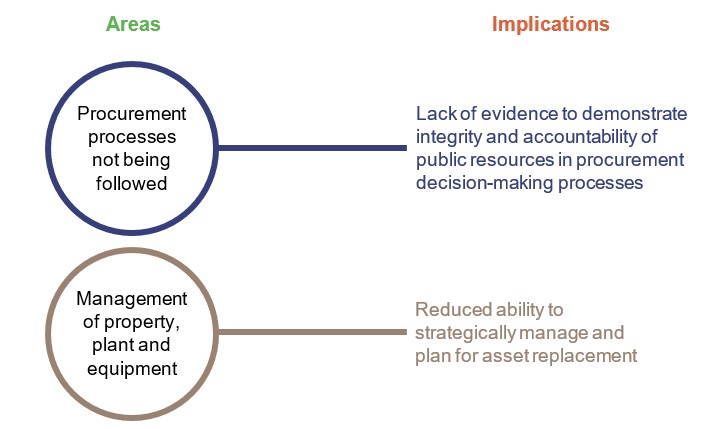
Across the department and HHSs, we reported 19 new control deficiencies in 2018–19. No new significant deficiencies were identified during the year. Figure 2B identifies where control deficiencies are occurring and the implications for the entities.
Queensland Audit Office.
We found that the entities can improve the transparency and accountability of their procurement decision-making by ensuring compliance with approved policies and processes.
Buildings and medical equipment assets must be appropriately maintained and replaced when they reach the end of their useful lives. This takes effective management. We discuss anticipated maintenance in Chapter 3 of this report.
Acting on outstanding recommendations
Fifty issues (45 deficiencies and five significant deficiencies) from prior years had not been acted on at the start of the current audit year across Queensland health entities. They related predominately to:
- ensuring HHSs follow procurement policies and procedures
- recommending HHSs improve their risk management and fraud risk assessments.
Several entities have assessed that the implementation of the new S/4HANA finance system (implemented in August 2019) will assist them in redesigning and reviewing their controls and processes. The new finance system’s controls will be a focus area for us in 2019–20.
Of the five significant deficiencies that had not been acted on at the start of 2018–19, three have now been resolved and one has been downgraded to a deficiency due to work undertaken during the year.
The one outstanding significant deficiency at 30 June 2019 related to the prudential compliance requirements (financial management and rules) for state-run aged care facilities. The severity of the deficiency varies at the four HHSs who run facilities. The department and the HHSs were not able to resolve the significant deficiencies for the 2018–19 audit. They are working together to improve the control environment and documentation issues.
A total of 36 control deficiencies had not been resolved as at 31 August 2019, with 19 raised in previous years.
Queensland Audit Office.
Action for Queensland health entities
The audit committees of the Queensland health entities should continue to regularly review the status of outstanding issues and ensure the risks are addressed.
Departmental controls report
Annually, we are engaged by the department to report on the controls it has in place over its accounts payable, payroll, and general information technology (IT) controls for processing the transactions of the HHSs. This report is used by the boards and management of the HHSs to provide them with independent assurance that the controls operated by the department on their behalf are designed appropriately and operating effectively.
We concluded that the HHSs could rely on the control environment in place at the department.
S/4HANA financial management system transformation
On 1 August 2019, the department implemented a new finance system, S/4HANA. The go-live was delayed to improve the integration with other systems, improve the quality of data, and improve the training and change management program. The cost increased by approximately $34.5 million
In 2018–19, the implementation resulted in Queensland health entities bringing forward work on asset stocktakes, asset valuations, and reviews of work in progress. We performed extra testing to ensure revenues and expenses were recorded in the correct accounting period.
The new finance system has resulted in changes to the IT general control environment, key processes, and internal controls for the accounts payable, inventory management, and asset accounting at all Queensland health entities.
We undertook a limited review of the pre-production environment prior to go-live. This work was to plan for the controls report that we do for the department. The aim was to provide advice on the general control environment. It did not focus on program governance, including change management. Prior to go-live, we informed the department about issues we identified with role mapping and process mapping. These issues were not resolved prior to go-live.
The implementation of any new major system increases the risk of fraud or error, as automated and manual controls and workflows are established and refined, and staff learn how to use the new system. The implementation of S/4HANA is no different. The department is responding to staff and vendor feedback on the new workflow processes to ensure operational and internal control effectiveness, so that necessary inventories are on hand, vendors are paid correctly and on time, and all users are appropriately trained.
The implementation of the control environment and transition of information to the new system is an area of audit focus for 2019–20.
Action for Queensland health entities
The Queensland health entities should strengthen their controls and processes by acting on outstanding audit recommendations. Where possible, the entities should use the functionality of the new finance system to effectively and efficiently act on these recommendations.
3. Financial results of health sector entities
This chapter analyses the financial performance, position, and sustainability of the Department of Health (the department) and the 16 hospital and health services (HHSs)—collectively referred to as the Queensland health entities.
Chapter snapshot
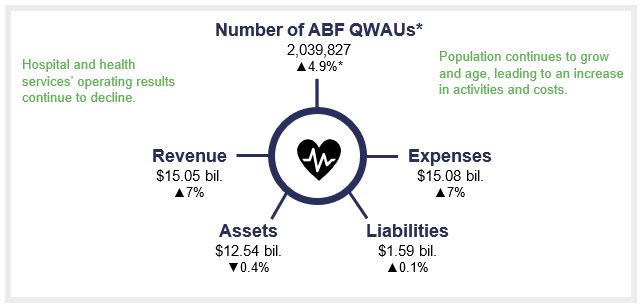
Note: *QWAU stands for Queensland weighted activity unit. It is Queensland’s measure for counting patient activity, based on complexity of patient treatment. ABF stands for activity-based funding.
Compiled by Queensland Audit Office from the HHSs’ financial statements. Excludes the department, Queensland Ambulance Service and Mater public facilities.
Chapter summary
The long-term financial sustainability of the hospital and health services (HHSs) continues to decline, emphasising the need for them to contain growth in expenditure while meeting growing community demand for health services.
An ongoing challenge for the sector is to maintain financial sustainability while ensuring patients are not waiting longer for care than recommended. In 2018–19, eight HHSs (one more than last year) reported operating deficits, despite only three having budgeted for an operating deficit. The operating deficits in five of these HHSs predominantly resulted from the board-approved investment of prior year surpluses into non-recurrent projects, such as the integrated electronic medical records (ieMR).
The department funds the HHSs and must balance providing enough funding to meet Queensland’s health needs while encouraging cost efficiency. The department’s funding model is based on the national funding model. The department makes changes in the state funding model to reflect Queensland conditions and specific investment decisions, such statewide services (for example, neo-natal intensive care unit placements). Significant adjustments are complex to implement on a large scale.
The HHSs delivered 4.9 per cent more clinical activity than last year. Revenue and expenses for delivering health services also grew, but the rate of expenditure growth for delivering the activity was higher, at 7.3 per cent. Expense growth was primarily driven by increased employee expenses to meet demand and non-recurrent project expenditure.
The increase in the value of property, plant and equipment was driven by movements in fair value, not by reinvestment into maintaining and renewing facilities.
The financial sustainability of hospital and health services is under pressure
In 2018–19, the total operating deficit of the HHSs was $34.4 million (2017–18: $37.2 million). The total operating deficit represents 0.23 per cent of the total revenue of the HHSs, or approximately 0.83 days of hospital activity (2017–18: 0.26 per cent or 0.96 days). However, the long-term financial sustainability of the HHSs continues to decline.
In 2018–19, eight of the 16 HHSs reported an operating deficit. Of the 16 HHSs, 10 had an operating result that decreased compared with last year. Overall, the accumulated surplus of the HHSs declined from $359 million in 2014–15 to $282 million in 2018–19.
The operating result of the HHSs has decreased due to:
- costs to deliver activity, which was in excess of their funded activity
- non-recurrent projects, such as the work required to implement the ieMR project. The ieMR is intended to replace paper-based clinical charts and allow healthcare professionals to access patient information from anywhere and at any time.
Increasing expenses compared to health activity
Figure 3B compares the change in the average cost of health activities for those HHSs that receive activity-based funding. Thirteen of the 16 HHSs receive activity‑based funding (ABF).
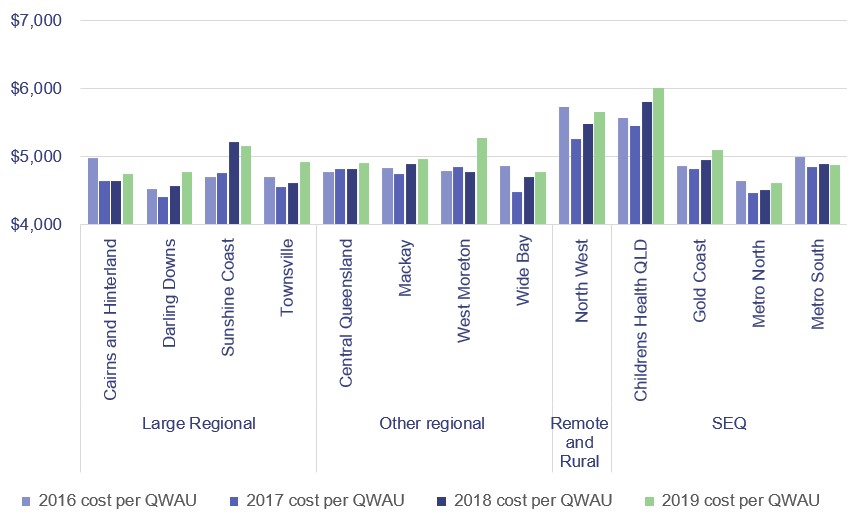
Note: The calculations for this figure include Pharmaceutical Benefits Scheme cost impacts on QWAUs. QWAU—Queensland weighted activity unit.
Queensland Audit Office.
Rising costs
In 2018–19, the cost per Queensland weighted activity unit (QWAU) increased for 11 of the 13 activity-based funded HHSs. The other three HHSs are block funded (funded by a set dollar amount, regardless of how much activity is undertaken) due to their small size and location. Cost increases have occurred due to additional full-time equivalent staff (FTEs) to support health activity and new system implementations. The increase in the costs per QWAU for HHSs with the largest increase were:
- West Moreton, which had an increase in employee costs due to over-occupancy of beds for lower complex healthcare; and an increase in staff on the ieMR project, which led to a higher cost for contracted staff
- Children’s Health Queensland (CHQ), where it was due in part to increases in the costs of drugs. Children’s Health Queensland continues to provide a range of health services outside of the Children’s Hospital. The growth in FTE beyond activity is primarily due to increased FTE relating to non‑activity‑based funding (non-ABF) programs and services in mental health and community settings, in line with CHQ's Children's Health and Wellbeing Services Plan 2018-2028. In addition, CHQ has also increased resources to support and lead delivery of statewide, non-ABF programs, particularly information and communication technology-related programs.
- Townsville, Darling Downs and Gold Coast, where it related to implementation of the ieMR and the use of contracted staff. The ieMR implementation at Darling Downs was paused towards the end of 2018–19, pending a submission to the Cabinet Budget Review Committee for additional funding.
Improving cost efficiency
The cost per QWAU decreased for the Metro South and Sunshine Coast HHSs. Metro South slightly decreased their costs by $8 per QWAU, and Sunshine Coast by $57 per QWAU.
Cairns and Hinterland, Metro North, Central Queensland, and Mackay and Wide Bay HHSs kept their cost per QWAU growth to less than 2.5 per cent. The overall cost per QWAU growth for all of the 13 ABF HHSs was 2.3 per cent, which is less than the wage inflation of 2.5 per cent.
North West HHS delivered significantly more ABF funded activity without a corresponding increase in FTEs. The increase in activity and costs included the return of renal services from the Townsville HHS, with the cost per QWAU also impacted by increased costs for pathology and information communication and technology. While North West and most other HHSs are ABF funded, they receive block funding to assist with meeting costs and providing services that would be financially unviable under an activity‑based funding model.
Sunshine Coast HHS has completed most of its service delivery expansion and up-front investment in digitising the Sunshine Coast University Hospital. This has allowed the FTE levels to better match the demand for services, and the slow-down in expansion and improvement costs has reduced the cost to deliver healthcare.
The trends in Figure 3C show that over the last two years more of the HHSs' average costs per activity unit have exceeded the funding they have received. Two of the HHSs, Central Queensland and Wide Bay, have consistently kept their costs below the funding they have received. Sunshine Coast HHS has kept its average costs per QWAU below its funded price for the last three years, despite the significant growth in its cost per QWAU. This was due to additional funding being provided to support the opening of the Sunshine Coast University Hospital.
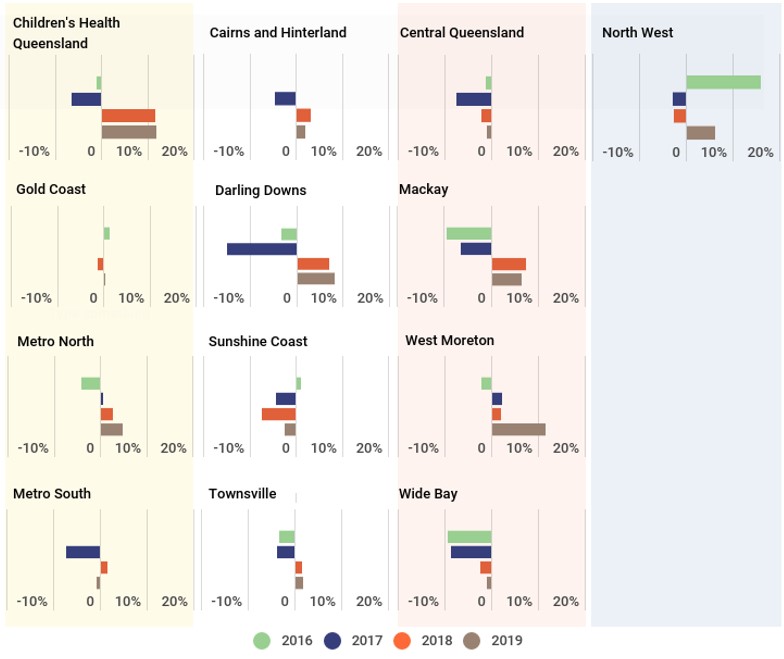
Note: Prior period figures have not been re-counted to reflect current measurement and funding models and reflect actual activity delivered in the relevant year.
Queensland Audit Office.
During 2018–19, the average cost per QWAU for four of the HHSs was below their funded price. This included Central Queensland, Metro South, Sunshine Coast and Wide Bay HHSs. The average cost for the other nine HHSs exceeded their funded price per QWAU. HHSs need to cover the funding gap when their costs are above their funded rate and identify cost efficiencies to improve their sustainability over the medium term. Six of the nine HHSs whose costs per QWAU exceed their funding per QWAU either broke even or had an operating deficit after non‑cash items were removed.
Increasing employee expenses
The relationship between health activity and staffing levels gives an insight into the change in productivity of a hospital. The relationship changes as service demand and the relative experience of the medical workforce changes. Employee expenses represent approximately two-thirds of each HHS’s total expenses.
Approximately 78,000 people worked in the HHSs in 2018–19 (this is based on the minimum obligatory human resource information (MOHRI) data, which is collected on a quarterly basis by the Public Service Commission). This is an increase of three per cent compared with the prior year. HHSs employed 83 per cent of staff in frontline positions, with the remaining employees providing operational and administrative support.
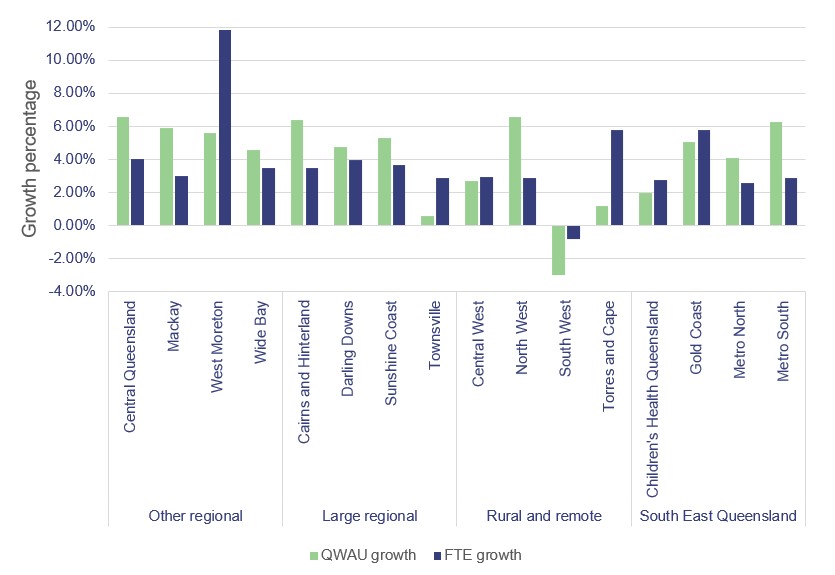
Figure 3D compares the change in employee numbers with the change in QWAU activity between 2017–18 and 2018–19. Six of the HHSs show a growth in the average number of frontline and non-frontline employees that exceeds the growth in activity. Three of those temporarily increased their staffing levels to implement the ieMR program. All undertook other system implementations and increased staff to respond to changing demand.
Queensland Audit Office.
Figure 3E shows that 12 HHSs have delivered the same or more activity than growth in FTEs over the last four years. The FTE for the following four HHSs has increased more than their QWAUs:
- Central West and South West: We expect activity levels to fluctuate relative to FTE growth due to the small size and location of these two HHSs.
- Children’s Health Queensland: This HHS has struggled to improve efficiency due to the complex nature of paediatric healthcare and changing delivery models. Efficiency gains have been offset by increased staff required to implement new systems.
- Sunshine Coast: This HHS’s FTE has increased by slightly over 40 per cent in the past four years due to the opening of the Sunshine Coast University Hospital in April 2017. Activity levels are now returning to a new normal.
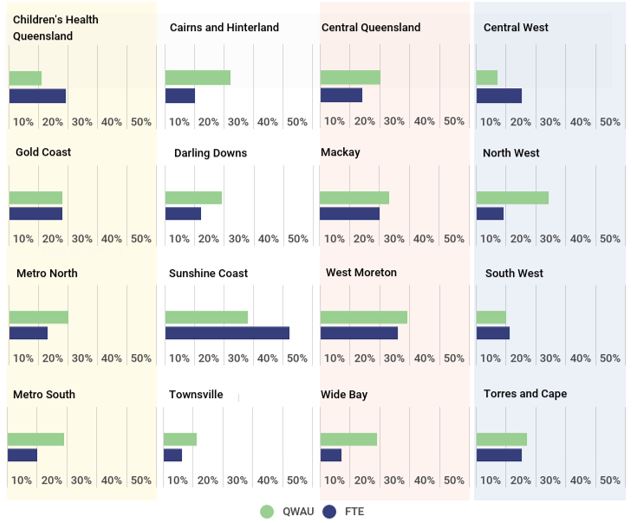
Note: The QWAU amounts shown are total HHS activity. This includes the non-activity-based funding QWAUs. Darling Downs HHS and West Moreton HHS exclude mental health activity to remove the effect of administrative discharges in 2015–16 to ensure a like‑for‑like comparison.
Queensland Audit Office.
The effect on short-term financial sustainability
| Short-term financial sustainability measures |
Benchmark | Number of entities above benchmark 2019 | Number of entities above benchmark 2018 |
|---|---|---|---|
| Operating result | Balanced or in surplus | 8 | 9 |
| Current ratio (current assets divided by current liabilities) |
Greater than one | 10 | 14 |
| Cash available days (number of days entities can pay their operating expenses from their cash balances) |
Greater than 14 days | 11 | 10 |
| Operating cash flows | Cash inflows greater than cash outflows | 7 | 11 |
| Number of hospital and health services that met all four of these financial sustainability measures | 4 | 5 |
Queensland Audit Office calculated from hospital and health service’s audited financial statements.
The results show that the financial sustainability of hospital and health services has reduced slightly from last year.
In 2018–19, four entities achieved the benchmark for all four financial sustainability measures (2017–18: five entities met all four benchmarks). All four entities had at least one sustainability measure that was lower than it was last year.
Three HHSs (Cairns and Hinterland, Darling Downs, and Mackay), budgeted for an operating deficit this year. Cairns and Hinterland and Mackay both had a lower than planned deficit, while Darling Downs achieved an operating surplus. The financial improvement in Cairns and Hinterland resulted from ongoing delivery of financial sustainability plans. Darling Downs and Mackay invested less than they expected in non-recurrent activities, such as ieMR. The HHSs' actual results were a collective deficit of $10.79 million compared to a budgeted deficit of $29.98 million. Additional funding was provided to the HHSs by the department through amendments within the service agreements. Other increases in revenue can be attributed to additional funding for enterprise bargaining agreements and general growth in activity.
Long-term financial sustainability
Long-term financial sustainability is a challenge facing all HHSs. The HHSs receive most of their funding for their operations from the state and federal governments. The provision of high‑quality health services is costly. Costs go up each year due to increases in staff wages, clinical supplies, and drugs, and increases in demand for health services.
We assess the long-term financial sustainability of HHSs by calculating their operating surplus as an average over time. The operating surplus measures the amount of revenue remaining after deducting operating expenses. A positive average result indicates that an entity's revenue consistently exceeds its expenses.
Figure 3G shows each region’s average operating result for 2018–19 has declined, compared to their three-year and seven-year averages. The large regional and other regional groups (refer to Appendix B for groupings) of HHSs have reported deficits, on average, for at least the last three years.
As at 30 June 2019, the HHSs reported a combined cash balance of $671.8 million (2017–18: $656.3 million) despite the accumulated surplus position falling. The cash reserves equate to the HHSs being able to fund themselves for approximately 16.3 days (2018: 17 days). Cash balances are a point in time and move regularly as the HHSs receive fortnightly funding and expend monies.
Due to the high level of public interest and the importance of the long-term sustainability and quality of healthcare services, we are currently undertaking a performance audit on planning for sustainable healthcare services.
Queensland Health’s strategy—Your health, Queensland's future: Advancing health 2026—identifies sustainability as one of five underpinning principles. This includes ensuring available resources are used efficiently and effectively for current and future generations.
Investment in software assets
As at 30 June 2019, $212.9 million of the Queensland health entities’ software assets had reached the end of their useful lives (an increase of $51.9 million from the prior year). $73.3 million of this is attributable to the patient administration system and $24.2 million is attributable to the now replaced finance system.
The procurement process to replace the patient administration system was placed on hold during the financial year due to allegations of conflicts of interest within the procurement team. The planned go-live date was pushed out several years. This increases the risk of the current system not being appropriately supported and failing. The department is procuring resources to mitigate this risk.
Over the next 10 years, another $427.6 million of software assets will be fully amortised, meaning the department expects these assets will have reached the end of their useful lives and will need to be replaced or significantly upgraded. The ieMR accounts for $180.3 million of this value in 2026.
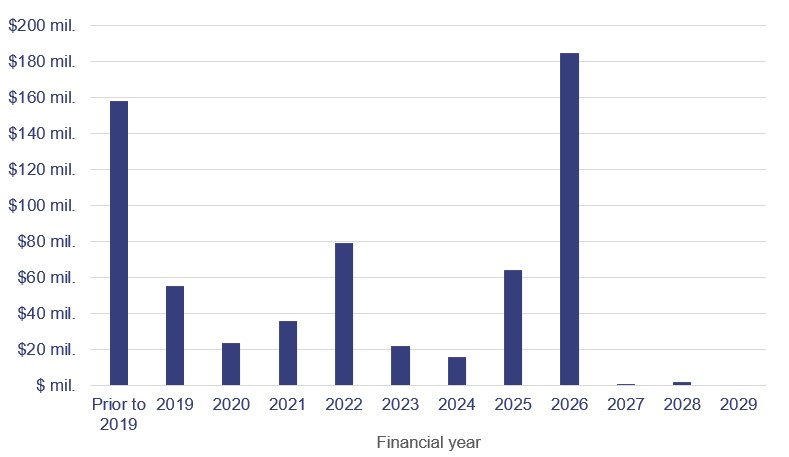
Queensland Audit Office from Queensland health entities’ asset registers.
Anticipated asset maintenance
The HHSs are required to report the level of anticipated maintenance to be undertaken by them. This is maintenance that is necessary to prevent the deterioration of an asset or its function. The HHSs can postpone some maintenance activities without immediately having a noticeable effect on the functionality of the building.
The anticipated maintenance in the current year has increased by $297 million to $893 million. The most significant increases are within the large regional ($83 million) and South East Queensland regions ($170 million). Figure 3I details the increase in anticipated maintenance.
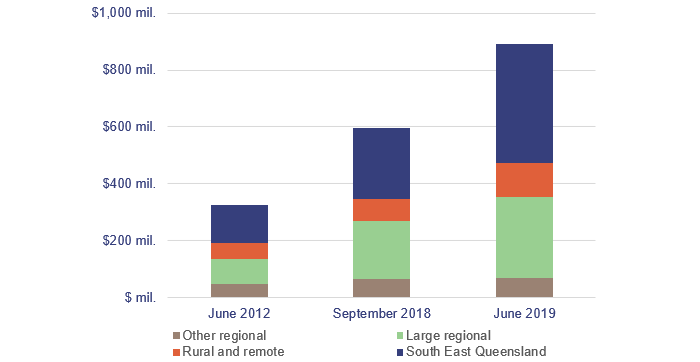
Note: See Appendix B for how the HHSs are grouped into regions.
Queensland Audit Office from the HHS’s annual reports.
To value building and medical equipment assets, the HHSs assess their current condition and the amount of anticipated maintenance. These assessments guide how many more years the HHSs expect to be able to use their assets for and how much their assets will decline in value each year.
We reviewed the reasonableness of these assessments, including whether the HHSs have appropriately determined the condition and remaining useful lives of their assets. The valuation of hospital buildings was one of our areas of focus this year, which we have discussed in Chapter 2.
There is a benchmark level of maintenance stipulated in the service level agreement between the HHSs and the department. The service agreement for 2019–20 to 2021–22 increases the monitoring oversight by the department and requires all HHSs to:
- undertake a comprehensive assessment of their maintenance demand
- consider increasing their maintenance budgets from 2.15 per cent to 2.81 per cent of the current value of their buildings
- submit an annual asset management and maintenance plan to the department.
Action for hospital and health service entities
Queensland health entities need to continue to prioritise high-risk maintenance, and the HHSs must work with the department to determine ways in which to mitigate the operational, clinical, and financial risks associated with anticipated maintenance.
Future challenges—payroll variability
The department recognises $105.7 million (gross) in loan receivables from employees:
- for salary overpayments made for late roster changes
- pay day loan transition arrangements made when the pay week was changed to reduce the volume of overpayments.
This is down from $111.4 million in the prior year. No amounts were written off during 2019 financial year.
The department is undertaking a process to recover payroll overpayment debts by working with the individuals affected.
The rollout of the full functionality of MyHR (an online self-service payroll tool to enable improved visibility and control of human resource information for employees and management) will allow for real-time updates to rosters and allowance entitlements, which should reduce errors relating to under and overpayments. MyHR is currently deployed at fifteen of the HHSs. The projects relating to the department and the sixteenth HHS are currently being finalised.
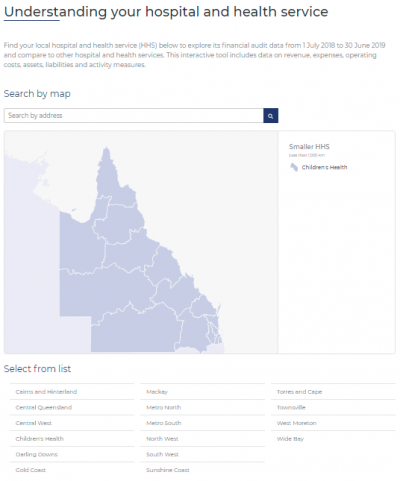
2019 hospital and health service dashboard
Our interactive map of Queensland allows you to search and compare hospital and health services to view their financial performance.