
Overview
The entities in Queensland's health sector work together to provide accessible healthcare for the state and support the wellbeing of Queensland communities.
Tabled 16 December 2021.

Report on a page
This report discusses the audit results of Queensland Health entities, which include the Department of Health (the department) and 16 hospital and health services (HHSs). It also summarises the audit results for 13 hospital foundations, four other statutory entities and three controlled entities.
Financial statements are reliable and internal controls are stronger
The financial reports prepared by Queensland Health entities, hospital foundations, and the other statutory bodies are reliable and comply with relevant laws and accounting standards. The systems and processes (internal controls) they use to prepare financial statements improved during the year, and they have resolved the weaknesses identified in 2019–20 relating to the implementation of the new finance system. None of the annual reports of the HHSs have been tabled by the statutory deadline of 30 September. We continue to find control deficiencies related to procurement and contract management processes within the department and HHSs.
Short-term sustainability has improved
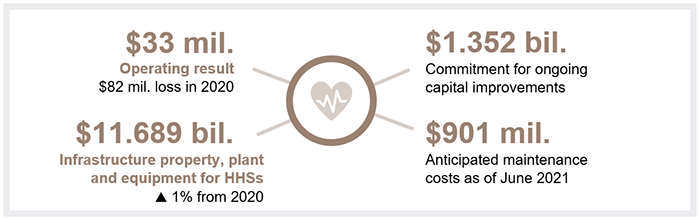
The short-term financial position of the sector has improved in 2020–21, with the HHSs having a combined operating result (the difference between revenue and expenses) of $33 million (2019–20: $82 million loss). This was partly due to the Australian Government guaranteeing its funding in 2020–21, in recognition of the impact of COVID-19.
The total amount of unused staff leave is increasing. This indicates that HHSs face increasing demand, and their workforce is under significant pressure. The HHSs will face increasing employee and contractor costs in the coming year, and the majority of their revenue base is already fixed.
In 2020–21, the cost of anticipated maintenance needed to prevent an asset from deteriorating increased by $65 million from 2019–20.
The ambulance service is facing increasing demand
The Queensland Ambulance Service (QAS) (which is part of the department) is also facing growing demand for all its services, including for the most urgent. The time it takes the ambulance crews to transfer patients into the care of emergency departments has increased significantly over the last five years. If this takes longer than 30 minutes, the extra time is considered to be ‘lost’ time for the QAS. In 2020–21, the QAS lost approximately 112,000 hours. However, the Care4Qld strategy (which was announced in May 2021 and which aims to improve access to emergency services and unplanned care) has delivered some early improvements, but it is still too early to measure the sustained impact of this strategy.
Vaccine rates and quarantine debts need action
After a slow start largely due to supply issues beyond its control, Queensland vaccine rates increased over the second half of the year. More recently, the state has focused on achieving higher vaccination rates in the regions and remote communities, including in Aboriginal and/or Torres Strait Islander communities.
An associated challenge is the need to invoice and collect outstanding debts from the hotel quarantine program. Queensland Health is currently responsible for this, which detracts from its main focus of providing health care. It could work with other departments to meet this requirement.
Recommendations for entities
We have identified the following recommendations for the Department of Health and the 16 hospital and health services (HHSs).
Procurement and contracting controls need to be strengthened |
|
|
The Department of Health and 16 HHSs should:
|
|
The Department of Health should arrange for another entity to manage hotel quarantine debts |
|
|
The Department of Health should pass the hotel quarantine invoicing and debt recovery functions to another government entity that is better suited to invoice processing and debt recovery, and is not as affected by COVID-19. This will allow the department to focus on the provision of health care. |
|
Status of recommendations made in Health 2020 (Report 12: 2020–21)
The health entities have resolved one of the five recommendations made in Health 2020 (Report 12: 2020–21). They have made progress on the other four, but further action is needed.
Despite the health sector continually improving the security of its digital platforms, the risk of cyber attacks has continued to increase. Entities have to ensure systems are secure enough to protect important government information and assets. All entities need strong security practices and must emphasise the importance of them in protecting against fraud or error and significant reputational damage.
This remains a recommendation for health entities in 2021. We have included a full list of prior year recommendations and their status in Appendix C.
Reference to comments
In accordance with s.64 of the Auditor-General Act 2009, we provided a copy of this report to relevant entities. In reaching our conclusions, we considered their views and represented them to the extent we deemed relevant and warranted. Any formal responses from the entities are at Appendix A.
1. Overview of entities in this sector
Queensland Audit Office.
2. Results of our audits
This chapter provides an overview of our audit opinions for the entities in the health sector. It also provides conclusions on the effectiveness of the systems and processes (internal controls) entities use to prepare financial statements.
Chapter snapshot
We express an unmodified opinion when financial statements are prepared in accordance with the relevant legislative requirements and Australian accounting standards.
We express a qualified opinion when the statements as a whole comply with the relevant accounting standards and legislative requirements, with the exceptions noted in the opinion.
Financial statements are reliable
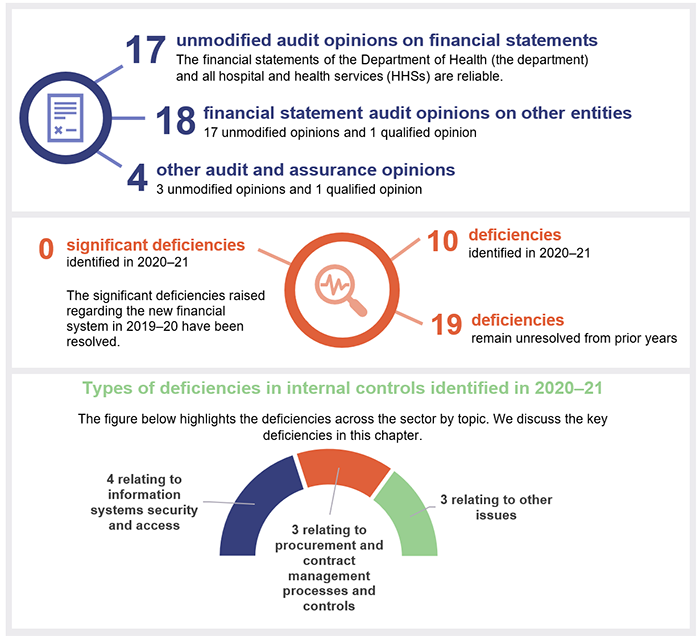
We issued unmodified audit opinions to all 17 Queensland Health entities (the department and the 16 HHSs). Readers can rely on their audited financial statements.
All Queensland Health entities finalised their financial reports within their legislative deadlines. This is a good achievement given the impact of COVID‑19 on staff and workloads.
Queensland legislation requires ministers to table their portfolio entities’ annual reports in parliament by 30 September 2021—within three months after the end of the financial year. Only the Department of Health’s annual report was tabled by this date. None of the HHSs’ annual reports were tabled in parliament as at 9 December 2021. This is the third time in four years the HHSs’ annual reports have been published after 30 September. Without timely public reporting, users of the HHSs' financial statements are unable to assess these entities’ financial performance. This also creates a risk for the entities, that new facts may emerge which could impact on the financial statement audit opinion. If this did happen, we would have to re-issue our audit opinion.
We also audited 13 hospital foundations and five other statutory bodies. All 18 of these entities, except for the Townsville Hospital Foundation, received an unmodified opinion. We qualified our opinion for the Townsville Hospital Foundation on prior year comparative amounts, due to the lack of appropriate controls for ensuring all cash donations from the public and revenues from sales of goods were recorded.
Other audit and assurance opinions
Appendix E lists the other audit and assurance opinions we issued.
We issued a qualified audit opinion for the annual ‘prudential compliance statement’ for Queensland Health’s aged care facilities across four HHSs.
In this statement, Queensland Health is required to outline to the Australian Government how it has managed refundable accommodation deposits, accommodation bonds, and entry contributions from aged care residents.
We qualified our audit opinion because of two non-compliance issues with financial regulations. For example, Queensland Health had not provided evidence that it had completed accommodation agreements with residents within the legislative time frame.
Entities not preparing financial statements
Not all entities in the health sector produce financial statements. Appendix F lists the entities not preparing financial statements and the reasons why.
Internal controls are generally effective
We assess whether the internal controls used by entities to prepare financial statements are reliable. We report any deficiencies in the design or operation of those internal controls to management for their action. Those simply rated as deficiencies are of lower risk and can be corrected over time. Those rated as significant deficiencies are of higher risk and require immediate action by management.
Overall, to the extent that we tested them, we found the internal controls that health sector entities have in place to ensure reliable financial reporting are generally effective but can be improved. We identified no significant deficiencies and 10 deficiencies in the current financial year. Nineteen issues remain unresolved from prior years.
All health sector entities have either addressed their identified control deficiencies or are on track to do so by the agreed dates. Of the new deficiencies identified in our 2021 audits, six remain unresolved as of 31 August 2021.
Prior year issues have been largely resolved and internal controls have been improved
Health entities have resolved 39 issues we raised in previous years (2014 to 2020). Thirty of those issues resolved related to issues that were raised in the last two financial years.
We acknowledge that health entities have committed to resolving long-outstanding issues in 2021. There are indications the 19 issues remaining outstanding from previous years will be resolved within the agreed due dates.
There has been a significant decrease in the total number of deficiencies raised (2021: 10; 2020: 51). This indicates there has been an improvement in the effectiveness of systems and processes in the last year. The outstanding significant deficiency relates to our audit of the Annual Prudential Compliance Statement, which was qualified in 2019–20.
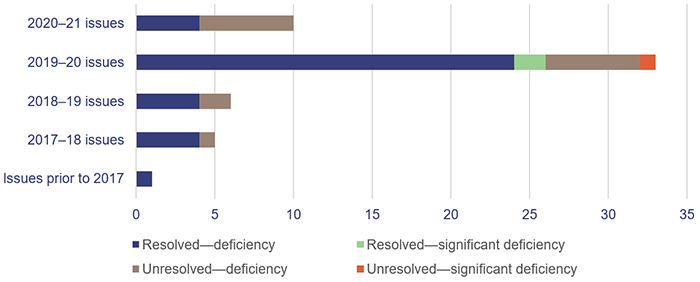
Figure 2A shows the number of internal control deficiencies we have raised in each of the last four financial years that were unresolved as at 1 July 2020 or were raised during 2020–21, and their status as at 31 August 2021.
Queensland Audit Office.
Information systems controls and cyber security
In our report to parliament—Queensland Health’s new finance and supply chain management system (Report 4: 2020–21)—we found that Queensland Health entities’ internal controls within the new finance system were not effective. Seven significant deficiencies identified in 2020 related to information technology (IT) general controls. These have now been resolved.
In November 2020, the Australian Cyber Security Centre reported a high-alert risk for cyber attacks on the Australian health sector. It recommended that all network owners review their controls against ransomware (malicious software that blocks access to computer systems or information until money is paid). Throughout 2020–21, cyber attackers targeted several health services within Australia, forcing hospital closures and IT system shutdowns.
It is anticipated that the COVID-19 pandemic will continue to affect the health sector and require increased use of digital solutions. Entities should continue to implement Recommendation 3 from our report Health 2020 (Report 12: 2020–21), which was to strengthen the security of their information systems.
Procurement and contract management
Although we have seen significant improvements in terms of health entities resolving long-outstanding issues, we continue to find control deficiencies related to procurement and contract management processes within the department and HHSs.
Effective procurement processes ensure there is a fair and robust system in place to obtain goods and services. They also assist entities in obtaining value for money with their purchasing decisions.
To deliver good management of contracts, the individual entities should use centralised contract registers rather than individual business units having their own, which is currently the case in some instances. This ensures the necessary information is centrally stored and reduces the risk of suppliers not delivering on agreed terms. Contract registers can be used by the entities to monitor contract expiry dates and plan future procurement before a contract ends—to maximise the value for money achieved in new contracts.
There are currently 10 outstanding deficiencies relating to procurement processes and controls. They include issues to do with non-compliance with procurement procedures, a lack of contract registers, a lack of formal documentation, and a lack of supporting documents for contracts.
Recommendation for Queensland Health entitiesProcurement and contracting controls need to be strengthened The Department of Health and 16 HHSs should:
|
Assessment tools for internal controls
We are developing new assessment tools for internal controls relevant to public sector entities. They will provide the entities with greater insight into the strength of their internal control processes.
These tools focus on asset management, change management, culture, governance, grants management, information systems, monitoring, procure-to-pay (the whole procurement process), record keeping, and risk management.
We are currently consulting with our clients on these tools and intend to begin using them in our audits from 2021–22. Our reporting on internal control deficiencies will not change.
3. Ongoing financial sustainability
This chapter analyses the financial performance and position of health sector entities. We consider both financial sustainability and emerging issues relevant to the sector.
Chapter snapshot
The hospital and health services’ operating results have improved
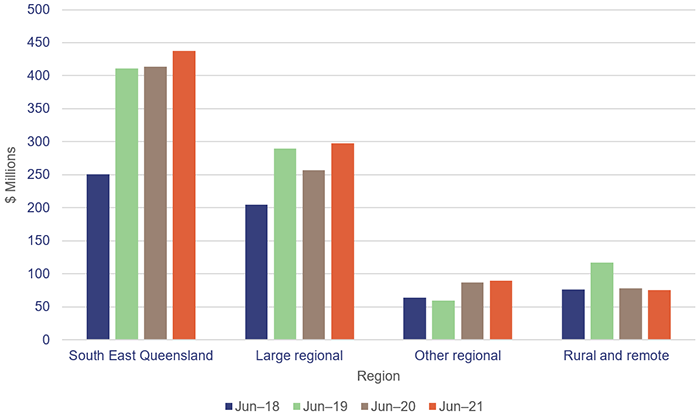
The combined operating result (the difference between revenue and expenses) of the HHSs in 2020–21 was a $33 million surplus (2019–20: $82 million loss). Fourteen of the 16 HHSs reported an operating surplus, and only two reported an operating loss (2019–20: 11 HHSs reported a loss). The 2020–21 state budget had only one HHS budgeted to make a deficit for the year—Sunshine Coast HHS. The other 15 HHSs were budgeted to achieve a zero operating result for the year.
Figure 3A shows the HHSs' operating results grouped by regions.
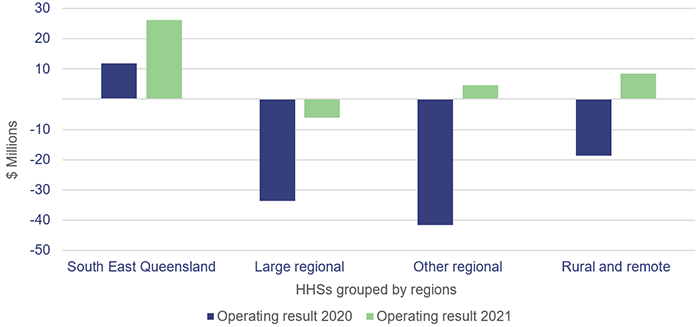
Notes: Appendix B shows how the HHSs are grouped into regions. See Appendix G for individual HHS financial results.
Hospital and health service financial statements 2019–20 and 2020–21.
The Queensland and Australian governments fund 13 of the HHSs based on the number and complexity of clinical services provided to patients (known as activity-based funding—ABF). Three rural and remote HHSs are block funded (which means they are funded for services outside the scope of ABF), but they still have activity targets to be met, similar to activity-based funded-HHSs.
In 2019–20 and 2020–21, activity-based funding was guaranteed (which meant funding was received even if the state did not reach its activity targets for the year). On 5 November 2021, the Australian Government announced it was extending this guarantee for an additional year (to 30 June 2022) in recognition that COVID-19 is still having a significant impact on public hospitals. The Department of Health has not yet received confirmation of how much the state will receive, so it has not confirmed how this will affect HHS funding arrangements.
In 2020–21, guaranteed funding helped HHSs to achieve a surplus (although this was offset by increasing employee expenses). The department standardises health activity into Queensland weighted activity units (QWAU). For example, a HHS records a higher number of QWAUs for delivering complex surgery than for a simple day procedure.
While the HHSs were funded for $4,895 per QWAU in 2020–21, the cost of delivering a QWAU in 2020–21 was, on average, $5,108. The difference is related in some part to under-delivery of activity targets in six HHSs, and cost increases due to the management of the COVID-19 response. COVID-19 activity and expenditure is included in the reporting of the cost per weighted activity unit. HHSs need to cover the funding gap when their costs are above the funded rate.
The department has applied efficiency and productivity dividends on HHSs. Efficiency dividends encourage HHSs to identify cost savings by reducing how much the department funds them, without reducing their target level of QWAUs. With productivity dividends, the department increases the HHSs’ expected activity output without a corresponding increase in the funding it provides.
As Figure 3B shows, none of the regions (defined in Appendix B) have been able to achieve sufficient savings to close the gap between the cost and funding to deliver a QWAU. However, 10 HHSs have reduced their costs to narrow this gap over the last two years.
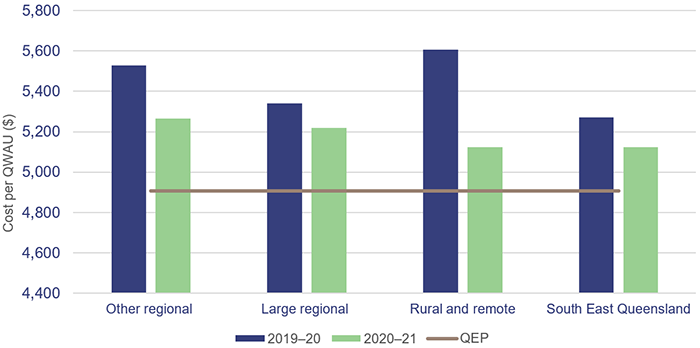
Notes: Rural and remote—only one HHS is included in this figure (North West HHS) as the other three are block funded. QEP—Queensland Efficient Price, which is based on the average cost to deliver a QWAU, averaged over two years.
Queensland Audit Office.
The HHSs are facing increasing demand for their services and will need to meet the Queensland weighted activity units (QWAU) targets within the constraints of their budgets. To assist, the Department of Health has provided funds for additional beds to meet the increasing demand and to decrease the waitlists in order to target key performance indicators.
Workforce under pressure
The health sector in Queensland has had a challenging task during the months since COVID-19 emerged. Even before it had to cope with the challenges the pandemic presented, it was dealing with increasing demand for its services. This has continued, with demand exceeding supply in some cases.
One effect of this is the growth in the unused leave balances of our frontline health workers since 2020–21.
The wellbeing of the workforce is a significant issue that could impact on the sustainability of the health sector. This will be a major challenge for the Department of Health when Queensland’s borders open in December 2021.
It is important to have enough hospital beds to manage demand. It is even more important that we have a highly energised health workforce to cope with the risk of a COVID-19 outbreak. High leave balances indicate the workload of our health workers may be unsustainably high.
Increasing leave balances
Recreation leave balances (total hours) have increased by about 7.8 per cent in 2020–21 in comparison to 2019–20. This indicates there has been an impact on health staff’s ability to take leave due to diversions to COVID‑19-related activities and the overall increase in demand for health services during 2020–21.
Figure 3C shows the increase in average recreation leave hours per staff for HHSs. Fifteen out of 16 HHSs had an increase in average recreation leave balances in 2020–21. On average, the highest increase in leave balances was in the ‘Other regional’ HHSs where it was approximately 11.5 hours per employee. The other three regions all had an average increase of between five and eight hours per employee.
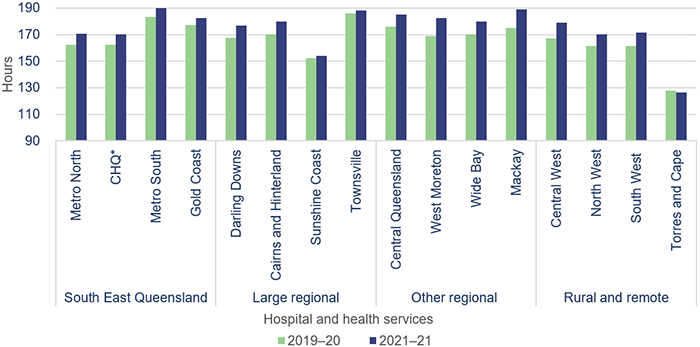
Note: * CHQ—Children’s Health Queensland Hospital and Health Service.
Queensland Audit Office from Department of Health data.
The growing leave balances will lead to an increase in expenses in the future, as staff take leave and temporary roles are filled to meet the workforce requirements.
Border closures have contributed to the increase in recreation leave balances (hours). This is a significant issue for regional HHSs and rural and remote HHSs, which have traditionally relied on medical and nursing support from staff who live outside of Queensland and on visiting medical officers (VMOs), who provide the sole specialty service in several disciplines in many of these HHSs. HHSs have reduced their use of VMOs as they have not been able to access them from other jurisdictions or internationally.
Visiting medical officers (VMOs) enhance full-time specialist services by providing specialty input in several disciplines throughout the state and advanced specialities at major metropolitan and regional hospitals.
Increasing employee expenses
Increasing employee expenses are mostly responsible for the increasing cost per QWAU in HHSs. In 2020–21, employee expenses increased by 4.8 per cent to $11.476 billion, and they make up 68 per cent of total HHS expenses.
With the Queensland borders currently closed (as at 18 November 2021) to a number of national and international arrivals, the ability of the HHSs—especially those in rural and remote areas—to access temporary staff at a cost-effective rate is limited. The costs of contractors are increasing, which further impacts on the sector’s bottom line. Contracted expenses may also increase if the HHSs need to hire additional resources to backfill positions due to the suspension of unvaccinated staff.
COVID-19 pandemic leave
In November 2020, the Queensland Government announced two days of pandemic leave for health staff in recognition of the effects of COVID-19 on staff wellbeing. This leave is separate to an employee’s existing leave entitlements and must be taken within two years, or the leave is lost.
The 2020–21 leave data also shows that health staff have not fully used this leave. As at 30 June 2021, 49 per cent of staff had not taken any of their pandemic leave.
This indicates the health workforce is under significant stress and the extra leave provided has not been used due to the increasing demands on it. Failure to take leave during the pandemic will lead to a fatigued workforce, and the increasing demands will become unsustainable.
Future capital requirements to meet changing service delivery needs
Future capital requirements
Queensland makes up 20 per cent of the Australian population. The state’s population has been rising steadily, and in 2021, it has had the highest growth of any state or territory in Australia (as shown in Figure 3D).
This will add additional pressure on the health system and the services it needs to deliver. The health sector budget for 2021–22 and future years includes a number of capital projects and investments to increase its capacity to meet the growing demand.
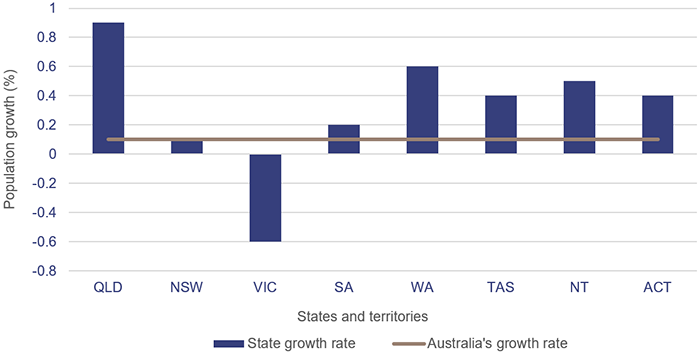
Population estimates: States and territories—Queensland Government Statistician’s Office (qgso.qld.gov.au).
The current state budget announced $1.352 billion for health-related capital projects. These include:
- $283.7 million as a part of the Building Better Hospitals program (redeveloping and expanding a number of hospitals)
- $233.6 million for the Sustaining Capital Program (enhancing and optimising existing infrastructure to ensure facilities and equipment are fit for purpose)
- $105 million for the Satellite Hospitals Program (enabling hospitals in South East Queensland to manage demand and free up capacity while continuing to safely manage patients through alternative models of care)
- $61.8 million invested in the Queensland Ambulance Service (QAS) for capital purchases.
Not all of these programs will be delivered in the 2021–22 year. Related operational costs will need to be included in future budgets to ensure these assets can be effectively and efficiently used.
Anticipated maintenance
HHSs continue to face significant challenges in funding the anticipated maintenance of their assets.
Anticipated maintenance is defined as maintenance that is necessary to prevent the deterioration of an asset or its function, but which has not yet been carried out.
Anticipated maintenance is a common building maintenance strategy used by public and private sector industries. The Queensland Government Maintenance Management Framework requires the reporting of anticipated maintenance. All Queensland Health entities comply with this requirement.
The Department of Health has a service level agreement with all the HHSs in Queensland that states a minimum of 2.81 per cent of each HHS’s building portfolio is required to be spent annually on maintenance to sustain the building assets to achieve expected life cycles. While newer buildings may not require this level of maintenance, older buildings require more, so on average, the 2.81 per cent reflects what is expected at a portfolio level.
Currently, all the HHSs spend below this target—between one per cent and 2.5 per cent for the 2019–20 and 2020–21 years. There is a risk that building assets that do not receive maintenance when required will deteriorate. This will increase the anticipated maintenance required to keep the buildings in the condition they are required to be in.
In 2020–21, across the state’s HHSs, the current cost of anticipated maintenance is $901 million, which is an increase of $65 million from 2019–20.
Figure 3E shows, by HHS regions, the growth in anticipated maintenance for the last four financial years.
Queensland Audit Office from signed financial statements of the HHSs.
All 17 entities should continue work on addressing Recommendation 5 from our report Health 2020 (Report 12: 2020–21), which was to prioritise high-risk maintenance.
4. Ambulance services
The Queensland Ambulance Service (QAS) (which is part of the department) continues to be directly impacted by COVID-19 and by increasing demand for health services. In addition to its usual work, the QAS has taken on extra, non-business-as-usual work, including:
- rapid deployment of seven fever clinics—QAS staff provided over 12,000 staff hours in 2020–21 to operate seven QAS fever clinics. This was in addition to business-as-usual activity and was resourced through redeployment of staff and using overtime as a rostering method
- hotel quarantine relocation transports
- assistance/attendance at vaccination centres.
In our Forward work plan 2021–24, we indicated we would be undertaking an audit to examine how well Queensland Health is addressing the root causes affecting ambulance response times. Two of the key issues are the difficulty in moving patients from ambulance stretchers into emergency departments and hospitals within the required time frames; and the continuing increase in demand for QAS’s services.
In this chapter, we analyse Queensland Health’s performance against ambulance response times, patient off stretcher times (the percentage of patients transferred to the care of an emergency department within 30 minutes), and ambulance ‘lost’ time (the amount of time greater than 30 minutes that a patient remains on QAS stretchers). We also compare the demand for QAS’s services and its response times to that in other Australian jurisdictions.
Based on the findings of this chapter—which includes commentary on the root causes affecting ambulance response times—we do not see value in conducting a detailed performance audit on ambulance services in 2021–22. We will, however, provide a further update in our Health 2022 report and will consider the impact of the Care4Qld strategy announced in May 2021 in our assessment of the value of any future audit.
Chapter snapshot (key measures 2020–21)
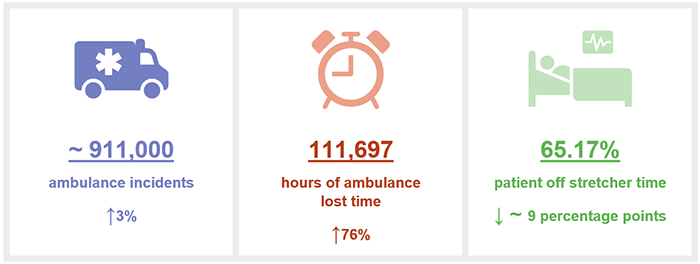
Notes: The increase/decrease in numbers in this snapshot show the variation between the 2020–21 and 2019–20 financial years. Lost time and patient off stretcher figures are reported against Queensland’s top 26 public hospitals (refer to Appendix H). Data includes priority codes 1 and 2 (emergency and urgent cases). ~ means approximately.
Summary of findings
The QAS is facing increasing demand for all its services, including for the most time-sensitive categories. There is more demand for ambulances in this state than in others. One reason for this is because in Queensland, the ambulance is a publicly funded service that users do not have to pay for. Other factors which also influence Queensland’s demand for ambulance services include Queensland’s geography, population density in South East Queensland and popular regional areas, and Queensland’s decentralised nature.
Despite the demand pressure, in 2020–21 QAS met its key performance indicators for time critical (Code 1A) incidents. However, it did not achieve its targets for Code 1B and Code 1C incidents, and its performance for Code 2A incidents declined from 2019–20 to 2020–21.
This parallels with a significant increase in the time it takes the ambulance crews to transfer a patient into emergency departments. The QAS lost approximately 112,000 hours in 2020–21. Making more beds available through the Care4Qld strategy (which was announced in May 2021, and which aims to improve access to emergency services and unplanned care) is helping to ease pressure on this issue.
Demand for ambulance services is increasing
The demand for ambulance services has grown significantly in the last five years, particularly for more complex and priority cases. Since 2016–17, the number of:
- code 1 incidents (emergency) attended by QAS have increased by 18 per cent
- code 2 incidents (urgent) have increased by 19 per cent.
Several factors are increasing the demand for ambulance services, including:
- Queensland’s population growth—in 2021, Queensland had the highest population growth of any state or territory in Australia (see Figure 3D, in Chapter 3)
- an ageing population—the demand for ambulance services increases with age. QAS advises that while people over 65 years of age account for 15 per cent of the population, this age group makes up about 36.7 per cent of QAS’s total caseload.
In the Gold Coast, Sunshine Coast and Wide Bay regions, QAS’s workload for people over 65 years accounts for about 40 per cent of total caseload. The top five dispatch categories for people over 65 years are Medically Authorised Ambulance Transports (for example, transfers from general practitioners (GPs), interfacility patient transfers, or pre-scheduled appointments), sick persons (when the caller indicates the patient is generally unwell), falls, chest pain (non-traumatic), and breathing problems. QAS reports that cases referred from GPs have the highest dispatch growth rate - the complexity of cases—the QAS is dealing with more complex cases, such as people with mental health issues, and falls (by the ageing).
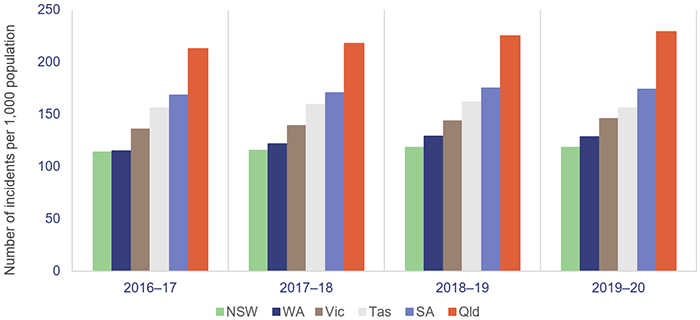
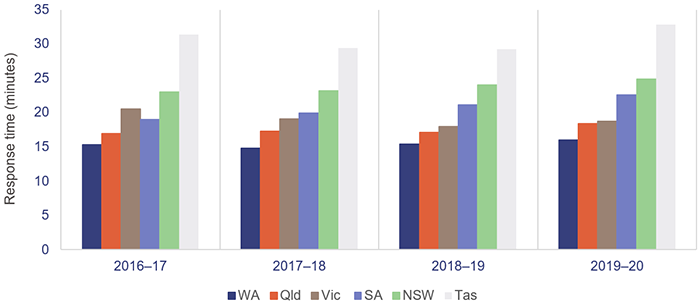
Queensland has the highest number of ambulance incidents (events that result in one or more responses by a QAS resource) per 1,000 population compared to the rest of Australia, as shown in Figure 4A. A key reason for this is that QAS is a publicly funded service compared to New South Wales, which has adopted a user pays model, and to Victoria, South Australia, and Western Australia, which use subscriber-based models.
Notes:
- Data is for all hospitals across the states. Latest available information is up to the 2019–20 financial year.
- Population rates are derived using the 31 December estimated resident population of the relevant financial year.
- NSW—New South Wales; WA—Western Australia; Vic—Victoria; Tas—Tasmania; SA—South Australia; Qld—Queensland.
Productivity Commission, Report on Government Services 2021 Part E Section 11 Ambulance Services.
Ambulance response times
Ambulance response times measure how long it takes from when a call to triple zero is answered to when an ambulance arrives at the scene of an emergency. The performance targets are set for code 1 (emergency cases) only.
Code 1 response times
In 2020–21, QAS met its response time performance targets for Code 1A (actual time-critical) incidents but not for codes 1B (emergent time-critical), and 1C (potential time-critical), as shown in Figure 4B.
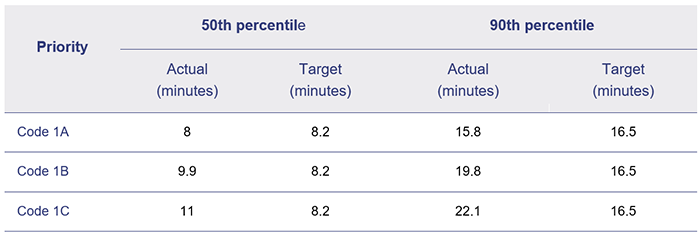
Note: Response times are calculated across Australia and measure the time (in minutes) within which 50 per cent and 90 per cent of the first responding ambulance resource arrives at the scene of an emergency code 1.
Queensland Audit Office from QAS Service Delivery Statements 2020–21.
Despite having the highest number of responses in Australia in proportion to the state’s population, QAS has managed to achieve better response times for emergency cases (code 1) than most other jurisdictions, as shown in Figure 4C.
Notes:
- Data is for all hospitals across the states. Latest available information is up to the 2019–20 financial year.
- Differences across states in the topography, road/transport infrastructure, dispersion of the population, personnel mix, and response systems and processes affect statewide response times data.
- In New South Wales, Queensland, and Western Australia, response times are calculated from triple zero transfer to dispatch. Victoria, South Australia and Tasmania calculate them from the first key stroke.
Productivity Commission, Report on Government Services 2021 Part E Section 11 Ambulance Services.
Code 2 response times
There are no performance targets in QAS’s service delivery statements for code 2 incidents.
Figure 4D shows the demand (number of incidents) for Code 2A (urgent response) against the respective response times in minutes (for the 90th percentile) for the last five years.
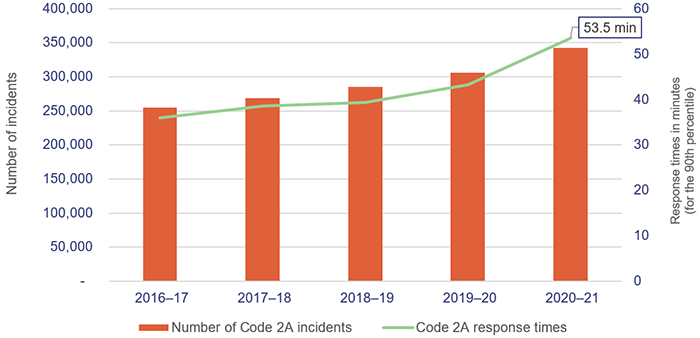
Queensland Audit Office from data received from the Queensland Ambulance Service.
The increase in code 2 response times in 2020–21 reflects the ambulance lost time in 2020–21 due to not being able to get patients off stretchers within the expected 30 minutes. QAS does not have an internal performance measure on code 2 response time performance and there are no performance targets in its service delivery statements. This is because QAS’s focus is on ensuring it is responding to the most urgent cases.
We recognise that code 2 response times are an indicator of the effect of ambulance lost time at hospitals and a system-wide issue that QAS cannot solve on its own.
Moving patients off ambulance stretchers
In Measuring emergency department patient wait time (Report 2: 2021–22), we reported that the patient off stretcher time (POST) performance measure had not been met at the statewide level in the past seven years. Queensland’s target for POST is to have 90 per cent of patients transferred off stretchers into the care of an emergency department within 30 minutes.
The percentage of patients transferred off stretchers in less than 30 minutes has decreased further since that report, and as at 30 June 2021, the overall POST performance was 65.17 per cent—a decrease of about nine percentage points since 2019–20. In 2020–21, none of the 14 hospital and health services (HHSs) with a top 26 reporting hospital met its POST target, except for North West HHS.
The COVID-19 pandemic has placed further pressure on emergency departments, affecting POST performance. For example, hospitals have had to adopt new infection control measures for the safety of staff and patients, such as social distancing and personal protective equipment. These requirements increase the time required to provide treatment and affect patient flow. Several Queensland hospitals also provide COVID-19 fever clinics from their emergency departments.
Figure 4E shows the POST performance for the top 26 Queensland hospitals over the last five years. We note that POST is not a performance measure for QAS—it is a measure of the performance of HHSs. However, since the results of this measure indicate hospitals do not have sufficient capacity at present, this is a system-wide issue.
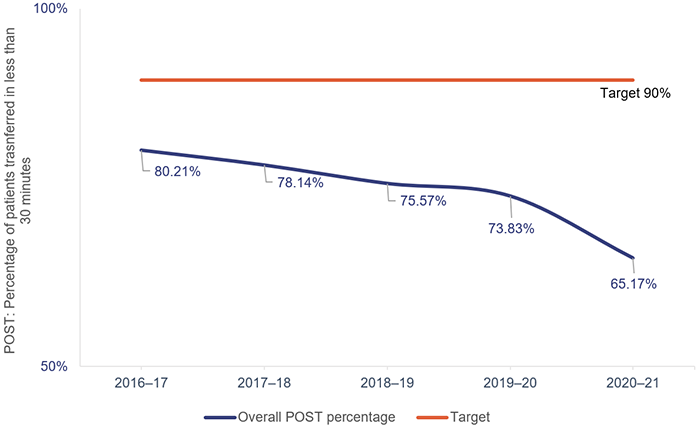
Queensland Audit Office, from data received from Queensland Ambulance Service reporting system.
Ambulance patient off stretcher delays occur when paramedics are unable to complete transfer of care or handover of a patient to an emergency department within 30 minutes (which is the clinically appropriate time frame recommended by Queensland’s Metropolitan Emergency Department Access Initiative in July 2012).
The inability to meet this target is due to several reasons, including volume and complexity of patients presenting for treatment (both walk-ins and ambulance presentations), availability of ward beds, efficiency of hospital discharge processes, and the limited availability of specialists to attend patients in emergency departments.
When there is a patient off stretcher delay, patients are looked after by QAS paramedics until formal transfer of care to the emergency department takes place. Faster off stretcher times ensure ambulances are available to respond to those patients waiting unseen in the community.
Ambulances are losing time
Ambulance ‘lost’ time measures the cumulative amount of time greater than 30 minutes that a patient remains on a QAS stretcher, inclusive of formal handover and transfer of the patient to an available bed within the emergency department. Hospitals assume responsibility for overall patient care from the time of triage; but, as mentioned previously, when QAS paramedics are unable to offload their patients due to flow constraints, they provide care until the formal transfer takes place.
Lost time is not reported as a performance indicator in the Department of Health annual reports. It is, however, internally measured by QAS.
Overcrowded emergency departments affect ambulance services. If an overcrowded emergency department is unable to receive more patients, ambulance services are not able to transfer them.
In 2020–21, ambulance lost time for the top 26 hospitals was 111,697 hours—an increase of 76 per cent from 2019–20.
Figure 4F shows the ambulance lost times in total hours for the last four financial years for the top 26 hospitals for codes 1 and 2 incidents. There was minimal increase in ambulance lost time from 2018–19 to 2019–20 due to the impact of COVID-19 lockdowns and a reduction in demand during this period.
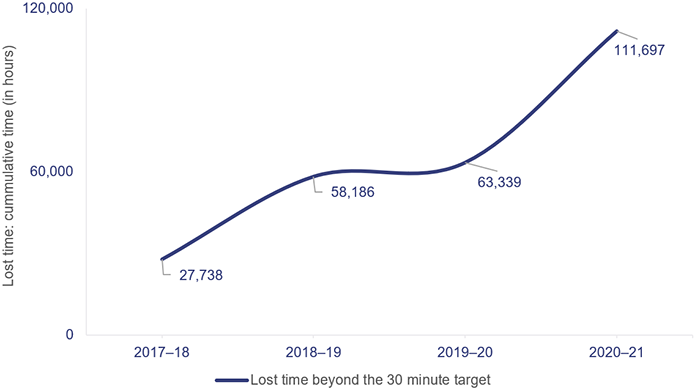
Note: QAS began recording ambulance lost time in 2017–18.
Queensland Audit Office, from data received from Queensland Ambulance Service reporting system.
A key factor in the increase in ambulance lost time is the increase in emergency department demand for both ambulance patients and walk-in patients. As noted in our Measuring emergency department patient wait time report, ambulance presentations to emergency departments increased by 45.8 per cent between July–September 2014 and October–December 2020. Walk-in presentations increased by 20.5 per cent during the same period.
This has led to significant increases in the time it takes to transfer a patient to an emergency department.
Figure 4G shows, by HHS, the POST performance against accumulated ambulance lost time for the top 26 hospitals for codes 1 and 2 incidents. The HHSs serving heavily populated areas have the lowest performance when it comes to moving patients off stretchers within 30 minutes, and they have the highest amount of ambulance lost time as a result.
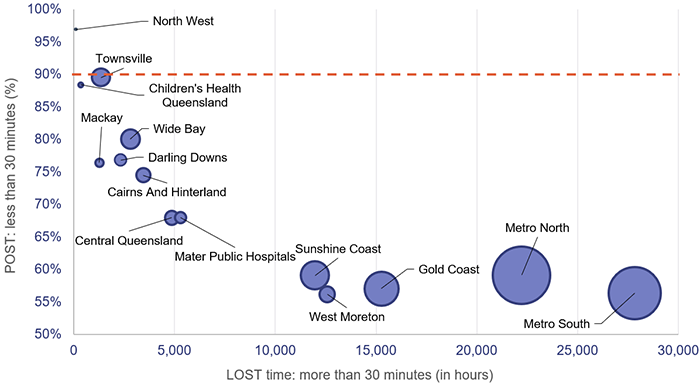
Note: The size of the circles corresponds to the number of patients transferred to emergency departments by QAS. The orange line represents the POST target.
Queensland Audit Office from QAS reporting system.
The department is currently working on improving emergency services. In this, it is supported by the Queensland Government’s Care4Qld strategy announced in May 2021, which aims to improve access to emergency services and unplanned care across Queensland. Of the 416 beds announced as part of this program, the department has indicated that 266 were operational as at October 2021.
The code 1 and 2 lost time has improved recently, following initiatives implemented as part of the Care4Qld strategy. According to the data from QAS’s reporting system, there has been a 31 per cent decrease over the five months from May to October 2021. POST has also improved by 4.6 percentage points to 62.73 per cent over the same period. We note it is still too early to measure the sustained impact of the Care4Qld strategy as ambulance lost time can vary over a 12-month period due to seasonal fluctuations on demand such as flu seasons and heat waves.
Assisting patients with mental health issues
In 2020–21, the QAS attended 58,213 cases of mental health (patients under triage category psychiatric/abnormal behaviour/suicide attempt). This represents an increase of 3.2 per cent compared to the previous year and an increase of 70.2 per cent over the last five years.
In addressing the increase in demand in mental health incidents, the QAS has implemented several strategies including:
- the Mental Health Liaison Service. This engages senior mental health clinicians to provide support and assistance to QAS personnel statewide through the provision of information and advice to crews before and on scene, or by providing intervention to people who call triple zero
- the Mental Health Co-responder program. This is a collaboration between the QAS and participating HHSs, enabling specialised mental health care. The program includes a physical and mental health assessment and preparation of an appropriate treatment plan.
In 2020–21, the program was operational in six HHSs (Metro South, Metro North, Gold Coast, Sunshine Coast, West Moreton, and Cairns). Due to the success of the program, it was extended to Townsville HHS in July 2021.
QAS’s evaluation of its pilot Mental Health Co-responder program found that:
- 68 per cent of the patients seen by the teams stayed at home, with individually tailored assessments and interventions offered
- 55 per cent of the cases seen were for suicide-related incidents
- the average patient case cycle from a triple zero call to the provision of treatment was approximately 120 minutes
- the QAS mental health co-responder was the first responder 70 per cent of the time
- paramedics who have worked with the co-responders have reported increased skills, knowledge, and confidence in the provision of mental health crisis interventions.
Increasing budget for QAS
In the 2021–22 Queensland state budget service delivery statements, QAS is budgeted to:
- recruit 114 full-time equivalent staff. These are mainly additional ambulance operatives to assist with the increasing demand for ambulance services and pre-hospital emergency medical care
- commission 136 new and replacement ambulance vehicles
- progress the planning and construction phases for six new ambulance stations and for replacement of the North Rockhampton Ambulance Station
- undertake planning and construction phases for the redevelopment of the Cairns Ambulance Station and Operations Centre, the Southport Ambulance Station and Gold Coast Operations Centre, and refurbishment of the Rockhampton Ambulance Station and Operations Centre
- progress the implementation of technology to make best use of available resources across acute emergency dispatch, resource planning, and non-emergency patient transport.
However, if paramedics are unable to transfer their patients into the hospital system, within specified time targets, the additional infrastructure and employees may not lead to a corresponding improvement in the patient off stretcher time and the time lost by the paramedics waiting at the emergency departments.
5. COVID-19 vaccine rollout and recovery of hotel quarantine fees
One of the most pressing issues for our state and nation at this time is the COVID-19 vaccine rollout. The Australian National Audit Office is currently conducting an audit to assess the effectiveness of the Australian Government’s planning and implementation of this.
In this report, we provide an overview of the rollout in Queensland as at 7 December 2021, covering key statistics at significant dates, the responsibilities of the Queensland and Australian governments, and the recovery of hotel quarantine fees.
The Queensland COVID-19 vaccine program began on 22 February 2021, with the aim that every Queenslander who wants to be vaccinated against the virus will be.
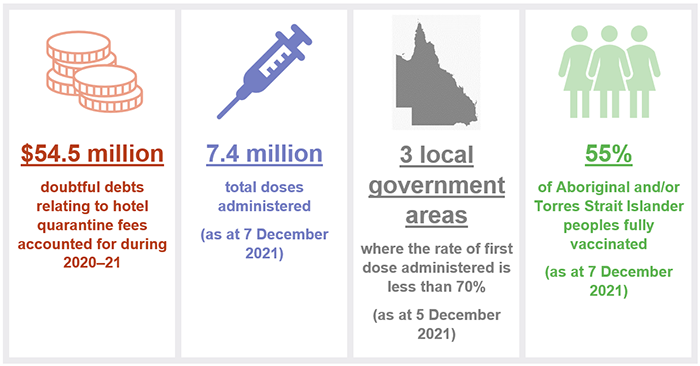
Chapter snapshot
The rollout of the vaccine is a joint state and Australian Government responsibility
Queensland Health provides vaccinations via the 16 HHSs and the Australian Government provides them via the Primary Health Networks, which include general practitioners, pharmacists, Aboriginal community controlled health services, aged care, and disability support.
The Australian Government is responsible for obtaining the vaccines, and has made agreements with four providers—Pfizer-BioNTech; University of Oxford—Astra Zeneca; Moderna; and Novavax. The rollout began primarily with Pfizer-BioNTech and Astra Zeneca, both of which were approved for use by the Therapeutic Goods Administration (TGA) in early 2021. Moderna was approved for use on 9 August 2021, and rollout of this vaccine by Queensland pharmacists began on 22 September 2021. The TGA is currently evaluating the Novavax vaccine.
Figure 5A shows the responsibilities of the Australian and Queensland governments for the vaccine rollout.
|
Australian Government |
Queensland Government |
|---|---|
If the site is a Primary Health Network site, the Australian Government is also responsible for:
|
|
Adapted from the Australian COVID-19 Vaccination Policy, 13 November 2020, Australian Government.
Vaccine sentiment and demand versus supply
The Australian Government monthly ‘Vaccine Sentiment’ report shows the percentage of Australian people intending to get vaccinated or already vaccinated increased from 66 per cent in May, to 70 per cent in June and July, to 84 per cent in October 2021.
The low percentage in May 2021 followed the initial announcement that the AstraZeneca vaccine was no longer available for the population under 50 years old. The increase in October coincided with the Delta strain outbreaks in Victoria and New South Wales.
We do not have access to any sentiment data specifically for Queensland.
The number of doses available to the state and the primary care providers is determined by the Australian Government, and the estimated weekly doses have been stated in the COVID Vaccination Allocations Horizons document prepared by the Australian Government Department of Health.
Figure 5B shows the number of doses administered, overlaid with the total stock ordered by Queensland Health and primary care providers for the period July 2021 to August 2021 and vaccines allocated by the Australian Government from September onwards. The doses administered were limited by availability of stock, especially in the earlier months. However, vaccine uptake has not kept pace with the significant increase in supply since late August 2021.
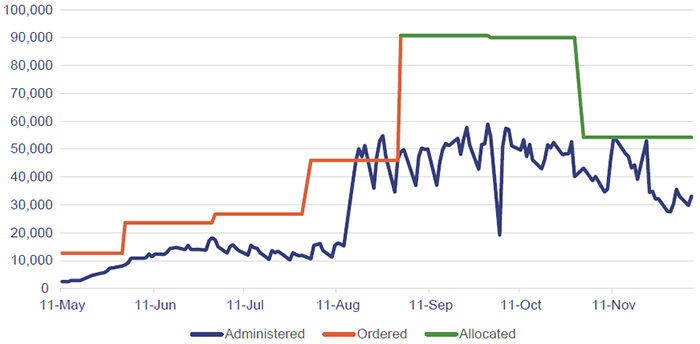
Note: Ordered = total doses delivered to sites. Allocated = total doses available to the sites.
Australian Government Department of Health—Daily report data Monday to Friday between May and December 2021; and Australian Government Department of Health—COVID Vaccination Allocations Horizons report—24 September 2021.
Vaccine doses administered in Queensland
Figure 5C shows the doses administered via Queensland Health and various primary care providers. The state has administered 40 per cent of total doses at 7 December 2021, with the remainder administered by the Australian Government (through the Primary Health Networks, Commonwealth aged care and disability services, and Aboriginal community health centres).
Australian Government Department of Health—Daily report data as at 7 December 2021.
Vaccination rates by location
We have considered the vaccination rates based on the level of remoteness of location within Queensland, compared to the national data for the same levels of remoteness. The Australian Government information excludes some areas that are very remote due to issues with collecting data. The percentage of areas excluded due to this is 1.5 per cent of the total Queensland population.
As can be seen in Figure 5D, the vaccination rates in the Queensland metropolitan areas are ahead of those in regional areas. This is in line with the national data, although we note the rates for inner regional areas in the national data appear to be closer in percentages to the rates for metropolitan areas than in Queensland. This could in part be due to the size of Queensland compared to other states who are further ahead in their vaccine rollout and the fact our regional areas have been largely unaffected by COVID-19 outbreaks.
Areas in Queensland have been divided into five classes of remoteness on the basis of a measure of relative access to services. Metropolitan areas include major cities such as Brisbane, Gold Coast, Sunshine Coast, and Ipswich. Inner regional includes Toowoomba, Bundaberg, Rockhampton, and similar. Outer regional includes Cairns, Townsville, Goondiwindi, and similar.
The Australian Government excluded remote and very remote areas from its data due to issues with locating addresses and linking vaccine data for those individuals.
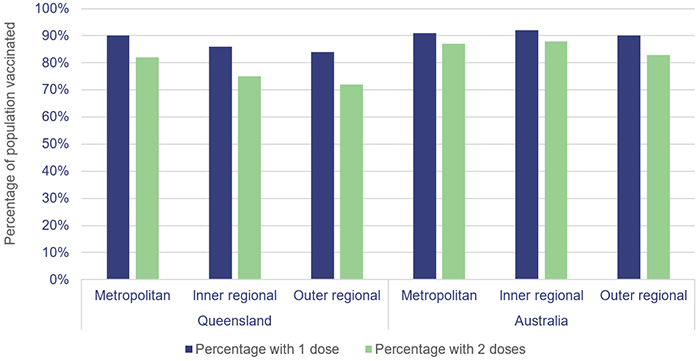
Australian Government Department of Health—Local government authority data as at 5 December 2021.
There are three local government areas in Queensland—Cherbourg, Yarrabah, and Isaac—where the rate for the first dose of the vaccine is less than 70 per cent. Cherbourg and Yarrabah are both Indigenous councils, and both Yarrabah and Isaac are classified as outer regional areas.
Aboriginal and/or Torres Strait Islander peoples
The Australian Government is responsible for leading the rollout to Aboriginal and/or Torres Strait Islander peoples, in collaboration with state and territory governments. Aboriginal and/or Torres Strait Islander peoples were also included in Phase 1B of the rollout, which commenced on 22 March 2021.
As at 7 December 2021, 69 per cent of the Aboriginal and/or Torres Strait Islander peoples in Queensland had received their first dose, which was well below the state average. In two local government areas—Woorabinda and Tablelands—less than 55 per cent have received their first dose. There are a further seven local government areas where their first dose vaccination rates are less than 60 per cent.
Figure 5E shows the vaccine rollout progress for Aboriginal and/or Torres Strait Islander peoples compared to all people in Queensland.
| Group | Percentage with dose 1 | Percentage with dose 2 |
|---|---|---|
| Aboriginal and/or Torres Strait Islander peoples (over the age of 15) | 69.4% | 55.3% |
| Queensland (total) | 87.7% | 79.6% |
Australian Government Department of Health—Daily report data as at 7 December 2021.
To assist Aboriginal and/or Torres Strait Islander peoples in receiving their vaccinations, throughout October and November 2021, HHSs have been providing:
- mobile vaccination vans
- transport to assist people to attend appointments
- door-to-door vaccinations in remote communities
- pop-up clinics at schools and youth centres
- designated First Nation vaccination days at existing clinics.
They have also been providing t-shirts, footballs, food vouchers and other incentives to encourage people to get vaccinated in areas with low vaccination rates. A ‘Make the Choice’ campaign has been rolled out via various media outlets including websites, radio, TV, social media, and events, to educate and advocate for people who may be hesitant to receive their vaccinations.
Vaccine wastage has been minimal to date
Queensland Health records and monitors wastage by HHSs. Since the beginning of the rollout, 7,195 doses have been reported as significant wastage events—5,143 doses of Pfizer and 2,052 doses of AstraZeneca. Wastage as a percentage of doses administered is 0.24 per cent. We do not have wastage data for other Australian jurisdictions.
While vaccine wastage has been minimal to date, the risk from this point forward increases due to supply levels exceeding demand.
Hotel quarantine fees
The Queensland Government announced that, from 17 June 2020, hotel quarantine fees were payable by travellers arriving in the state. As at 30 June 2021, there had been 100,993 stays in hotel quarantine. On average, 19 per cent of applications received for an invoice to be waived were approved for various reasons, including booking prior to the announcement of fees, financial hardship or vulnerability.
In 2020–21, the Department of Health recognised income from quarantine fees totalling $179.4 million. Of this total:
- $82.5 million was yet to be invoiced. As at 30 June 2021, over 25,000 quarantine invoices had not been processed, due in part to a lack of staff within the section processing these invoices and the time required to validate the traveller information. The Department of Health is currently working to obtain additional staff resources to help clear the backlog of invoice processing
- the department recognised $54.5 million for doubtful debts relating to hotel quarantine fees accounted for during 2020–21. This includes $21.4 million the department estimated may not be recoverable and may have to be written off from the quarantine revenue yet to be invoiced ($82.5 million).
The department recognised associated expenses of $118 million in its 2020–21 financial statements representing the cost of the hotel quarantine program. The surplus from quarantine fees and costs is used to support the broader COVID-19 response such as fever clinics, procurement of protective personal equipment, health service provision at hospitals, and the vaccine rollout.
Not included is the full cost of the administration burden on Queensland Health to manage the hotel quarantine system and payroll expenditure for Queensland Health employees working within the system.
Queensland Health could focus on health service delivery and work with other government entities for pursuing outstanding debt. Other entities, such as Queensland Treasury’s State Penalties Enforcement Registry unit, are better placed to handle debt recovery, and other government entities are not under as much pressure from the pandemic as Queensland Health.
There would be value in the Department of Health arranging for another entity to take responsibility for pursuing recovery of debts associated with hotel quarantine.
Recommendation for Department of HealthThe Department of Health should arrange for another entity to manage hotel quarantine debts The Department of Health should pass the invoicing and hotel quarantine debt recovery functions to another government entity that is better suited to invoicing and debt recovery, and is not as affected by COVID-19. This will allow the department to focus on the provision of health care. |
2021 hospital and health service dashboard
Find your local hospital and health service (HHS) in this Queensland Audit Office visualisation to explore its financial audit data for 2021 and compare to other hospital and health services. This interactive tool includes data on revenue, expenses, assets, liabilities and activity measures.