
Overview
Amid the growing demand for health services, the continuing challenges of COVID-19, and workforce pressures, Queensland’s health sector entities work to provide accessible healthcare and support the wellbeing of our communities.
Tabled 1 March 2023.
Acknowledgement of commitment of Queensland public health system staff
We wish to acknowledge and thank the dedicated staff working in Queensland’s health and ambulance services during this difficult time. As we have noted in the body of this report, the Queensland public health system is under increasing pressure, with a growing and ageing population. Frontline health and ambulance service staff have continued to demonstrate their professionalism during the COVID-19 public health emergency period, despite the heavy burden placed upon them.

Report on a page
This report discusses the audit results of Queensland Health entities, which include the Department of Health (the department) and 16 hospital and health services (HHSs). It also summarises the audit results for 13 hospital foundations, 4 other statutory bodies, and 4 controlled entities.
Financial statements are reliable and internal controls are effective
The financial reports prepared by Queensland Health entities, hospital foundations, and the other statutory bodies are reliable and comply with relevant laws and accounting standards. All the HHSs’ annual reports were tabled on the statutory deadline of 30 September, which is an improvement in timeliness. However, there is still room to improve by progressively tabling annual reports as they are provided to the minister, instead of waiting for all annual reports in the portfolio to be tabled at the same time.
Internal controls are generally effective, though we identified some deficiencies in information systems controls. We have made recommendations to strengthen the security over information systems.
Sustainability has improved with guaranteed funding
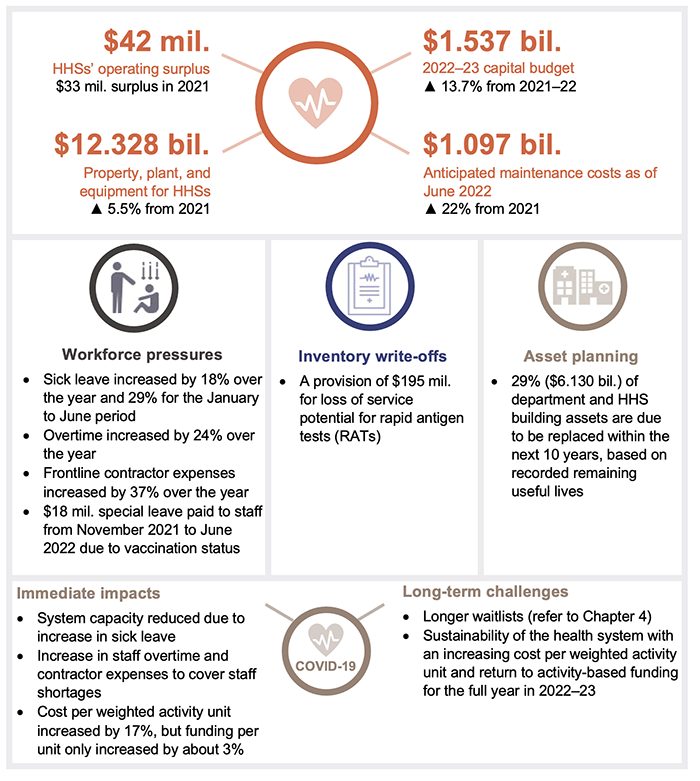
The short-term financial position of the sector improved in 2021–22, with the HHSs having a combined operating surplus of $42 million (2020–21: $33 million). This was partly due to the Australian Government extending its minimum hospital funding guarantee in 2021–22, in recognition of the impact of COVID-19 on activity levels. HHSs also had access to the National Partnership Agreement (NPA) funding for the pandemic, which reduced the impact of COVID-19 financial pressures.
After 2 years of a minimum funding guarantee and access to NPA COVID-19 funding, 2022–23 will be a challenging one for HHSs with an increased likelihood of HHSs reporting operating deficits as they return to a funding model based on delivering against activity targets.
During 2021–22, there were large increases across all HHSs and the department in staff sick leave and overtime, and most HHSs also recorded an increase in frontline contractor expenses due to system capacity issues. The total amount of unused staff recreation leave is increasing. This indicates that the HHSs’ workforce is under significant pressure.
As of 30 June 2022, the department and HHSs reported total anticipated asset maintenance of $1.1 billion. This is a 22 per cent increase from the prior year ($901 million). Anticipated maintenance is an indicator of maintenance that should be performed and has been postponed. A reactive maintenance approach can increase costs over the long term due to the deterioration of assets (reducing their service life), reduced asset performance and the increased costs to keep buildings in their expected condition.
Reduced capacity in the health system to meet demand
In 2021–22, the total number of long waits for specialist outpatient services increased by 80 per cent to around 104,000 patients. This is significantly higher than the number of patients waiting to see a specialist before the department implemented its Specialist Outpatient Strategy from 1 July 2015.
The Queensland Ambulance Service (QAS) (which is part of the department) is facing growing demand for all its services, including the most urgent. The time it takes ambulance crews to transfer patients into the care of emergency departments increased significantly in 2021–22. If patient transfer takes longer than 30 minutes, the extra time is considered ‘lost’ time for QAS. In 2021–22, QAS lost approximately 134,155 hours – a 20 per cent increase compared to 2020–21.
Recommendations for entities
We have made one recommendation for the Department of Health and the 16 hospital and health services (HHSs) relating to deficiencies we identified for non-removal of network access from terminated employees, weak password controls, and a weakness in control over a default administrator account.
The department is progressing an identity and access management project to automate the removal of system access when employment ends.
Strengthening of information system and cyber security controls |
|
| REC 1 |
The 16 HHSs should:
The Department of Health should:
|
Status of recommendations made in Health 2021
(Report 12: 2021–22)
Health entities have continued to strengthen controls over procurement and contracting, however not all entities have established central contract registers. Central contract registers are important to ensure entities have a complete record of their contracts and to support timely publication of awarded contracts valued at $10,000 and over, as required by the Queensland Procurement Policy and in accordance with the Procurement Guidelines: Contract Disclosure.
With the cessation of hotel quarantine requirements for travellers during 2021–22, we consider our prior recommendation relating to the management of hotel quarantine debt is resolved.
Details of the status of recommendations in Health 2021 and Health 2020 are included in Appendix D.
Reference to comments
In accordance with s. 64 of the Auditor-General Act 2009, we provided a copy of this report to relevant entities. In reaching our conclusions, we considered their views and represented them to the extent we deemed relevant and warranted. Any formal responses from the entities are at Appendix A.
1. Overview of entities in this sector
Queensland Audit Office.
2. Results of our audits
This chapter provides an overview of our audit opinions for entities in the health sector. It also provides conclusions on the effectiveness of the systems and processes (internal controls) entities use to prepare financial statements.
Chapter snapshot
Financial statements are reliable
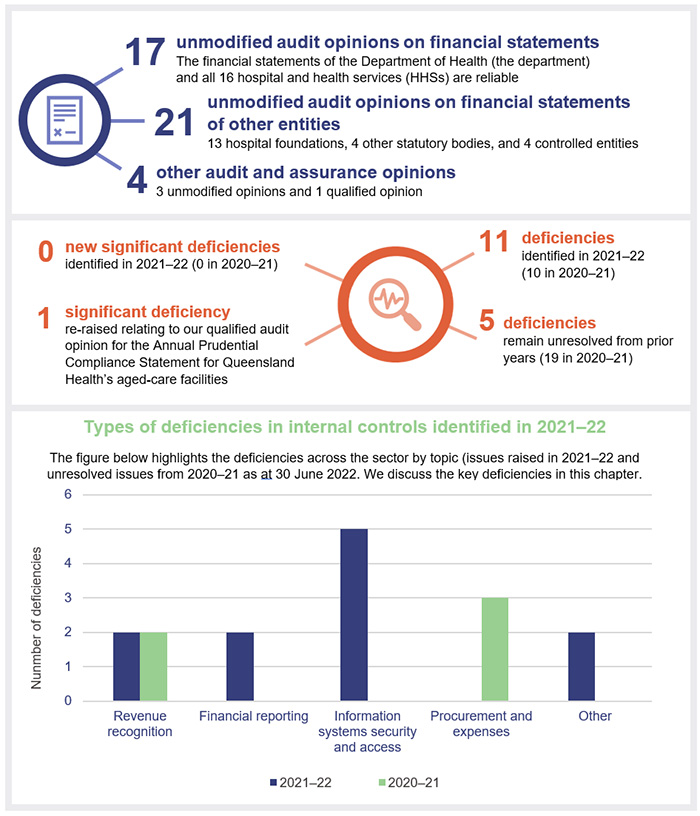
We issued unmodified audit opinions for all entities in the Queensland health sector, including the department, the 16 HHSs, the 13 hospital foundations, 4 other statutory bodies, and 4 controlled entities. This means the results in their financial statements can be relied upon. Appendix E provides detail about the audit opinions we issued for 38 entities in 2022.
Annual reports were tabled by the legislative deadline, but there is room to improve
The timely publication of annual reports, which include audited financial statements, enables parliament and the public to meaningfully assess the financial performance of public sector entities. Queensland legislation requires ministers to table their portfolio entities’ annual reports in parliament within 3 months of the end of the financial year – by 30 September. The annual reports for entities in the health portfolio were all tabled on 30 September 2022. This is an improvement from recent years, when only the department’s annual report was tabled by 30 September and the minister extended the legislative deadline for all other entities in the health portfolio.
However, there is still room to improve. In State entities 2021 (Report 14: 2021–22), we recommended that departments and their ministers should explore opportunities for releasing the audited financial statements of public sector entities in a more timely way.
Other audit and assurance opinions
Appendix F lists the other audit and assurance opinions we issued.
We issued a qualified audit opinion for the Annual Prudential Compliance Statement for Queensland Health’s aged-care facilities. In this statement, Queensland Health is required to outline to the Australian Government how it has managed refundable accommodation deposits, accommodation bonds, and entry contributions from aged-care residents. We qualified our audit opinion because of 2 non-compliance issues, related to the completion of accommodation agreements with residents and refunds not being provided within the legislated time frames.
Entities not preparing financial statements
Not all entities in the health sector produce financial statements. Appendix G lists the entities not preparing financial statements and the reasons why.
Internal controls are generally effective
We assess whether the internal controls entities use to prepare financial statements are reliable. We report to management any deficiencies in the design or operation of those internal controls. Those rated as deficiencies are of lower risk and can be corrected over time. Those rated as significant deficiencies are of higher risk and require immediate action by management.
Overall, to the extent that we tested them, we found the internal controls that health sector entities have in place to ensure reliable financial reporting are generally effective but can be improved. For the second year in a row, we identified no significant deficiencies in relation to financial statement systems and processes. We did, however, identify 13 new deficiencies in the current financial year, of which 2 were assessed as resolved by the time of our final audits.
Queensland Health entities (the department and 16 HHSs) have strengthened their internal controls by resolving most long-outstanding issues. In 2021–22, 12 (71 per cent) of 17 remaining issues raised in prior years (2018 to 2021) were resolved.
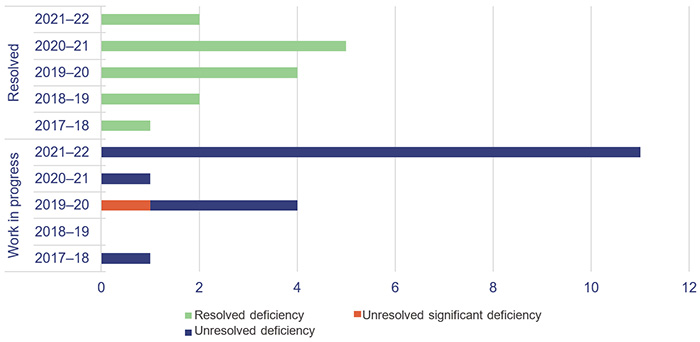
At present, there is one significant deficiency and 16 deficiencies that remain outstanding – 5 from prior years and 11 from this year. The outstanding significant deficiency relates to our audit of the aged-care Annual Prudential Compliance Statement, which was qualified in 2020–21 and again in 2021–22.
Figure 2A shows the current status of the internal control deficiencies we have raised from 1 July 2017 that were unresolved as of 1 July 2022. All issues from 2017 and prior are resolved.
Queensland Audit Office.
Information systems controls and cyber security
Weaknesses in information systems controls and risks to cyber security continue to persist. We identified deficiencies relating to non-removal of network access from terminated employees, weak network password controls, and weakness in control over a default administrator account.
Access to information system resources and user management are jointly managed by the department and each HHS. The department manages the network and provides a dashboard of active users to each HHS for its review. Each HHS is responsible for approving access to the network and notifying the department when access is no longer required. This can be a time-intensive task due to the many position changes that occur daily. The department is progressing an identity and access management project to automate the removal of system access when employment ends.
|
Recommendation for the Department of Health and 16 HHSs Strengthening of information system and cyber security controls |
|
The 16 HHSs should:
The Department of Health should:
|
Tools to assess the strength of internal controls
We are developing new assessment tools for internal controls relevant to public sector entities. They will provide entities with greater insights into the strength of their internal control processes. These tools focus on asset management, change management, culture, governance, grants management, information systems, monitoring, procure-to-pay (the whole procurement process), and risk management.
We are currently consulting with our clients on these tools and intend to begin using them in our audits from 2022–23.
Our rotational focus on internal controls for Queensland Health entities will include an assessment of asset management in 2023–24. Our reporting on control deficiencies will not change.
3. Financial performance and sustainability
This chapter analyses the financial performance and position of health sector entities. We consider both financial sustainability and emerging issues relevant to the sector.
Chapter snapshot
Operating results were supported by COVID-19 funding
The combined operating result (the difference between revenue and expenses) of the HHSs in 2021–22 was a $42 million surplus (2020–21: $33 million surplus). Nine of the 16 HHSs reported an operating surplus, and 7 reported an operating deficit (2020–21: 2 HHSs reported a deficit). The 2021–22 state budget had only one HHS budgeted to make a deficit for the year – Sunshine Coast HHS. The other 15 HHSs were budgeted to achieve a zero operating result for the year.
Figure 3A shows the HHS operating results grouped by region.
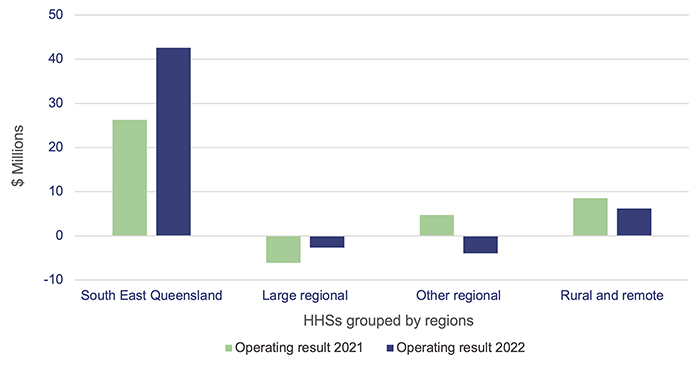
Note: Appendix B shows how the HHSs are grouped into regions. See Appendix H for individual HHS financial results.
Hospital and health service financial statements, 2020–21 and 2021–22.
The 4 main funding sources for HHSs are:
- Commonwealth funding – revenue received from the Australian Government for public health services
- state funding – revenue received from the Queensland Government for public health services
- grants and contributions – include specific purpose grants, such as nursing home and home support programme grants, and contributions, such as corporate support services received from the department
- own-source revenue – revenue that HHSs generate through the sale of goods and services. This includes user charges such as billing private patients for hospital services, reimbursements from the Commonwealth for medicines listed on the Pharmaceutical Benefits Scheme and other non-patient revenue such as retail proceeds.
Service agreements are negotiated between Queensland Health and each HHS. The agreements set out the services the Department of Health purchases from each HHS and the amount it pays for those services. Funding is based on the number of patients, number of services, and complexity of services provided, referred to as activity-based funding (ABF). Thirteen of the HHSs are funded according to ABF, creating a direct link between their activities and the level of funding that they are entitled to. The remaining 3 HHSs are rural and remote HHSs. Because of their smaller size, they receive block funding (which means they are funded for services outside the scope of ABF), but they still have activity targets they have to meet.
Under the service agreements, Queensland Health and HHSs measure service activity using Queensland weighted activity units (QWAUs), which measure the resources used while providing a service.
In 2021–22, the HHSs were funded for $5,030 per QWAU (2020–21: $4,895), with the average cost of delivering a QWAU $5,984 (2020–21: $5,108). For all HHSs, the QWAU cost exceeded the funded QWAU rate. The gap between approved funding per QWAU and average cost per QWAU delivered has grown. None of the HHSs were able to reduce their costs to narrow this gap in 2021–22.
The cost per QWAU increased by 17.2 per cent this year. The increase in cost per QWAU is due to the combined impact of higher costs at HHSs, and delivered activity falling. Overall, the HHSs delivered 6 per cent less QWAUs compared to last year.
The HHSs’ inability to deliver on their planned activity was mainly due to the impacts of the COVID-19 pandemic resulting in temporary suspensions and deferrals of planned services and system capacity issues caused by staff sick and special leave, including quarantining as a close contact and staff stood down due to their vaccination status. This is despite total full-time equivalent employee numbers for the 16 HHSs increasing over the last 3 years by 7,111 full-time equivalent staff, from 78,193 at 30 June 2019 to 85,304 at 30 June 2022 (a 9.1 per cent increase).
HHSs continue to incur significant staff costs, even where planned activity has not been able to be delivered. HHSs have discretion to respond to service demands and to try to catch-up on previously planned activity that was unable to be delivered. This may include extending operating hours, which may result in additional costs.
Despite activity being less than planned, and the growing gap between QWAU funding levels and costs, HHSs were able to report a combined net surplus for 2021–22, largely due to COVID-19 funding and the extension of minimum funding guarantees. The Australian Government announced in November 2021 that it would extend the minimum hospital funding guarantee for an additional year (to 30 June 2022) in recognition of the significant impact that COVID-19 was having on hospitals. The Queensland Government also provided a partial minimum funding guarantee covering January 2022 to June 2022, to cover the disruption caused by the Omicron outbreaks. This meant that HHSs operating under the ABF model received a minimum level of funding irrespective of their level of activity delivered.
For 2022–23, there is an increased likelihood of HHSs reporting operating deficits. This is because of the ongoing pandemic restricting delivery of planned services, particularly during the COVID-19 spike in July 2022, and the end of the minimum funding guarantees from the Australian and Queensland governments. Queensland Health monitors HHSs’ activity levels and, where HHSs do not meet targets, the department can withdraw or claw back funding.
Workforce pressures
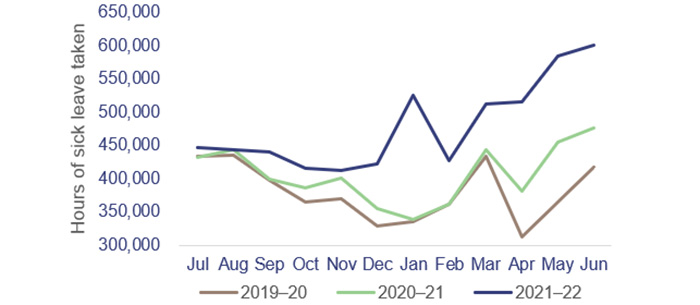
The COVID-19 Omicron waves in 2021–22 and the standing down of unvaccinated staff had a significant impact on Queensland Health’s workforce. From January to June 2022, high levels of sick leave reflected the number of staff or their close contacts who were unwell or needed to isolate. This, in turn, resulted in higher costs as HHSs needed to backfill staff. In addition, there were higher costs when health staff continued to be paid because they were available to work but unable to do so because COVID-19 pressures prevented the delivery of other activities such as non-urgent surgeries. In these situations, activity was not delivered (to generate activity-based revenue) due to lack of capacity within the hospitals, but the associated salary expenses were incurred.
Figure 3B compares health staff sick leave levels per month over the last 3 financial years.
|
The total number of sick leave hours taken across the health workforce increased by 29% over the January to June period compared from 2021 to 2022, and increased by 42% over the same period from 2020 to 2022. The total number of hours of sick leave taken increased by 18% from 2020–21 to 2021–22 and increased by 26% from 2019–20 to 2021–22. |
Queensland Audit Office, from Department of Health data.
To help alleviate some of the pressures and address waiting times, there was an increased reliance on private hospitals. Payments to private hospitals from the department and HHSs increased from $182.8 million in 2020–21 to $266.2 million in 2021–22. The increases were most evident between January and June 2022.
These increased payments to private hospitals exclude existing contractual arrangements between Queensland Health and Mater hospitals. Queensland Health’s funding for health services from Mater hospitals increased from $516.3 million to $544.2 million in 2021–22, an increase of 5.4 per cent.
Increasing leave balances
Recreation leave balances (total hours) increased by 4 per cent in 2021–22, and all 16 HHSs had an increase in average recreation leave balance in 2021–22 (for staff employed for the full 2021–22 financial year). This indicates there has been an impact on the ability of health staff to take leave, likely due to the diversions of COVID-19 and the overall increase in demand for health services.
Figure 3C shows the consistent increase in the average recreation leave hours for staff for each HHS.
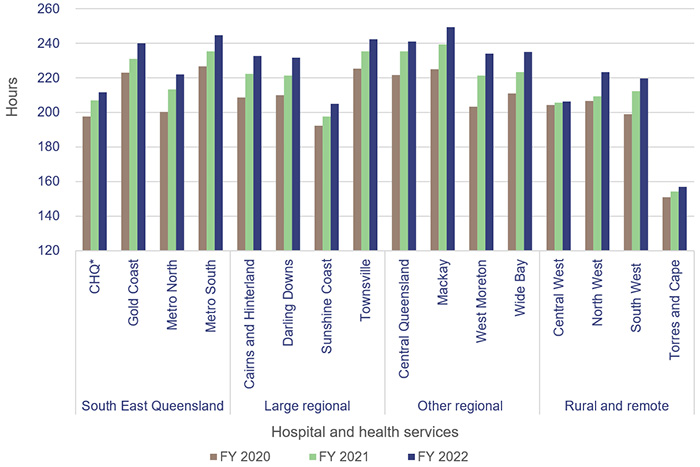
Note: *CHQ – Children’s Health Queensland Hospital and Health Service.
Recreation leave balances have been included for staff who were employed from 1 July to 30 June of that financial year.
Queensland Audit Office, from Department of Health data.
Increasing employee expenses
Increasing employee expenses are mostly responsible for the increasing cost per QWAU in HHSs. In 2021–22, employee expenses increased by 6.8 per cent to $12.258 billion. This increase is mostly due to a combination of higher staff wages and an increase in the number of full-time equivalent staff (2.6 per cent increase from 30 June 2021 to 30 June 2022). Employee expenses make up 68 per cent of total HHS expenses.
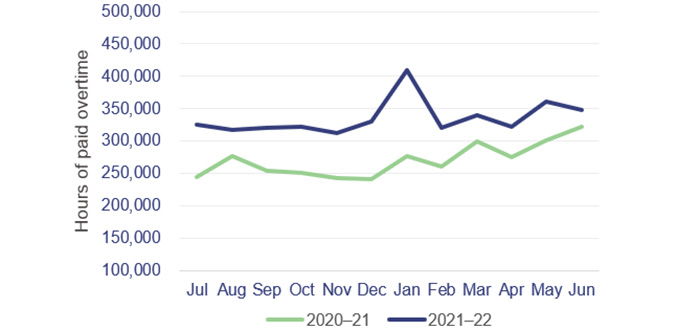
Increase in overtime
Figure 3D shows that overtime hours worked increased by 24 per cent in 2021–22. The health workforce was under increased stress as it faced consistent challenges from COVID-19 related disruptions.
|
From December 2021, there was a significant increase in overtime hours worked. Staff worked overtime to compensate for staff absences and due to the general demand on the system from the COVID-19 Omicron wave. |
Queensland Audit Office, from Department of Health data.
Standing down of unvaccinated staff
On 11 September 2021, the Queensland Government implemented a health employment directive in response to the growing concern about COVID-19. The directive required all health service employees to be vaccinated as a condition of employment by 31 October 2021.
Staff who were stood down from service due to not being vaccinated were able to access paid special leave while their employment contracts and requests for exemptions were assessed. The department has advised that a total of 1,700 employees accessed special leave types associated with the health employment directive between November 2021 and June 2022, at an approximate cost of $18 million. Of these 1,700 employees, 593 are no longer employed; however, reasons for ceasing employment may include factors other than vaccination status.
While these costs and staff numbers are not significant in terms of Queensland Health’s entire workforce, a more agile public service could have reallocated these staff to other public sector entities that needed them rather than keeping them on its payroll while on suspension. In Report 6: 2022–23 Managing workforce agility in the Queensland public sector, we stated that ’To become a more dynamic and responsive organisation, the public sector needs flexible work practices that meet both organisational and employee needs, including ways of moving employees more easily across the sector.’
This issue also created significant administrative burden for the department and HHSs in assessing the claims of staff seeking a vaccination exemption.
Special leave granted in recognition of response to COVID-19
In November 2020, the Queensland Government announced 2 days of pandemic leave for health staff in recognition of the effects of COVID-19 on staff wellbeing. This leave is separate from an employee’s existing leave entitlements and must be taken before March 2023.
As at 30 June 2022, 19 per cent of staff had not taken any of their pandemic leave (49 per cent in 2020–21). This, combined with increasing recreation leave balances, suggests the health workforce has been under pressure and is finding it difficult to take leave.
Impact of COVID-19 and related costs
We estimate that COVID-19 related costs for the Queensland Health entities exceeded $1.374 billion in 2021–22. Our estimate is based on COVID-19 funding included in the original 2021–22 Queensland Health budget, and disclosures of additional COVID-19 related funding received in the department’s and the HHSs’ 2021–22 financial statements.
HHSs received funding as reimbursement to offset eligible expenses associated with managing the COVID-19 pandemic, including vaccination programs and diagnosis and treatment of COVID-19 patients. They disclosed additional funding of $840 million in their 2021–22 financial statements.
The Queensland Health 2021–22 financial statements disclosed additional funding received during the year for rapid antigen tests ($196.9 million) and other general COVID-19 funding ($169.5 million).
The Australian and Queensland governments jointly funded the HHSs for direct COVID-19 related costs. The bulk of funding was provided under the financial arrangements established in the National Partnership Agreement on COVID-19 Response. Under that agreement, the Australian Government provided a 50 per cent contribution towards costs incurred for the diagnosis and treatment of COVID-19 and a 50 per cent contribution towards other COVID-19 activity that public health entities undertook for the management of the outbreak. The state government funded the remaining 50 per cent and also reimbursed HHSs for certain other COVID-19 related costs, such as additional expenses for backfilling staff stood down for not being vaccinated.
Inventory and rapid antigen test write-off
Queensland Health increased its inventory holdings of medical supplies and drugs during the COVID-19 pandemic, from $220.6 million to $426.4 million, to mitigate the risks of global supply shortages. This increase included procurement of RATs on behalf of all Queensland Government agencies to:
- avoid internal competition
- simplify commercial negotiations
- ensure only appropriately certified products were purchased
- maximise cost recovery from the Australian Government under the National Partnership Agreement.
To comply with accounting standards, the department is required to assess its inventory holdings to ensure the value reported (usually the cost price) is not more than the estimated sale value. Where inventories are unlikely to be used prior to their expiry dates, the value must be written down.
The department increased the amount it expected to lose from obsolete inventory to $267.3 million ($44.9 million in 2020–21). This included an allowance of $195 million for obsolete RATs. This was because the current expiry dates of RATs ranged between January 2023 and June 2024 and the department had seen a significant reduction in demand. Queensland Health procured a large supply of RATs, based on the expectation they would be required by students and teachers at schools. However, government strategy changed to only require RATs in schools for teachers and students who develop COVID-19 symptoms.
Queensland Health has investigated options for using the RATs to maximise benefits prior to their expiry dates. On 1 August 2022, Queensland (along with all other states) assumed responsibility for the RAT concession card scheme from the Commonwealth (formerly dispensed through pharmacies). Through this scheme, RATs are made available to concession card holders; the department has broadened the scheme to include other vulnerable groups in the community.
Contracting additional staff
In 2021–22, Queensland Health recorded a 37 per cent increase in costs for frontline contractor staff (an increase of $80.7 million). This was due to the continued increase in demand, the unavailability of staff due to sick leave from COVID-19, and additional COVID-19 expenditure (such as staffing vaccination centres, locum medical staff, and emergency responses).
Most of the expenditure increase was incurred by the larger HHSs in the South East Queensland region.
Figure 3E shows the frontline contractor expenditure across the HHS regions.
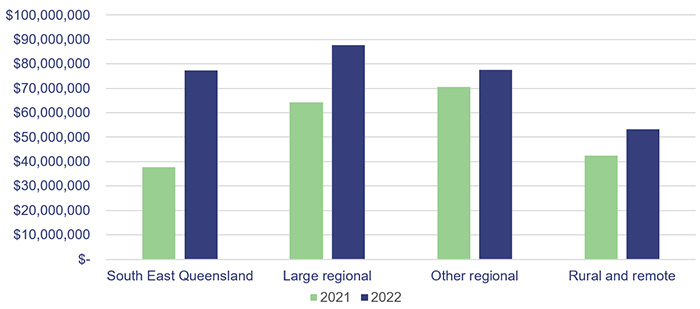
Queensland Audit Office.
Future capital requirements to meet changing service delivery needs
Effective asset management is critical to the efficient provision of health and ambulance services. It includes planning for future requirements, managing existing assets, and investing in new assets. To achieve optimal outcomes, there needs to be a close relationship between management and maintenance of existing assets and construction of new assets.
Future capital requirements
Queensland has 20.5 per cent of Australia’s population. The state’s population has been growing steadily and, in 2022, it had the highest growth of any state or territory in Australia (as shown in Figure 3F). This will place additional pressure on the health system and the services it needs to deliver.
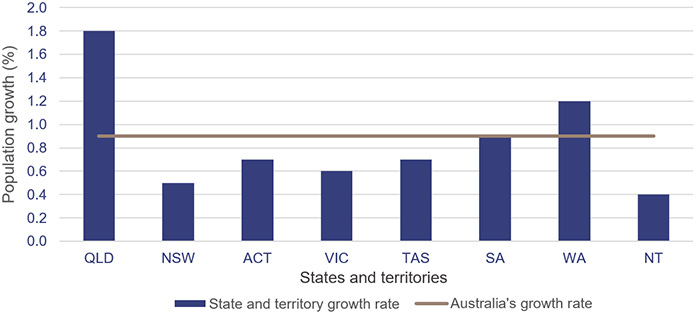
Note: QLD – Queensland; NSW – New South Wales; ACT – Australian Capital Territory; VIC – Victoria; TAS – Tasmania; SA – South Australia; WA – Western Australia; NT – Northern Territory.
Population estimates: States and territories – Queensland Government Statistician’s Office.
In addition to the demand pressures of a growing and ageing population, the sector needs to plan to replace ageing health infrastructure. For the 2021–22 capital program, the expenditure target was $1.346 billion (excluding the allocation to the Council of the Queensland Institute of Medical Research). Actual capital expenditure of $1.074 billion was achieved in 2021–22, which is 80 per cent of the budgeted target. The remaining $272 million allocated was unspent due to supply chain impacts, workforce reductions due to COVID-19, and natural disasters during the year.
As shown in Figure 3G, approximately 29 per cent ($6.13 billion) of buildings currently owned by the department and HHSs are due to be replaced within the next 10 years, based on their recorded remaining useful lives. The following analysis represents the buildings owned by the department and HHSs, by their expected replacement year.
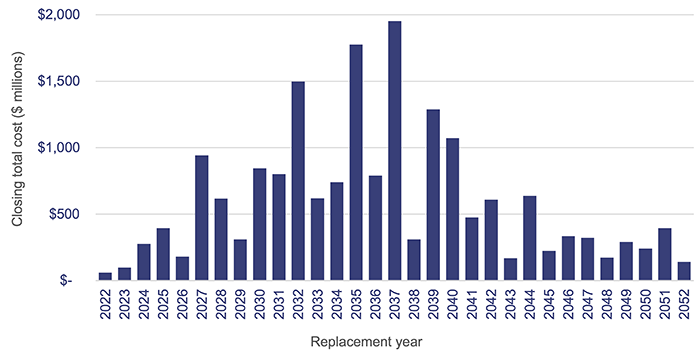
Department of Health and HHS asset registers 2022.
To address the growing demand on public health services, the 2022–23 state budget committed $1.537 billion funding for health infrastructure, capital works, and purchases, including capital funding for hospitals, ambulance stations and vehicles, staff accommodation, health technology, and information and communication technology. The budget identified the Queensland Health Capacity Expansion Program to deliver 2,200 additional beds over 6 years, including 3 new hospitals and expansions of existing hospitals.
The sector will face challenges in achieving the desired outcomes from the capital investment program, with current market conditions placing considerable pressure on costs and shortages in materials and labour creating risks around timing.
Related operational costs will need to be included in future budgets to ensure these assets can be effectively and efficiently used.
We have identified infrastructure investment in our Forward work plan 2022–25 as one of the focus areas for our future performance audits. Effective asset management and investment are critical to long-term financial sustainability. We encourage public sector entities with large infrastructure assets to consider any recommendations contained in our related performance audit reports.
Anticipated maintenance
HHSs continue to face significant challenges in funding the anticipated maintenance of their assets.
Anticipated maintenance is defined as maintenance that is necessary to prevent the deterioration of an asset or its function, but which has not yet been carried out.
Anticipated maintenance is a common building maintenance strategy used by public and private sector industries. The Queensland Government Maintenance Management Framework requires the reporting of anticipated maintenance. All Queensland Health entities comply with this requirement.
The department has a service level agreement with the HHSs, which states that a minimum of 2.81 per cent of each HHS’s building portfolio is required to be spent annually on maintenance to sustain the building assets and achieve expected life cycles. The 2.81 per cent is comprised of 1.56 per cent capital maintenance/sustaining capital (largely funded by the department, following planning and application by HHSs) and 1.25 per cent operational repairs and maintenance expenditure (funded by HHSs). While newer buildings may not require this level of maintenance, older buildings require more; on average, the 2.81 per cent reflects what is expected at a portfolio level.
The current cost of anticipated maintenance across the HHSs as at 30 June 2022 was $1.097 billion, an increase of $196 million from 2021.
Figure 3H shows the growth in 30 June balances for anticipated maintenance for the last 4 financial years for each HHS region.
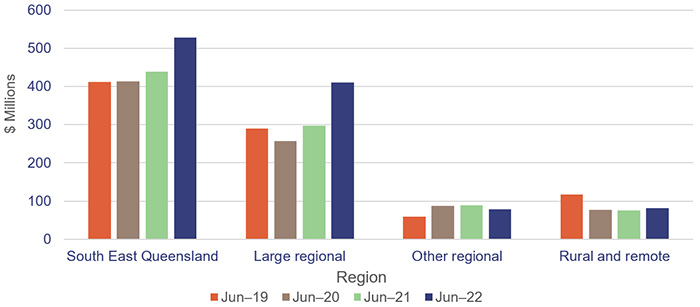
Queensland Audit Office from the HHSs’ annual reports.
All 17 entities should continue work on addressing Recommendation 5 from our report Health 2020 (Report 12: 2020–21), which was to prioritise high-risk maintenance.
Most HHSs increased their repairs and maintenance expenditure in 2021–22. Much of this increase can be attributed to cost escalations due to supply chain issues, cost increases in construction material, labour supply shortages, and impacts from natural disasters. From 2020–21 to 2021–22, there was an 8.09 per cent increase in repairs and maintenance expenditure across all HHSs. However, given the growth in anticipated maintenance over the same period, HHSs may not have completed all the expected maintenance works despite spending more due to rising costs. There is a risk that assets which do not receive required maintenance will deteriorate and increase the costs required to keep buildings in their expected condition.
Figure 3I shows the actual expenditure on maintenance and repairs for each HHS between 2020–21 and 2021–22.
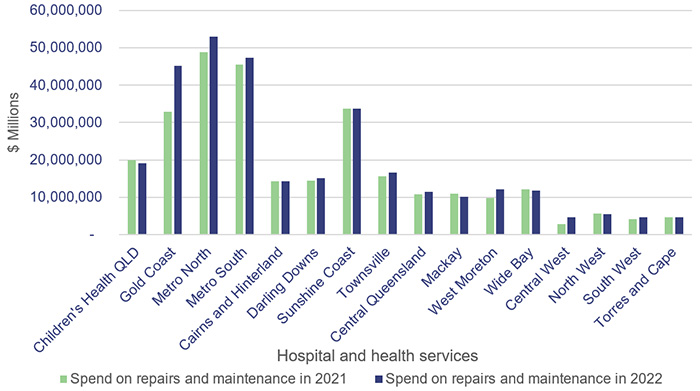
Queensland Audit Office.
Assessment of asset valuation
Each year the department and HHSs update the fair value of their buildings to represent how much it would cost to replace these buildings at today’s prices. This enables them to better budget for how much they will need to spend to replace the buildings in future years. This year, buildings increased in value by $796 million (or approximately 8 per cent), compared to an increase of $157 million in the prior year. The large increases were due to the growth in construction costs and uncertainty in labour supply experienced in the building sector. The large increase in valuations indicates that the costs of constructing new buildings will be significantly higher than in the past, creating significant budget challenges. Alternative and innovative approaches to delivery of health services, requiring less dependence on physical buildings, is likely to grow, for example telehealth and use of remote health monitoring technologies.
4. Demand for health services
In the previous chapter, we discussed workforce pressures that reduced the capacity of the health system to address demand pressures. In this chapter, we:
- show how these workforce pressures impacted waitlist times for specialist outpatients and ambulance response
- provide an update on analysis we performed in 2 previous reports
- Improving access to specialist outpatient services (Report 8: 2021–22), where we reported that Queensland’s growing and ageing population was increasing demand pressures on the public health system in a time of significant fiscal constraints. As a result, some patients were waiting longer than they should for a specialist outpatient appointment
- Health 2021 (Report 12: 2021–22), where we analysed and provided insights on the root causes affecting ambulance response times.
We have obtained data from the Department of Health to update some of the key graphs from our specialist outpatients report (Report 8: 2021–22) and the ambulance services section of our previous health report (Report 12: 2021–22). We have also obtained data to show presentations to emergency departments. We have not audited the completeness and accuracy of this data.
Chapter snapshot (key demand measures 2021–22)
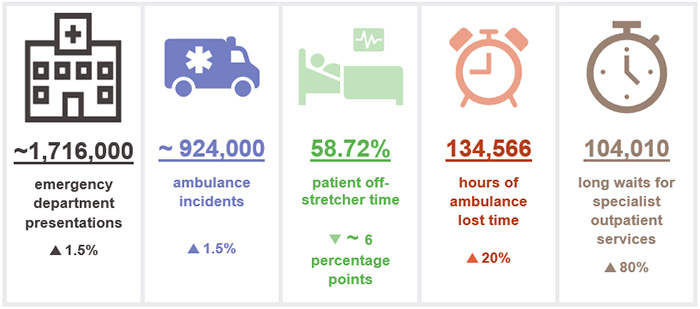
Notes: The increase/decrease in numbers in this snapshot show the variation between the 2021–22 and 2020–21 financial years. Lost time, patient off-stretcher time (POST) and emergency department presentations figures are reported against Queensland’s top 26 reporting hospitals (refer to Appendix I). Lost time and POST data include priority codes 1 and 2 (emergency and urgent cases). ~ means approximately.
Factors increasing demand for services
Several factors continue to increase the demand for health services, including:
- Queensland’s population growth – as noted in the previous chapter, Queensland has the fastest population growth of all states and territories. According to the 2021 Census, Queensland’s population has reached 5.15 million and is projected to increase to over 6.22 million in 2036 (a 21 per cent increase)
- an ageing population – according to the 2021 Census, the population aged 65 years and older has grown by 53.9 per cent from 2011 to 2021. In 2021, 17 per cent (875,603) of the population was aged 65 years and older, and it is expected to increase to over 1.3 million by 2036 (a 49 per cent increase)
- an increase in the complexity of emergency presentations and mental health conditions – according to the 2021 Census, 1.5 million Queenslanders have one or more long-term health conditions (about 29 per cent of the population) and 11 per cent of people aged 15 years and older (471,055) have a mental health condition.
Figure 4A shows the cumulative annual growth in ambulance incidents and emergency department (ED) presentations at the top 26 reporting hospitals over the last 5 years compared to Queensland’s population growth and ageing population over the same period.
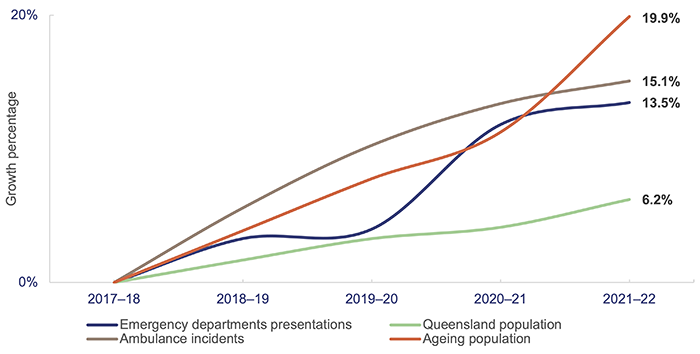
Note: Ageing population refers to the population aged 65 years and older.
Emergency department presentations: Queensland Audit Office from the Queensland Health – System Performance Branch for the top 26 reporting hospitals. Ambulance incidents: Queensland Audit Office from data received from QAS system for the top 26 reporting hospitals. Queensland population: quarterly Australian Bureau of Statistics population data. Ageing population: Queensland Audit Office from 2020 Chief Health Officer report and 2021 Census.
In addition, in 2021–22 the Omicron waves of COVID-19 added further pressure to Queensland Health’s capacity to ensure patients waiting for a specialist outpatient service were seen within the clinically recommended times. COVID-19 also added pressure to ambulance response times.
Emergency department presentations
Demand for EDs continues to grow and more people are arriving at EDs with complex issues. From 2020–21 to 2021–22, the number of ED presentations at the top 26 reporting hospitals increased by 1.5 per cent, and over the last 5 years the growth in presentations was 13.5 per cent. Figure 4B shows the number of ED presentations at the top 26 reporting hospitals over the last 5 years.
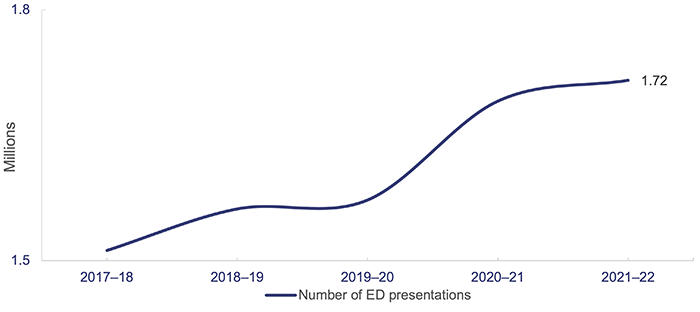
Note: 2019–20, 2020–21 and 2021–22 data excludes fever clinic (COVID-19 tests) presentations.
Queensland Audit Office from the Queensland Health – SPB reporting.
Emergency triage categories 1 to 3 have increased by 3.6 per cent from 2020–21 to 2021–22. EDs are taking more time to treat patients due to the complexity of presentations.
Emergency triage categories:
- Category 1: immediately life-threatening patients
- Category 2: imminently life-threatening patients
- Category 3: potentially life-threatening patients
Ambulance services
The Queensland Ambulance Service (QAS) (which is part of the department) delivers ambulance services from 302 response locations across Queensland. Statewide ambulance services are coordinated through 8 operations centres that are responsible for taking emergency calls, deploying and dispatching vehicles, and coordinating non-urgent patient transport services.
During 2021–22, QAS continued to be directly impacted by increasing demand for health services and the COVID-19 pandemic.
In Health 2021 (Report 12: 2021–22), we provided insights about the root causes affecting ambulance response times. At that time, Queensland Health expected that making more beds available through the Care4Qld strategy would help to ease pressure on ambulance response times (the strategy was announced in May 2021, and aimed to improve access to emergency services and unplanned care).
In this section, we provide an updated analysis of the demand for ambulance services and Queensland Health’s performance against:
- response times (time from when a call to triple zero is answered to when an ambulance arrives at the scene of an emergency)
- patient off-stretcher time (POST) measures (the percentage of patients transferred to the care of an emergency department within 30 minutes)
- ambulance lost time (measured as the amount of time greater than 30 minutes that a patient remains on QAS stretchers).
We also include an update on the outcomes of implementing the Care4Qld strategy and its impact on ambulance response times.
Demand for ambulance services keeps increasing
The demand for ambulance services has grown significantly in the last 5 years, particularly for more complex and higher-priority cases. Since 2017–18:
- code 1 incidents (emergency) attended by QAS have increased by 34 per cent
- code 2 incidents (urgent) have decreased by 2 per cent
- total code 1 and 2 incidents have increased by 15 per cent.
We analysed the growth of total code 1 and 2 incidents by Medical Priority Dispatch System (MPDS) category. MPDS is a universal standard for emergency dispatchers; categories in MPDS correspond to the most suitable category according to the reported symptoms or situation for triage purposes.
From the top 15 categories by volume in 2021–22, the 5 categories with the most significant growth over the last 5 years are stroke, heart, mental health (psychiatric, abnormal behaviour, suicide attempt), falls, and unconscious/fainting/near fainting. Figure 4C shows the percentage growth in these categories since 2017–18.
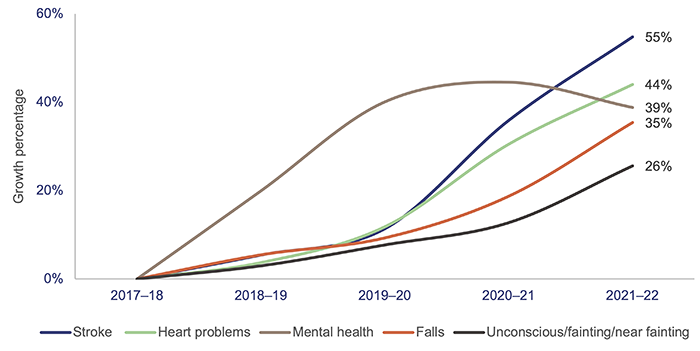
Note: QAO identified the top 5 ambulance case categories from the top 15 categories by volume in 2021–22.
Queensland Audit Office from data received from QAS’ reporting system.
Queensland has the highest number of ambulance incidents (events that result in one or more responses by a QAS resource) per 1,000 population compared with the rest of Australia, as shown in Figure 4D. A likely key reason for this is that QAS is a publicly funded service; New South Wales has adopted a user‑pays model, while Victoria, South Australia, and Western Australia use subscriber models.
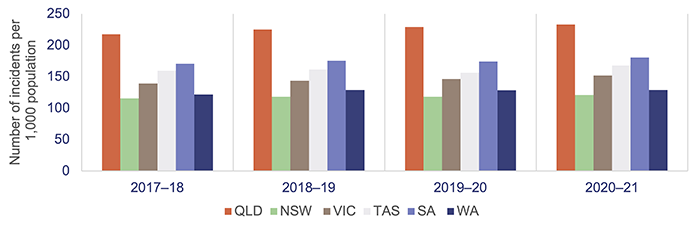
Notes: Data is for all hospitals across the states; latest-available information is up to the 2020–21 financial year. Population rates are derived using the 31 December estimated resident population of the relevant financial year. QLD – Queensland; NSW – New South Wales; VIC – Victoria; TAS – Tasmania; SA – South Australia; WA – Western Australia.
Productivity Commission, Report on Government Services 2022 Part E Section 11 Ambulance Services.
Care4Qld strategy
The Care4Qld strategy was launched in May 2021 and implemented during 2021–22 to improve emergency access and patient flow across Queensland public hospitals. The strategy was developed with key leaders from the department, HHSs, and the QAS in response to the increasing demand in the health care system.
The initial Care4Qld package included a $100 million funding boost to create 65 new beds for public services across Metro South and West Moreton HHSs. In 2021–22, these HHSs opened 52 new beds. The remaining 13 beds are expected to be delivered by West Moreton HHS through hospital in the home beds and/or through a private sector provider.
In July 2021, a further $163 million was announced under the strategy, to deliver 351 beds across Queensland through both the public and private sectors. As at June 2022, all of the 351 additional beds are available.
Queensland Health has met the commitment for additional beds. However, key performance measures such as ambulance response times, patient off-stretcher time (POST), and lost time (as discussed in the sections below) were not met in 2021–22. Performance continues to show a downward trend despite the Care4Qld initiatives including additional beds. One of the primary reasons for this trend is the pressure experienced during the COVID-19 Omicron wave from December 2021 to June 2022, which saw a surge in ambulance demand and pressures on workforce capacity.
The Queensland Ambulance Service advised us that whilst the Care4Qld initiatives may not have provided the outcomes initially intended in improving response times and lost time, the initiatives delivered additional bed capacity that provided some relief from the additional pressures on the health system to manage the impact of the pandemic.
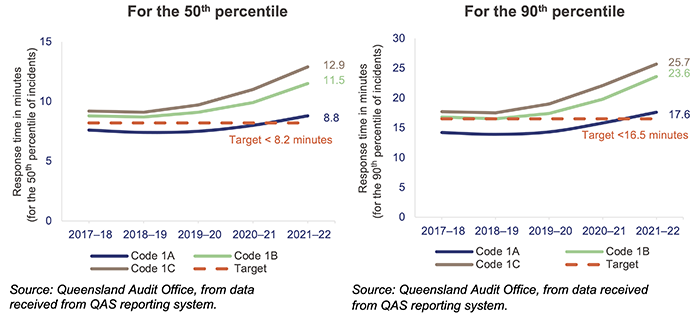
Ambulance response times
Ambulance response times measure how long it takes from when a triple zero call is answered to when an ambulance arrives at the scene.
Performance targets for response times are measured in minutes for emergency code 1 only for the:
- 50th percentile – QAS expects that 50 per cent of ambulances respond to emergency incidents code 1 in less than 8.2 minutes
- 90th percentile – QAS expects that 90 per cent of ambulances respond to emergency incidents code 1 in less than 16.5 minutes.
A response time percentile tells us what percentage of patients experienced a response time at or below a certain time.
The 90th percentile is the time within which 90 per cent of emergency incidents are responded to.
The 50th percentile is the time within which 50 per cent of emergency incidents are responded to.
Code 1 response times
Code 1 incidents are potentially life threating events that require the use of lights and sirens.
There were 506,550 code 1 incidents in 2021–22 (55 per cent of total code 1 and 2 incidents).
In 2021–22, QAS did not meet its response time performance targets for code 1, as shown in Figure 4E. From 2017–18 to 2020–21, QAS has only met its response time above the performance targets for priority code 1A (actual time-critical).
Code 1A is ‘actual time-critical’, code 1B is ‘emergent time critical’ and code 1C is ‘potential time critical’.
Despite having the highest number of responses in Australia in proportion to population, QAS managed to achieve better response times for emergency cases (code 1) than most other jurisdictions, as shown in Figure 4F.
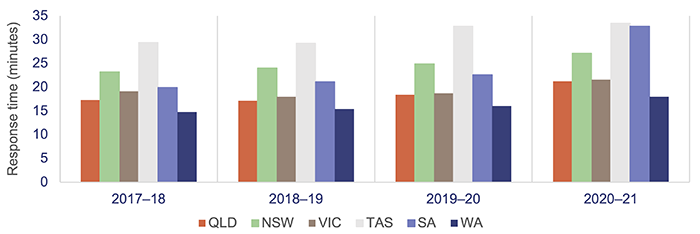
Notes: Data is for all hospitals across the states; the latest-available information is for the 2020–21 financial year. Differences across the states affect response-time data (topography, road/transport infrastructure, population dispersion, personnel mix, and response systems and processes). In NSW, QLD, and WA, response times are calculated from triple zero transfer to dispatch; in VIC and SA, these are calculated from the first key stroke; in TAS, they are calculated from the time of phone number and incident address confirmation. QLD – Queensland; NSW – New South Wales; VIC – Victoria; TAS – Tasmania; SA – South Australia; WA – Western Australia.
Productivity Commission, Report on Government Services 2022 Part E Section 11 Ambulance Services.
Code 2 response times
Code 2 incidents may require an undelayed response but do not require lights and sirens.
There were 417,646 code 2 incidents in 2021–22 (45 per cent of total code 1 and 2 incidents). Response times for code 2A increased from 53.5 minutes in 2020–21 to 60.9 minutes in 2021–22 (for the 90th percentile).
QAS has not set performance targets for code 2 incidents. This is because QAS’s focus is on ensuring it is responding to the most urgent cases.
Omicron impact on available QAS staff
In 2021–22, over 38,000 QAS staff hours were lost due to COVID-19. From January to June 2022, the number of staff hours lost due to COVID-19 was higher than between July and December 2021, due to the high spread of the Omicron variant. Staff hours lost due to COVID-19 correspond to the number of pandemic leave hours taken by ambulance operators, operational support, and corporate support.
Figure 4G shows QAS staff hours lost per month due to COVID-19 during 2021–22. This was a contributing factor on QAS performance on response times and is also in line with our observations in chapter 3 on the impact of COVID-19 and related costs.
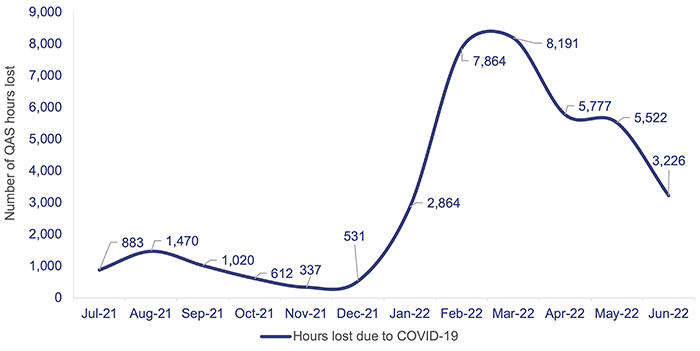
Queensland Audit Office, from data received from the QAS reporting system.
Moving patients off ambulance stretchers
Queensland’s target for patient off-stretcher time (POST) is to have 90 per cent of patients transferred off stretchers and into the care of an emergency department within 30 minutes (the clinically appropriate time frame recommended in July 2012 by Queensland’s Metropolitan Emergency Department Access Initiative). We note that POST is not a performance measure for QAS: it is a measure of the performance of HHSs. It provides an indicator of system-wide issues due to lack of capacity in public hospitals.
Queensland Health has not met the POST performance measure at the statewide level in the past 8 years.
The percentage of patients transferred off stretchers in less than 30 minutes has shown a significant downward trend in the past 5 years. As at 30 June 2022, the overall POST performance was 58.72 per cent – a decrease of around 6 percentage points since 2020–21. In 2020–21 and 2021–22, none of the 14 HHSs with a top 26 reporting hospital met its POST target, except for North West HHS.
The COVID-19 pandemic has placed further pressure on emergency departments, affecting POST performance. Hospitals have adopted new infection control measures, such as social distancing and personal protective equipment, which have increased treatment time and affected patient flow. Several Queensland hospitals also provide COVID-19 fever clinics from their emergency departments.
Figure 4H shows the POST performance for the top 26 reporting hospitals in Queensland over the last 5 years.
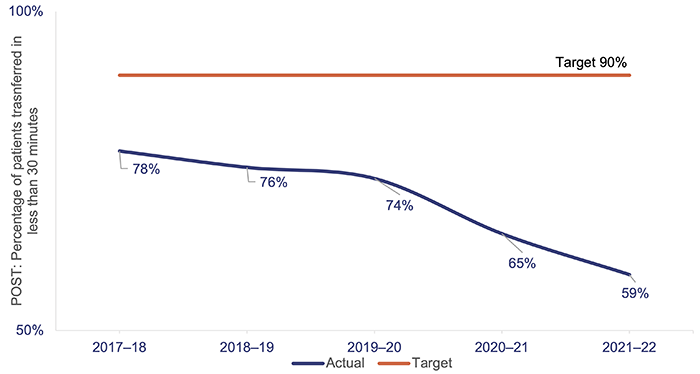
Queensland Audit Office, from data received from the QAS reporting system.
The inability to meet this target is linked to the number and complexity of patients presenting for treatment (both walk-ins and ambulance presentations), availability of ward beds, efficiency of hospital discharge processes, and the limited availability of specialists to attend patients in emergency departments.
When there is a patient off-stretcher delay, patients are cared for by QAS paramedics until formal transfer of care to the emergency department takes place. Faster off-stretcher times ensure ambulances are available to respond to those patients waiting in the community.
Ambulance lost time
Figure 4I shows the ambulance lost time (measured as the amount of time greater than 30 minutes that a patient remains on QAS stretchers) in total hours for code 1 and 2 incidents at the top 26 reporting hospitals for the last 5 financial years.
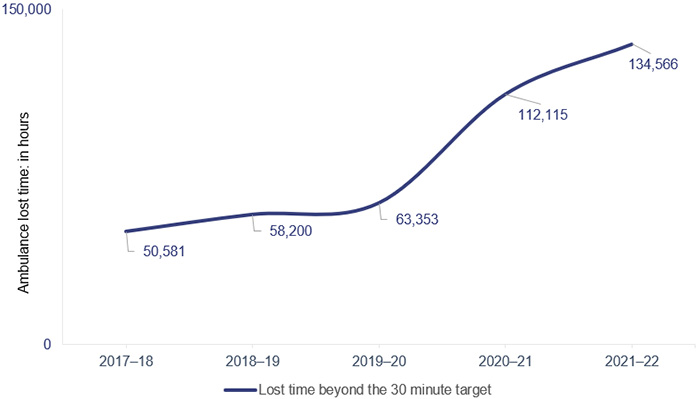
Note: Ambulance lost time data for 2017–18 differs by 22,843 hours from data reported in Health 2021 (Report 12: 2021–22) due to an error in generating the report provided by QAS to create this graph. New data reported has been validated by QAS.
Queensland Audit Office, from data received from the QAS reporting system.
A key factor in the increase in ambulance lost time and the decrease in POST performance is the increase in emergency department demand from both ambulance patients and walk-in patients. This has led to significant increases in the time it takes to transfer a patient to an emergency department.
Figure 4J shows, by HHS, the POST performance against accumulated ambulance lost time for the top 26 reporting hospitals for code 1 and 2 incidents. The HHSs serving heavily populated areas have the lowest performance when it comes to moving patients off stretchers within 30 minutes, and they have the highest amount of ambulance lost time as a result.
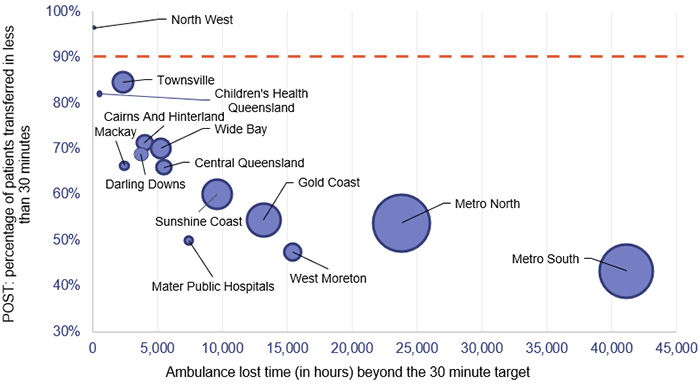
Notes: The size of the circles corresponds to the number of patients transferred to emergency departments by QAS. The orange line represents the POST target.
Queensland Audit Office, from data received from the QAS reporting system.
Specialist outpatient services
Since our audit of specialist outpatient services, reported in Improving access to specialist outpatient services (Report 8: 2021–22), the Omicron wave of COVID-19 has added further pressure to Queensland Health’s capacity to ensure patients waiting for a specialist outpatient service are seen within the clinically recommended times. In this section, we update key graphs from our previous report, using data provided by the department.
A long wait is when a patient has waited longer (by one day or more) than the clinically recommended time for a specialist appointment.
Queensland Health also monitors ultra-long waits – where patients have waited more than 2 years for an initial specialist outpatient appointment from the date they were placed on a specialist outpatient waiting list.
Seen-within time is where patients attend their first appointment within clinically recommended times.
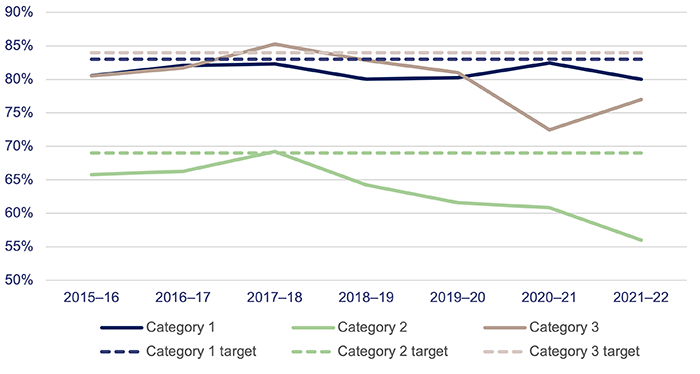
Queensland’s public hospitals use 3 urgency categories for specialist outpatient services, each with a target seen-within time (see Figure 4K). Queensland Health calculates waiting time from the date a patient is placed on a specialist outpatient waiting list to the date they are first seen by a clinician (referred to as the initial service event), excluding any days the patient was not able to receive care for a clinical or personal reason.
|
Urgency category |
Appointment required within |
Target seen-within time |
|---|---|---|
|
Category 1 |
30 calendar days |
83% |
|
Category 2 |
90 calendar days |
69% |
|
Category 3 |
365 calendar days |
84% |
Queensland Audit Office from Specialist Outpatient Services Implementation Standard and Queensland Health service delivery statements.
Figure 4L shows the percentage of outpatients seen by a specialist within clinically recommended times for each category. Queensland Health consistently met or closely met the target for category 1 patients from 2016–17 to 2020–21, but in 2021–22 it did not meet the targets for any of the 3 categories. In 2021–22, patients seen by a specialist in time for category 1 decreased by 4 percentage points. During the COVID-19 pandemic, restrictions on elective surgery (including postponed routine surgery) and workforce impacts reduced system capacity.
Queensland Audit Office from the Queensland Health specialist outpatient data collection.
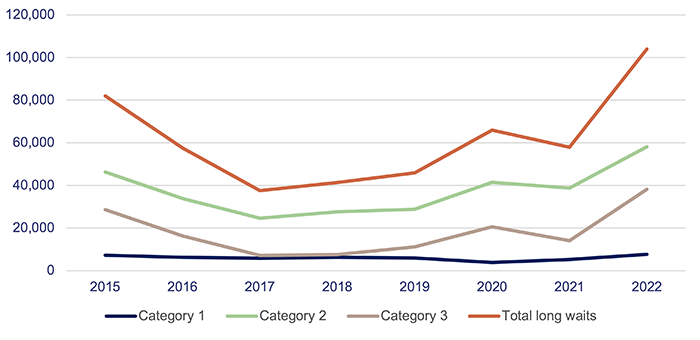
Figure 4M shows that the total number of long waits halved in the first 3 years of the Specialist Outpatient Strategy. But from 1 July 2017 to 1 July 2022, the total number of patients waiting longer than recommended increased by 177 per cent. In 2021–22, the total number of long waits increased by 80 per cent due to COVID-19 impacts on system capacity.
Note: All figures are as at 1 July.
Queensland Audit Office from the Queensland Health specialist outpatient data collection.
Figure 4N shows that Queensland Health successfully reduced ultra-long waits by 30 June 2017. Ultra‑long waits continued to decrease until 2019, but have increased again over the last 3 years. Of the 2,481 patients waiting more than 2 years for an appointment as of 1 July 2022, there were none for category 1; 634 for category 2; and 1,847 for category 3. The large increase in long waits and reduced system capacity will place pressure on ultra-long waits if specialities are unable to clear the backlog of long waits quicker than when new referrals come in.
|
Waiting time |
2015 |
2016 |
2017 |
2018 |
2019 |
2020 |
2021 |
2022 |
|---|---|---|---|---|---|---|---|---|
|
2 years or more |
15,802 |
6,640 |
1,159 |
359 |
73 |
1,055 |
892 |
2,481 |
Note: All figures are as at 1 July.
Queensland Audit Office from the Queensland Health specialist outpatient data collection.
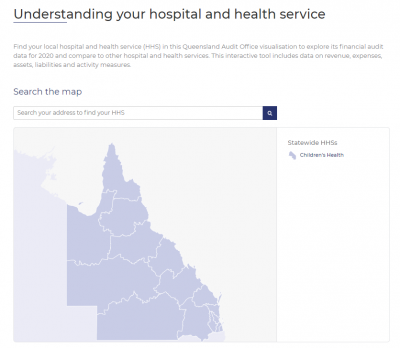
2022 hospital and health service dashboard
Find your local hospital and health service (HHS) in this Queensland Audit Office visualisation to explore its financial audit data for 2022 and compare to other hospital and health services. This interactive tool includes data on revenue, expenses, assets, liabilities and activity measures.