
Overview
The health sector has faced a year of rising costs, growing demand for services, the continuing challenges of COVID-19, and workforce pressures. Despite this, Queensland’s health sector entities continue to work towards providing accessible healthcare and support the wellbeing of their communities.
Tabled 12 December 2023.

Report on a page
This report summarises the audit results of Queensland Health entities, which include the Department of Health (the department) and 16 hospital and health services (HHSs). It also summarises the audit results for 13 hospital foundations, 4 other statutory bodies, and 2 entities controlled by other health entities.
Financial statements are reliable, and internal controls are generally effective
We provided 36 audit opinions in the health sector. All health entities’ financial statements were reliable and comply with relevant requirements. The minister tabled all health entity’s annual reports prior to the legislative time frame, improving on the timeliness of tabling compared to the previous year.
Internal controls (systems and processes) are generally effective, but we identified a significant deficiency (which means it needs to be fixed immediately) in payroll rostering and overtime controls at one HHS. We also identified deficiencies (which need to be addressed, but not as urgently) in rostering controls at 3 other HHSs. We have made recommendations aimed at strengthening controls over rostering and overtime.
Sustainability continues to be a challenge for the sector
The health sector has faced a year of rising costs and has not been able to operate within its original approved expenditure budgets. HHSs increased the level of services that they were able to deliver post‑COVID-19, resulting in a need for additional funding. Capital (major) works were also more expensive than budgeted for, reflecting the general cost pressures felt in the construction industry.
State and federal funding for HHSs increased, except for COVID-19-related funding, which decreased.
Workforce challenges continued, with high levels of staff overtime, shortages of staff in certain areas, and high levels of sick leave during the first quarter of 2022–23, coinciding with an increase in COVID-19 cases.
HHSs reported that anticipated maintenance required for their buildings and equipment has grown to $1.448 billion – an increase of $351 million, or 32 per cent since the previous year. The high level of anticipated maintenance means that repairs and maintenance is falling behind and the condition of health facilities is worsening. This indicates that further action is needed to address our recommendation from Health 2020 (Report 12: 2020–21) that health entities should prioritise high-risk maintenance.
The health system has less capacity to meet demand
In 2022–23, the percentage of outpatients seen by a specialist within clinically recommended times declined for all 3 categories that indicate urgency. (Each has a target time within which patients should be seen.) It is now the lowest it has been in the last 8 years for all categories. This is despite HHSs seeing more patients (by 9 per cent) in 2022–23 compared with 2021–22. The large number of patients (112,000) listed as having waited at least a day longer than the recommended time for a specialist appointment means the HHSs have an increasing backlog of patients they need to provide services to while new patients are being placed on the waitlists. This means more patients are being seen, but less are being seen within the clinically recommended time.
The Queensland Ambulance Service (part of the Department of Health) continues to face growing demand for all its services, including the most urgent ones. The time it takes ambulance crews to transfer patients into the care of emergency departments continues to be well below target. If patient transfer takes longer than 30 minutes, the extra time is considered ‘lost’ time for the Queensland Ambulance Service. In 2022–23, it lost approximately 160,000 hours – a 19 per cent increase compared to 2021–22. This is not a one-off increase, as 2021–22 had a 20 per cent increase on 2020–21.
1. Recommendations
This year, we have made recommendations to the Department of Health and the hospital and health services (HHSs) relating to employee expenses and asset maintenance.
It is critical that management maintains strong controls over employee expenses, as this is the largest operating expense for health entities. Hospital buildings are also critical in terms of providing health services. It is important that HHSs use structured approaches to assessing and reporting on maintenance that needs to be performed on buildings and other significant capital assets.
|
Improve controls over rostering and overtime |
|
|
Address inconsistencies in calculating anticipated maintenance of assets |
|
Status of recommendations made in previous health sector reports
Health entities need to take further action to address the recommendations made in our Health 2022, Health 2021, and Health 2020 reports. We continue to identify deficiencies in information security and procurement controls.
In addition, our previous recommendation that health entities should prioritise high-risk maintenance needs further action, as indicated by the significant growth in anticipated maintenance reported this year. We have included a full list of prior year recommendations and their status in Appendix E.
Reference to comments
In accordance with s.64 of the Auditor-General Act 2009, we provided a copy of this report to relevant entities. In reaching our conclusions, we considered their views and represented them to the extent we deemed relevant and warranted. Any formal responses from the entities are at Appendix A.
2. Entities in this report
This report summarises the financial audit results for health sector entities.
The Department of Health is responsible for the overall management of Queensland’s public health system. The Department of Health works with hospital and health services, which are independent statutory bodies, to deliver health services. The department contracts with each hospital and health service’s board via annual service agreements, which establish health services that the department is buying, and the funding that will be provided to each hospital and health service board for delivery of those services.
Figure 2A outlines the main entities and relationships between these entities. Appendix F provides a complete list of the health sector entities for which we have issued an audit opinion and which are covered by this report.
Queensland Audit Office.
3. Results of our audits
This chapter provides an overview of our audit opinions for entities in the health sector. It also provides conclusions on the effectiveness of the systems and processes (internal controls) entities use to prepare financial statements.
Chapter snapshot
Audit opinion results
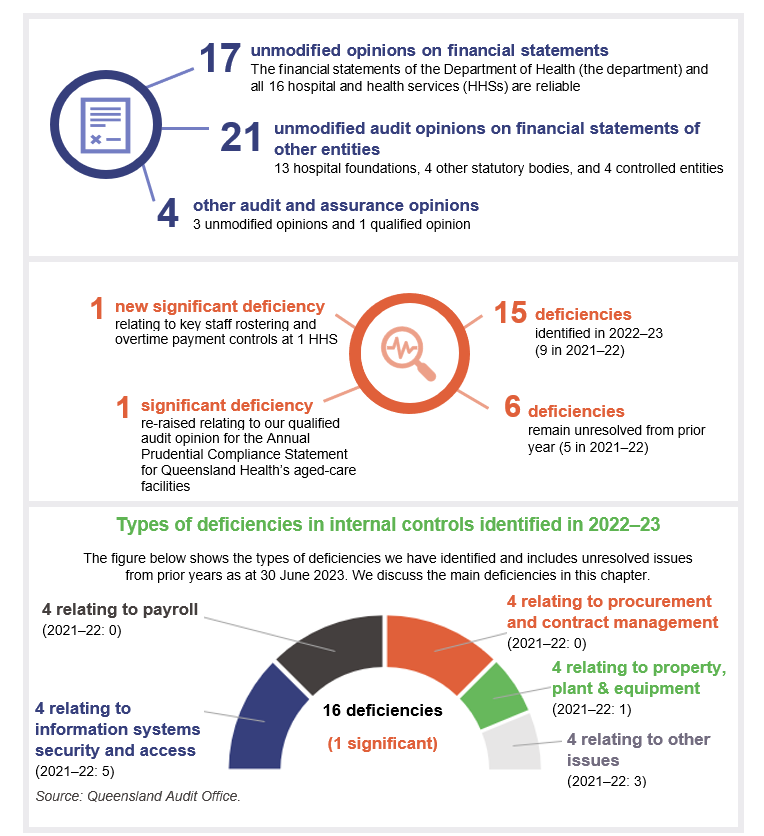
We issued unmodified audit opinions for all entities in the Queensland health sector, including the department, the 16 HHSs, the 13 hospital foundations, 4 other statutory bodies, and 4 controlled entities. This means the results in their financial statements can be relied upon. Appendix F provides detail about the audit opinions we issued for 38 entities in 2023.
We express an unmodified opinion when financial statements are prepared in accordance with the relevant legislative requirements and Australian accounting standards.
We qualify our opinion when the financial statements as a whole comply with relevant accounting standards and legislative requirements, with the exceptions noted in the opinion.
Significant deficiencies are those of higher risk that require immediate action by management.
Deficiencies are lower risk and can be corrected over time.
Entities tabled annual reports by the legislative deadline, and their timeliness is improving
The timely publication of annual reports, which include audited financial statements, enables parliament and the public to assess the financial performance of public sector entities while the information is still current. The annual reports for entities in the health portfolio were all tabled prior to the legislative deadline of 30 September 2023 across 3 days (the 13 hospital foundations on 27 September, the 4 statutory bodies on 28 September, and the department and 16 HHSs on 29 September). This is a slight improvement from 2022, when annual reports for these entities were tabled on 30 September 2022.
Other audit certifications
We issued a qualified audit opinion for the Annual Prudential Compliance Statement for Queensland Health’s aged-care facilities. In this statement, Queensland Health is required to outline to the Australian Government how it has managed refundable accommodation deposits, accommodation bonds, and entry contributions from aged-care residents.
We qualified our audit opinion because of 2 non-compliance issues with the Aged Care Act 1997 (the Act). We identified instances when entities did not comply with the requirement to enter into accommodation agreements within 28 days of entry to the aged-care facility. We also identified instances where refunds of refundable accommodation deposits, following the death of a resident, were not supported by the documents required under the Act.
Appendix G lists the other audit and assurance opinions we issued.
Entities not preparing financial statements
Not all entities in the health sector produce financial statements. Appendix H lists the entities not preparing financial statements and the reasons why.
Internal controls are generally effective
We assess whether the systems and processes (internal controls) used by entities to prepare financial statements are reliable. We report to management about any deficiencies in the design or operation of those internal controls.
Overall, to the extent that we tested them, we found the internal controls that health sector entities have in place to ensure reliable financial reporting are generally effective, but they can be improved. We identified one new significant deficiency and 15 new deficiencies in the current financial year, of which we assessed 4 as being resolved by the time of our final audits.
Queensland Health entities (the department and 16 HHSs) have strengthened their internal controls by resolving most long-outstanding issues. In 2022–23, they resolved 10 (59 per cent) of 17 remaining issues raised in previous years (2018 to 2022).
At present, 2 significant deficiencies and 17 deficiencies remain outstanding – 6 from previous years and 11 from this year. The outstanding significant deficiencies relate to:
- our audit of the aged-care Annual Prudential Compliance Statement, which was qualified in 2020–21, 2021–22, and again in 2022–23
- ineffective controls over staff overtime payments at one HHS entity.
Figure 3A shows the number of internal control deficiencies we have identified since 1 July 2017 that were unresolved as of 31 August 2023. All issues from 2016–17 and earlier are resolved.
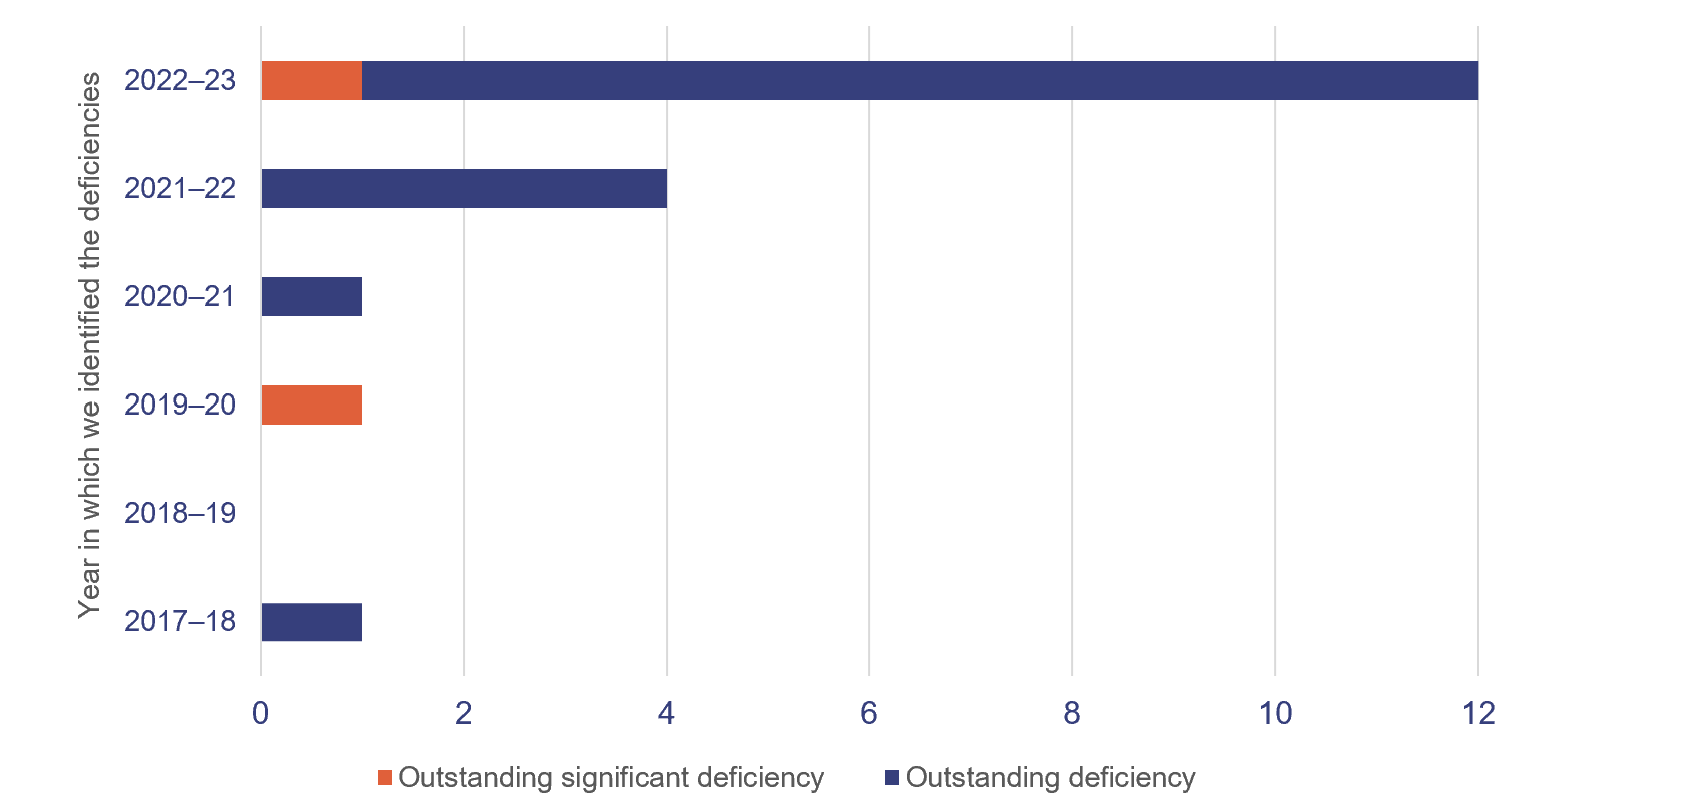
Queensland Audit Office.
Payroll – rostering and overtime
Queensland Health is the largest employer in Queensland. It is vital that the entities within it have strong controls over their payrolls, including for rostering and for approving overtime.
Responsibilities for complete and accurate payroll processing are shared between:
- Department of Health service centres, which take responsibility for processing payroll expenses for both departmental and HHS employees
- HHSs, which take responsibility for recruiting, approving employee contracts, setting financial and human resource (HR) delegations, approving rosters, and approving of Attendance variation and allowance claim (AVAC) forms or equivalent. (The AVAC forms are the main mechanism for recording any shift changes, unplanned overtime worked, and other changes to rostered hours for an employee.)
This year, we identified a significant deficiency at one HHS, which had ineffective controls over the approval of unplanned overtime. We noted irregularities and deviations from the HHS AVAC form policy. Some forms had been approved by an executive director, not the direct line manager, as required by the policy. We also found some instances of untimely submission of AVAC forms compared to when the overtime was worked.
This policy requires employees to submit AVAC forms ‘as soon as practicable’. This policy is inconsistent with the Department of Health’s requirement for AVAC forms to be submitted by the HHS within 2 weeks of overtime being worked. Also, the reasons for the overtime worked were not recorded on the AVAC forms.
We also identified internal control deficiencies specifically relating to approval of rosters and overtime at 4 other HHSs. In these HHSs, we noted instances of rosters being processed without enough or appropriate evidence of approval.
Rosters set out the anticipated work hours for an employee (including planned overtime), and determine an employee’s pay. Each HHS is responsible for ensuring rosters are approved by an employee with appropriate financial/HR delegation, prior to being submitted for processing by the department’s payroll processing office.
Approval of rosters and AVAC forms are key preventative controls to ensure paid overtime is appropriate. Without evidence of approval on a timely basis, there is a risk that employees are being paid incorrectly, potentially resulting in under or overpayment. Weaknesses in controls can also lead to fraudulent overtime claims being submitted.
Payroll overpayments
The department’s financial statements disclose outstanding recoveries of payroll overpayments of $49.8 million as at 30 June 2023 ($49 million as at 30 June 2022). It is recovering these from employees.
We have previously reported on the complexity of the health payroll system, noting that there are multiple employment awards in operation and complex award structures and allowances. The challenge of ensuring accurate payroll payments is increased by the large size of the payroll (more than 125,000 employees on a head count basis) and the working environment. Many employees work across Queensland on a 24-hour roster, and overtime is a frequent occurrence.
The department closely monitors and reports internally on trends in payroll overpayments, reasons for overpayments, and recovery actions. The average value of overpayments each pay period during 2022–23 was around $1.3 million (representing approximately 0.28 per cent of gross pay each pay period), which is consistent with 2021–22. The department has identified that the leading cause of overpayments is the late arrival of forms. They account for around 75 per cent of them.
One of the strategies the department is implementing to improve its payroll processes is the introduction of the Integrated Workforce Management Program (IWFM). IWFM is an integrated electronic rostering solution. The system is expected to enhance the roster-to-pay process and help to address some of the deficiencies relating to use and approval of AVAC forms, as the roster-to-pay process will no longer require paper-based inputs.
We understand that across all HHSs, the IWFM is being rolled out in a staggered approach for the nursing and midwifery cohort, which accounts for approximately 50 per cent of heath employees. To date, it has been implemented in 2 HHSs, with implementation at the remaining 14 planned for between December 2023 and September 2024.
However, medical staff are not included in the approved IWFM rollout plan. Given they account for 68 per cent of overtime expenses, the HHSs still need to take action on the control deficiencies we have identified.
|
Recommendation for the Department of Health and 16 HHSs Strengthening of rostering and overtime controls |
|
Procurement and expenses – contracts
Effective procurement processes ensure there is a fair and robust system in place to obtain goods and services. They also assist entities in obtaining value for money.
The department and HHSs have worked to resolve several procurement control deficiencies we have identified since 2017–18, but we continue to identify new areas for improvement. There are currently 6 outstanding deficiencies relating to procurement controls. Of these, we identified 4 in 2022–23, of which we assessed one of these as being resolved by the time of our final audits.
The nature of procurement issues that we reported this year include:
- non-compliance with the requirement to publish details of contracts awarded
- insufficient monitoring of financial delegations
- lack of evaluation of contract performance
- lack of evidence of monitoring of expenditure
- lack of a complete central contract register.
Information systems controls and cyber security
We continue to find weaknesses in information systems controls, and risks to cyber security. We identified deficiencies relating to terminated employees still having access to the network, and weak network password controls. We also identified these in 2022, and have an open recommendation that requires health entities to take further action. (Refer to Appendix E for more detail.)
The department and each HHS jointly manage access to information system resources and users. The department manages the network and provides a dashboard of active users to each HHS for its review. Each HHS is responsible for approving access to the network and notifying the department when access is no longer required. This is a time-intensive task, due to the many position changes that occur daily.
The department has piloted an identity and access management solution to automate the removal of system access when employment ends. The implementation project is in progress, and the department has extended its delivery date to the end of December 2023.
4. Financial performance and sustainability
This chapter analyses the financial performance, position, and sustainability of the Department of Health (the department) and the 16 hospital and health services (HHSs). In our discussion of sustainability, we consider both financial sustainability and emerging issues that may affect the sector.
Chapter snapshot
Operating results
We consider a range of factors in assessing financial performance and sustainability. As the department and HHSs are not-for-profit entities, we place more emphasis on the total cost of services compared to services delivered and on adherence to approved budgets, rather than on whether they achieve a surplus or deficit result.
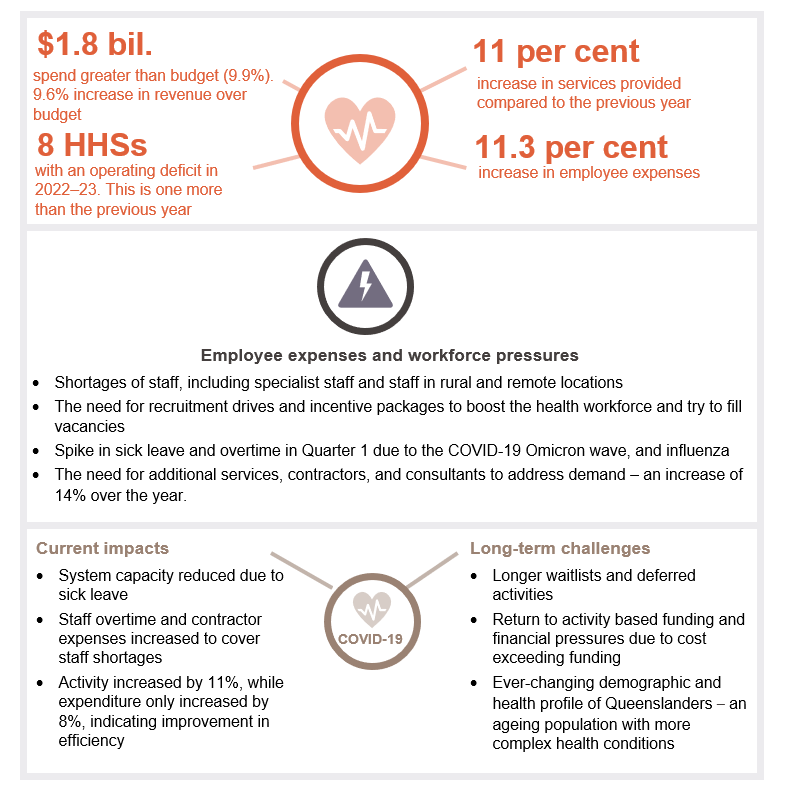
In 2022–23, overall operating expenditure of the HHSs exceeded budgeted amounts by $1.8 billion or 9.9 per cent (2021–22: $1.4 billion or 8 per cent over budgeted amounts). This increase was largely driven by an increase in the health services delivered – approximately an 11 per cent increase over the previous year. This resulted in the health sector’s revenue being 9.6 per cent above budget. The increase in activity reflects a return to a level of normality after the disruptions caused by COVID-19.
Employee-related expenses were approximately $1.3 billion higher than budgeted, reflecting the higher than anticipated costs of renewed enterprise bargaining agreements and superannuation, and increased employee numbers to deliver health services.
On 31 October 2022, the public emergency declared by the Queensland Government for COVID-19 ended and mandates and quarantine requirements were lifted. However, COVID-19 continued to have an impact on the HHSs in the first quarter of 2022–23 (from July to September 2022), particularly when Queensland experienced a large increase in COVID-19 case numbers, as shown in Figure 4A. This affected the HHSs’ ability to reduce the backlog of patients on waiting lists.
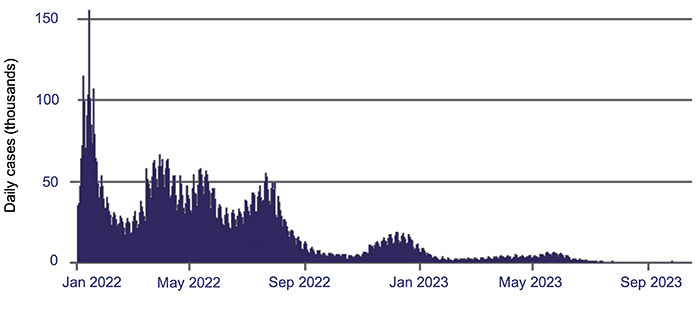
Queensland Audit Office, using information from the Australian Government Department of Health and Aged Care.
The combined operating result (the difference between income and expenses) of the HHSs in 2022–23 was a $68 million deficit (2021–22: $42 million surplus). This deficit represents 0.34 per cent of the $20 billion of income received by HHSs (2021–22: the surplus represented 0.23 per cent of total income that year).
Pressure on hospital and health services’ operating budgets
The 2022–23 state budget expected only one HHS to make a deficit for the year – Children’s Health Queensland HHS. The remaining 15 were projected to have a balanced budget (a zero operating result).
HHS revenue for 2022–23 was impacted by the ceasing of COVID-19-specific support. The Australian Government's minimum hospital funding guarantee to assist HHSs in operating during the COVID-19 pandemic ceased on 30 June 2022. This meant HHSs' funding returned to a model based on their actual delivery of health and hospital services. This funding can be withdrawn or clawed back from individual HHSs if their delivery of services is below target.
In managing the transition from the COVID-19 health emergency, HHSs are now balancing conflicting challenges, such as managing increased demand for healthcare, ensuring the recovery of a workforce under pressure, and trying to provide timely, high-quality health services.
They are under pressure to submit budgets with a zero operating result. The 2023–24 state budget has all HHSs achieving this. However, as at 30 June 2023, 6 HHSs were receiving intensive performance support from the department (which means the department is monitoring them and assisting them to improve their financial position). This indicates there will be further pressure on HHSs’ operating results in 2023–24. Achieving a zero-based budget may be unrealistic.
Analysis of health sector expenditure
Total expenditure incurred by HHSs increased by 9.4 per cent this year, from $18.1 billion to $19.8 billion. All HHSs incurred expenses higher than their budgeted amounts, with variances between 1.7 per cent and 12.8 per cent. Additional funding was provided to the department and HHSs to cover their costs and reflect the level of services HHSs delivered.
The drivers for expenditure and delivery of activities this year included:
- impacts of the COVID-19 pandemic, which was still prevalent in the first quarter of 2022–23
- capacity pressures and a significant increase in demand for services. This existed before the COVID‑19 pandemic due to population growth and changing demographics (an ageing population)
- issues with recruitment and retention of critical staff members (to prevent high turnover)
- additional time invested in dealing with patients with complex health issues and illness profiles (such as increases in chronic diseases) that were put on hold during the pandemic
- amounts invested in establishing new services (for example, mental health services) to plan for the increase in demand for such services.
Workforce pressures, and analysis of employee expenses
In 2022–23 Queensland Health faced multiple challenges in growing and maintaining a consistent workforce. Many stemmed from the response to the COVID-19 pandemic (such as the standing down of unvaccinated staff) and efforts to stabilise the demand for health services.
Before the pandemic, most HHSs were already experiencing significant challenges in coping with the increasing demand for services, but since its onset, demand for healthcare services has continued to increase. This has created additional pressure on the healthcare system, which was already at capacity.
As shown in Figure 4B, employee expenses contribute to between 56 per cent and 70 per cent of total expenses across the HHS regions. This is expected, as HHSs operate in a service-based industry that is reliant on a stable workforce to deliver high-quality healthcare services. Rural and remote HHSs have the lowest proportion of employee expenses to total expenses as they have a higher reliance on contract staff.
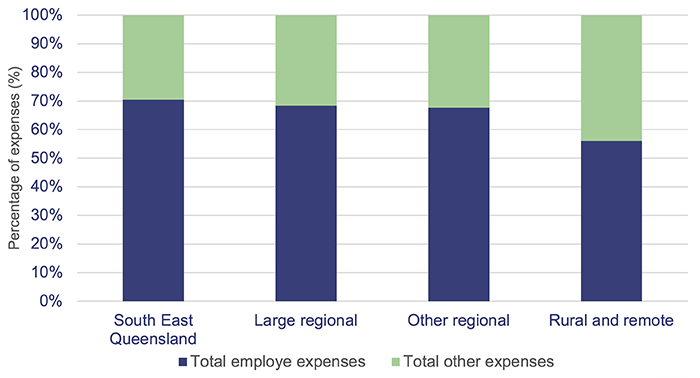
Queensland Audit Office, from hospital and health service financial statements 2022–23.
Increase in employee expenses
In total, HHS employee expenses:
- increased from $12.3 billion in 2021–22 to $13.6 billion in 2022–23 (2020–21: $11.5 billion), which is an increase of 11.3 per cent since last year (2020–21: 6.81 per cent increase)
- were above the budgeted amount by 9 per cent (2021–22: 4.75 per cent increase in employee expenses above the budgeted amount).
The increase in total employee expenses this year is partly attributable to a 2.87 per cent increase in the number of full-time equivalent (FTE) staff working in the HHSs. (Full-time equivalent – the number of staff, measured in terms of what proportion of full-time hours they work.) The main factors contributing to the significant increase in employee costs are:
- additional staff taken on in the first quarter of 2022–23 in response to a COVID-19 outbreak
- salary increases driven by enterprise bargaining agreements
- additional labour required throughout the period to increase capacity to deliver services not provided during the COVID-19 pandemic, and to provide new health services
- additional expenses due to HHSs using external clinical contractors to manage workforce shortages and to cover employee leave and backfill – and also due to an increase in agency rates and fees.
Leave balances remain high, but they are stabilising
Leave balances remain elevated as at 30 June 2023 compared to the pre-COVID-19 environment, but they are stabilising. They have slightly reduced since last year, as HHSs return to normal business operations.
Healthcare workers over the course of the pandemic were entitled to 2 additional types of leave:
- COVID-19 response leave (2 days additional leave to be taken by 30 June 2023 – to acknowledge the employees' response to COVID-19)
- special pandemic leave in lieu of sick or carer's leave. (This ceased 30 June 2023.)
Not all staff have used the additional leave. HHSs were refunded for unused leave balances if not all employees used their COVID-19 response leave.
Recreation leave
Overall, average recreation leave balances decreased by 2 per cent in 2022–23 compared to the previous year. Most HHSs had a decrease in recreation leave balances for staff employed for the full 2022–23 financial year.
However, as shown in Figure 4C, average leave balances per employee are still higher than pre‑COVID‑19 balances. This indicates workforce pressures are still having an impact on employees taking leave.
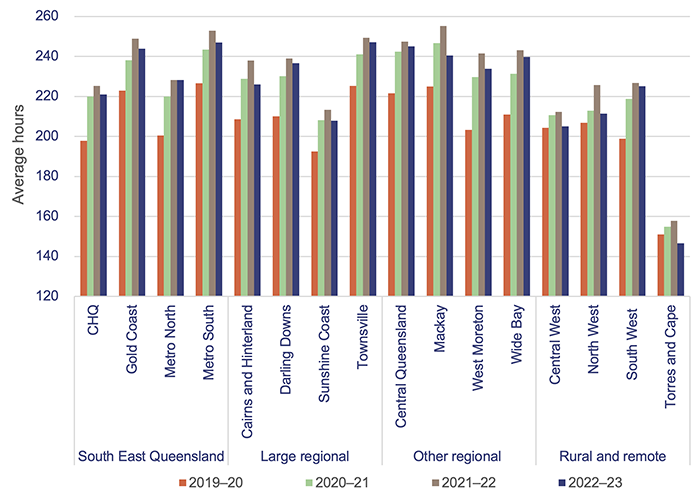
Note: Recreation leave balances have been included for staff who were employed from 1 July to 30 June of that financial year. CHQ – Children’s Health Queensland.
Queensland Audit Office, from Department of Health data.
Sick leave and overtime expenses
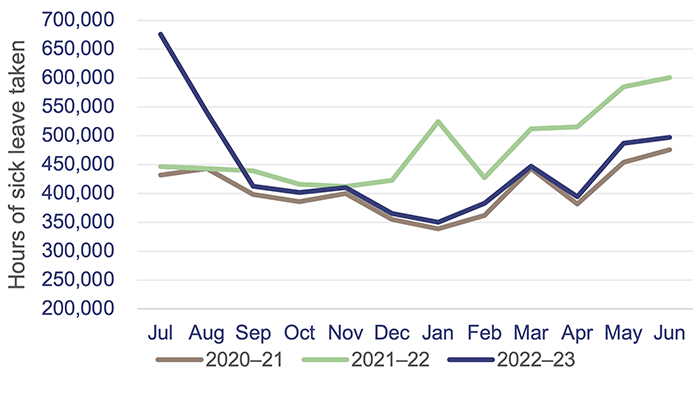
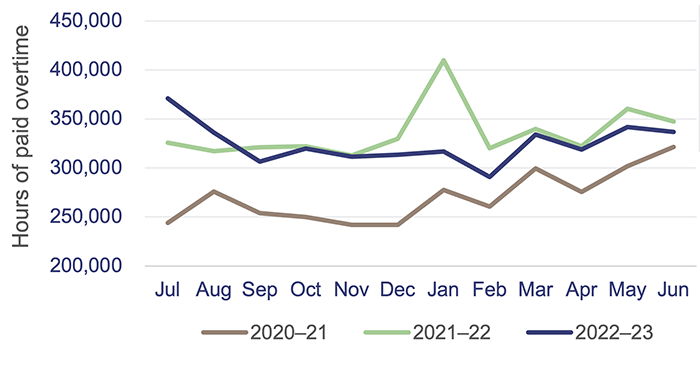
Overall, there was a small decrease in sick leave taken and in overtime expenses this year. This decrease is due to the end of large COVID-19 outbreaks.
Overtime expenses are still 20 per cent higher than they were in 2020–21. This shows that although there was a COVID-19 outbreak in the first quarter of the financial year, staff were still working significant amounts of overtime to meet demand. Figures 4D and 4E show sick leave hours and overtime paid over the last 3 years.
|
▼ 7% decrease in sick leave this financial year ▲ 10% increase in sick leave from 2021 financial year |
Queensland Audit Office, from Department of Health data.
KEY OBSERVATIONS
- July 2022 peak due to COVID-19 outbreak
- January 2022 peak due to COVID-19 outbreak
EXPECTED TRENDS
- Increase in sick leave and overtime in the winter months due to strains of illness (for example, Influenza B in May/June 2023)
|
▼ 3% decrease in overtime paid this financial year ▲ 20% increase in overtime paid from 2021 financial year |
Queensland Audit Office, from Department of Health data.
Contracting additional staff
In 2022–23, Queensland Health recorded a 16 per cent increase in expenditure for frontline contractor staff – an increase of $47 million. This was due to the continued increase in demand.
Most of the increase in expenditure was incurred by the regional areas, where the costs of obtaining additional labour are higher.
Figure 4F shows expenditure on frontline contractors across the HHS regions.
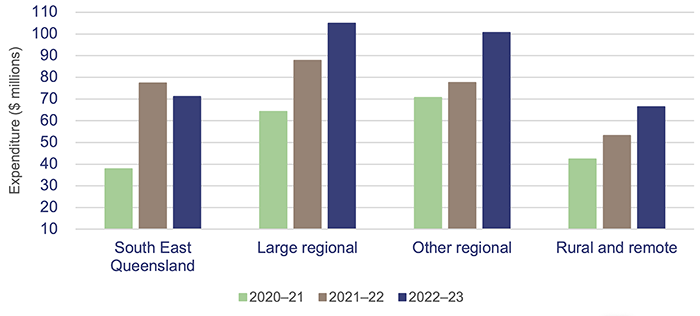
Queensland Audit Office, from Department of Health data.
Analysis of expenses for supplies and services
From 2021–22 to 2022–23, HHS expenses for supplies and services increased by $283 million (6.1 per cent). Two of the main drivers of this include a 15.5 per cent increase in pharmaceuticals ($124 million), and an approximately 14 per cent increase in consultants and contractors (both clinical and non-clinical).
Pharmaceuticals increased due to higher medical activity in 2022–23, when deferred clinical services were restarted and demand increased for high-cost drugs for cancer treatments, respiratory illnesses, Cystic Fibrosis, and Hepatitis C.
Also, as already mentioned, HHSs used external clinical contractors and outsourced clinical service delivery to manage workforce shortages, provide coverage for employee leave, and backfill positions. This cost has also risen due to increased agency rates and fees.
Most HHSs have experienced increased costs and demand for travel (for both patients and staff), with domestic travel costs rising by $28 million (20 per cent) this year.
There has also been a general trend across the HHSs of market costs increasing (by an average of 8 per cent this year) for medical consumables, pathology, and prosthetics. This increase has largely been driven by movements noted in the Consumer Price Index (CPI) over the last 2 years, with CPI annual changes at 7.8 per cent in December 2022 and 6 per cent in June 2023.
Analysis of the health sector’s income
This year, actual heath sector income of the HHSs was 9.9 per cent above budget, with all HHSs’ income higher than projected in the state budget. HHSs reported variances between the actual and budgeted amounts ranging between 2.9 per cent and 15.3 per cent. Any significant variances were mainly found in regional and rural and remote HHSs.
TYPES OF FUNDING FOR HHSs
The 4 main funding sources for HHSs are:
- state funding – revenue received from the Queensland Government
- federal funding – revenue received from the Australian Government
- grants and contributions – including specific purpose grants, such as nursing home and home support program grants; and contributions, such as corporate support services provided by the department
- own-source revenue – revenue that HHSs generate through the sale of goods and services. This includes user charges, for example, from billing private patients for hospital services; reimbursements from the Australian Government for medicines listed on the Pharmaceutical Benefits Scheme; and other non-patient revenue, such as retail proceeds.
The main types of government funding for HHSs are:
- activity based funding (ABF) – This is based on the price, 'weight' (complexity) of service, and number of services provided to patients. Classification of these variables is based on a national schedule, with modifications for the Queensland health system
- National Efficient Cost (NEC) block funding – This is mainly for teaching, training, and research in the public health sector; eligible non-admitted services (for example, mental health services); highly specialised therapies; and other public hospital programs. Certain hospitals (rural and regional) only use block funding
- other funding – This is for areas that are not covered by ABF and NEC, including population-based community services, and specific funding arrangements for prison health services and third-party health providers.
Service agreements are negotiated between the department and each HHS. The agreements outline the services the department purchases from each HHS, and the amount it pays for those services. Funding is based on the number of patients, number of services, and complexity of services provided, referred to as ABF. Funding can also be provided through block funding (which means they are funded for services outside the scope of ABF). Fifteen of the HHSs are funded partially by ABF. The Central West HHS was funded by other sources this year.
Under the service agreements, the department and HHSs measure service activity using Queensland Weighted Activity Units (QWAUs).
Figure 4G shows that activity increased by 11 per cent this year (2022–23: 2.5 million QWAUs; 2021–22: 2.26 million QWAUs) and was within one per cent of the target activity for 2022–23. Overall, this shows the HHSs have been more efficient in their delivery of activities this year. This was expected, as COVID‑19 cases decreased and HHSs began to return to pre-COVID-19 activities.
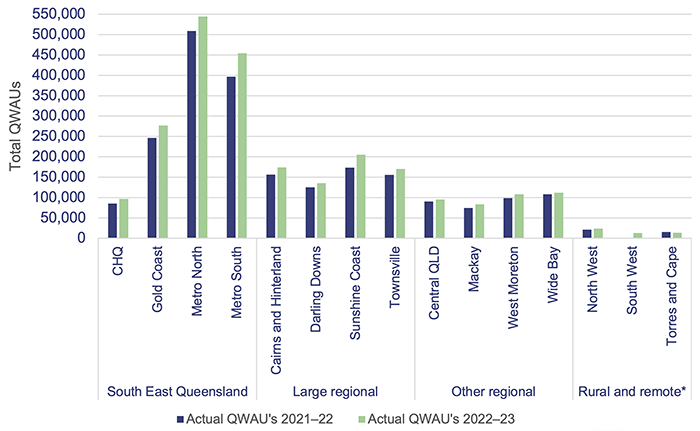
Note:* Central West HHS did not report on activity in 2021–22 and 2022–23, and South West did not report on activity in 2021–22, as they did not receive activity based funding in those years. CHQ – Children’s Health Queensland. QLD – Queensland.
Queensland Audit Office, from hospital and health service annual reports 2021–22 and 2022–23.
5. Asset management in health entities
Health entities need to effectively manage their assets. They need to plan for future requirements, manage existing assets, and invest in new assets. To achieve the best outcomes, they also need to ensure there is a close relationship between how they manage and maintain existing assets and build new ones.
Queensland’s population and age – impact on capital requirements
Queensland makes up 20.5 per cent of Australia’s total population. The state’s population has been growing steadily, and in 2023, it increased by 2.3 per cent or 124,200 (2022: 1.8 per cent growth).
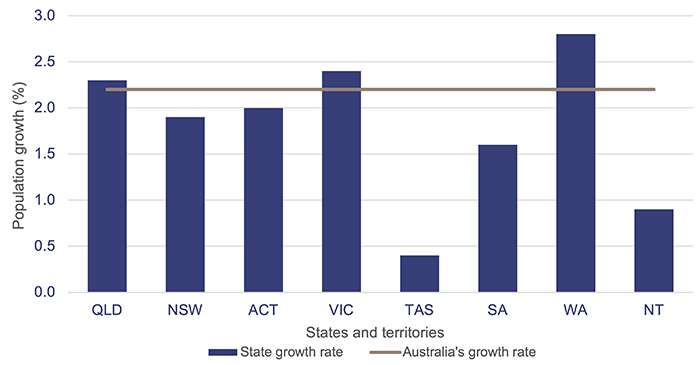
Note: QLD – Queensland; NSW – New South Wales; ACT – Australian Capital Territory; VIC – Victoria; TAS – Tasmania; SA – South Australia; WA – Western Australia; NT – Northern Territory.
Population estimates: States and territories – Queensland Government Statistician’s Office.
According to the 2021 census, Queensland’s population aged 65 years and older has grown by 54 per cent between 2011 and 2021. In 2021, 17 per cent (875,600) of the population was aged 65 years and older, and it is expected to increase to over 1.3 million by 2036 (a 49 per cent increase in a 10-year period). This, together with the overall growth in population, will place additional pressure on the health system and the services it needs to deliver.
Ageing buildings
The health sector needs to plan to replace ageing health infrastructure. For the 2022–23 capital program, the expenditure target was $1.53 billion (excluding an allocation to the Council of the Queensland Institute of Medical Research). The health sector actually spent $1.86 billion in 2022–23 – 21 per cent over the budgeted target.
As shown in Figure 5B, approximately 32 per cent ($7.5 billion) of buildings currently owned by the Department of Health (the department) and the 16 hospital and health services (HHSs) are due to be replaced within the next 10 years, based on their recorded remaining useful lives. (Useful life is the number of years an entity expects to use an asset – not the maximum period possible for the asset to exist.) The Department of Health expects that buildings will however last longer than suggested by their recorded remaining useful lives. This is due to future refurbishment, redevelopment, and other capital maintenance activities, which will extend the lives of these buildings.
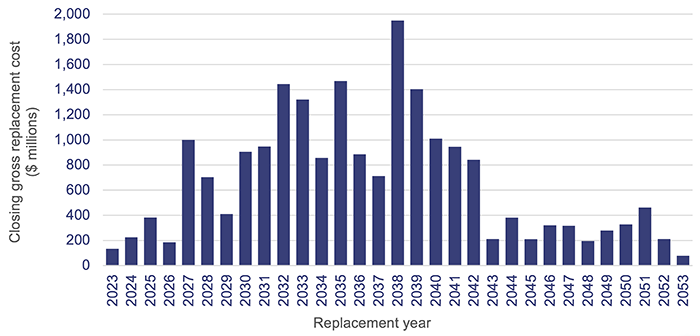
Note: Closing gross replacement cost is the estimated cost to construct a similar asset without adjustments for age and condition of the existing asset as at 30 June each year.
Queensland Audit Office, from Department of Health and hospital and health service asset registers 2023.
Figure 5C shows health sector building ages across the state. Buildings in the regional and rural and remote HHS regions are largely between 10 and 50 years old, but several HHSs, such as Darling Downs, have a larger portion aged over 50 years. The 2023–24 capital budget identifies investments in rural and regional areas, including $1.3 billion for a new Toowoomba Hospital (Darling Downs HHS) and $1.2 billion for a new Bundaberg Hospital (Wide Bay HHS).
The 2023–24 capital budget outlines a $944 million Building Rural and Remote Health Program to enhance and replace aged health facilities and staff accommodation. This will be implemented over the next 6 years, with 10 projects to begin construction in 2023–24.
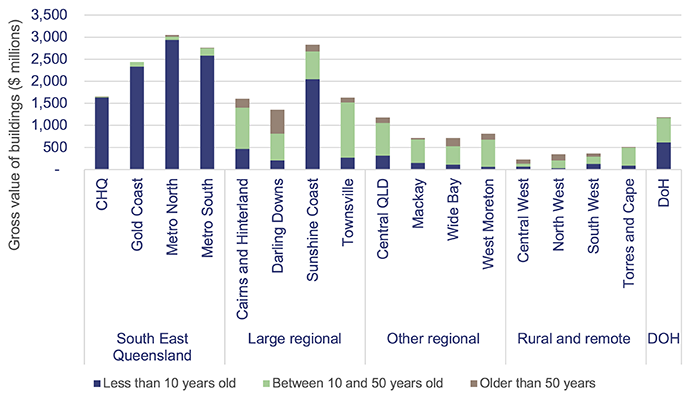
Note: CHQ – Children’s Health Queensland; QLD – Queensland; DOH – Department of Health.
Queensland Audit Office, from Department of Health and hospital and health service asset registers 2023.
The 2023–24 state budget:
- committed $1.6 billion in funding for health infrastructure, capital works, and purchases to address the growing demand on public health services. This funding will target areas such as hospitals, ambulance stations and vehicles, health technology, mental health services, and information and communication technology
- identified $9.8 billion for a Queensland Health Capacity Expansion Program, which will deliver 2,200 additional beds across 15 facilities in Queensland in the next 6 years. This includes 3 new hospitals and a new cancer centre, and the expansion of 11 existing hospitals.
The health sector faces ongoing challenges in achieving the desired outcomes from its investment in capital works. Current market conditions are placing considerable pressure on costs, and shortages in materials and labour are creating delays in the expected timing of capital expenditure.
This pressure will be magnified over the next 6 years due to the significant pipeline of capital works being delivered across Queensland. There will, for example, be competition for resources with the Olympic and Paralympic Games, energy, and water projects.
Operational costs will need to be included in future budgets to ensure the entities can effectively and efficiently use these assets.
In our Forward work plan 2023–26, we have identified infrastructure investment as one of the focus areas for our future performance audits. Effective asset management and investment are critical to long-term financial sustainability. We encourage health sector entities with large infrastructure assets to consider any recommendations contained in our related reports, such as our report on Improving asset management in local government (Report 2: 2023–24).
Reported anticipated maintenance of assets
HHSs continue to face significant challenges in funding the anticipated maintenance of their assets.
Anticipated maintenance (or deferred maintenance) is defined as maintenance that is necessary to prevent the deterioration of an asset or its function, which has not yet been carried out.
The Queensland Government Maintenance Management Framework requires the reporting of anticipated maintenance. All Queensland Health entities comply with this framework.
The current cost of anticipated maintenance across the HHSs as of 30 June 2023 was $1.4 billion – an increase of $351 million (32 per cent) from 2022. It is not clear if this movement is due to an increase in anticipated maintenance, or if more stringent asset condition assessments have been performed, resulting in extra pre-existing maintenance requirements now being identified.
While the department and HHSs must comply with the Queensland Government Maintenance Management Framework, there is no internal standard that all health entities apply to determine their anticipated maintenance. As a result, there is a risk that the reported figures are not developed on a consistent basis. Examples of differing approaches include:
- an anticipated maintenance ‘template’ that uses data from Queensland Health’s finance system
- an internally developed ‘model’ or software
- preparation by external consultants.
All HHSs report that the underlying data generally comes from condition assessments that are completed every 3 years. These are prepared by a combination of internal staff and external consultants. Additional inputs may include forecasting, field service reports, valuations, and maintenance targets.
Maintenance targets can vary, with the Queensland Government Maintenance Management Framework recommending a minimum funding target of one per cent of building replacement value, and Queensland Health previously determining 2.8 per cent of asset replacement value as the budget required to sustain building assets to achieve expected life cycles (this was the percentage identified in service agreements with HHSs up to 2021–22).
Figure 5D shows the growth of 30 June balances for anticipated maintenance over the last 4 financial years for each HHS region.
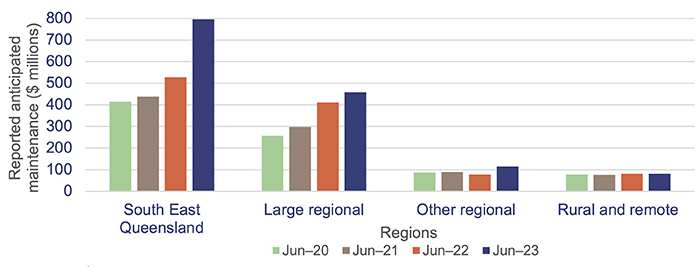
Queensland Audit Office from the hospital and health services’ annual reports.
Most HHSs increased their repairs and maintenance expenditure in 2022–23, with an overall increase of 3.4 per cent. Much of this increase can be attributed to cost escalations due to supply chain issues, cost increases in construction material, and labour supply shortages. Given the 32 per cent growth in anticipated maintenance over the same period, HHSs may not have completed all the expected maintenance works, despite spending more due to rising costs.
There is a risk that assets that do not receive required maintenance will deteriorate, which will increase the costs required to keep buildings in their expected condition. There may also be employee and patient safety ramifications (for example, if nurse station duress alarms do not function as required).
All of the health entities should continue work on addressing recommendation 5 from our report Health 2020 (Report 12: 2020–21), which was to prioritise high-risk maintenance (Appendix E).
Figure 5E shows the actual expenditure on maintenance and repairs for each HHS region between 2021–22 and 2022–23.
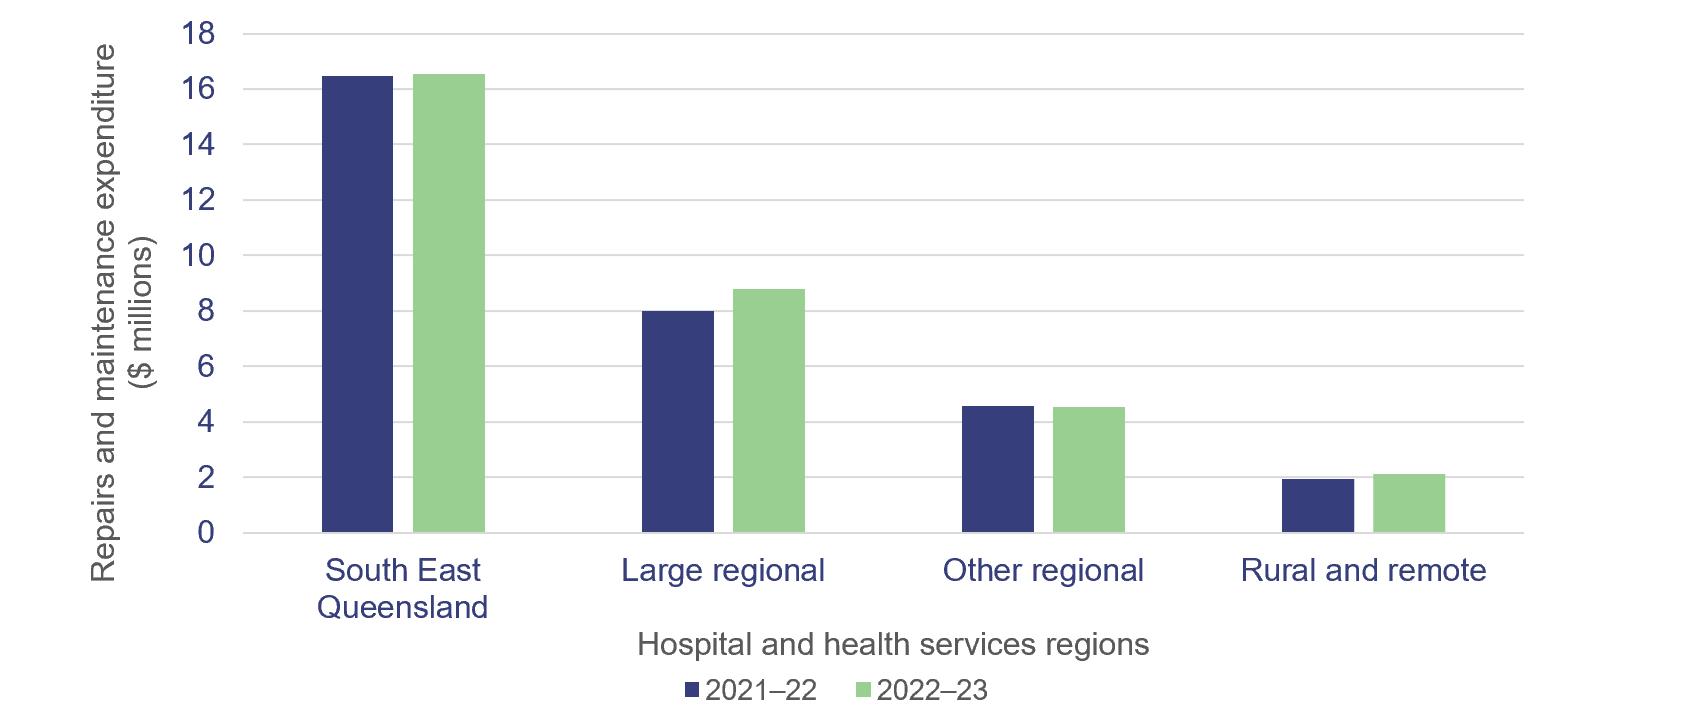
Queensland Audit Office, from Department of Health data.
|
Recommendation for the Department of Health and 16 HHSs Address inconsistencies in calculating anticipated maintenance |
|
2. The department and 16 HHSs should:
|
Satellite Hospitals Program
The Satellite Hospitals Program has been underway since 2020, with the government providing funding for the opening of 7 new hospitals in South East Queensland.
These are designed to support increased demand in major hospitals by delivering urgent care closer to home for non-life-threatening illnesses and injuries and referral-based outpatient services. A business case was developed by the HHSs for each location to identify the range of services to be delivered, these include dialysis, ante- and post-natal services, and chemotherapy.
Construction was initially expected to take approximately 12 months after the government acquired the individual land parcels. However, construction and supply chain issues have caused delays (see Figure 5F).
Three satellite hospitals – Caboolture, Redlands, and Ripley – opened in August 2023. Kallangur and Tugun are expected to open in late 2023, and Bribie Island and Eight Mile Plains in 2024.
The Bribie Island and Eight Mile Plains sites have also experienced significant delays in construction due to unforeseen issues relating to cultural heritage negotiations, inclement weather conditions, and site contamination.
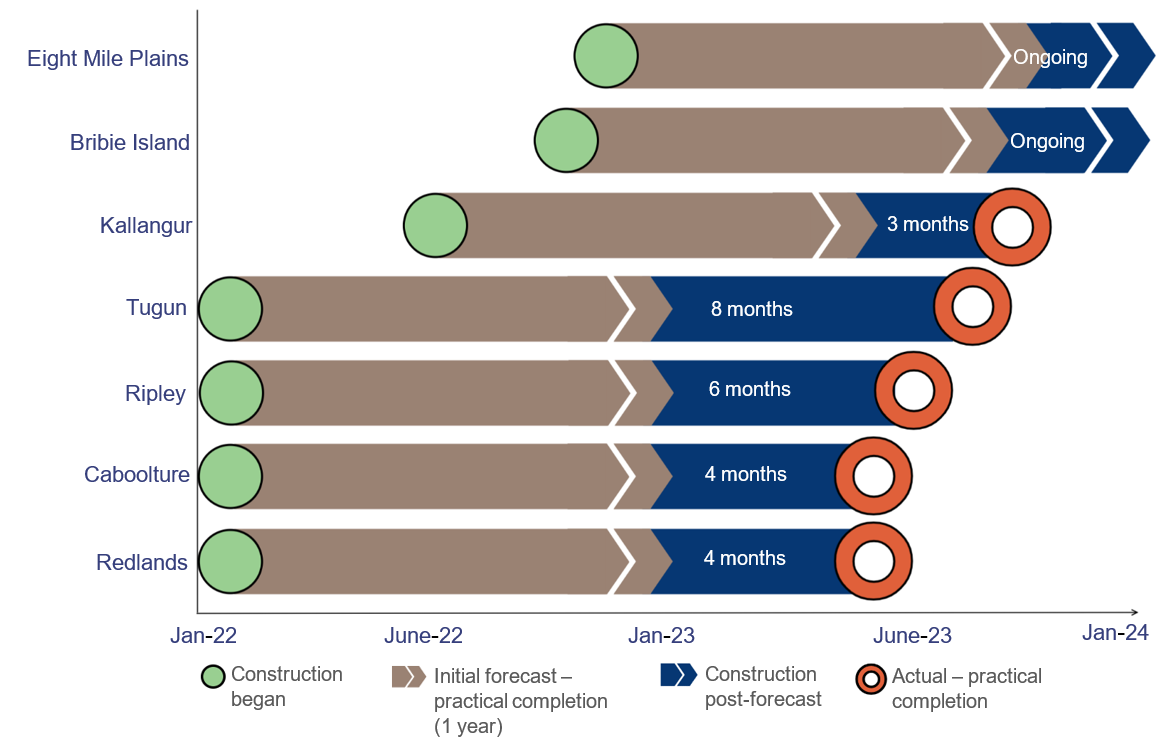
Notes: Practical completion, as defined by the Queensland Building and Construction Commission, means when ‘a licensed contractor has completed all work according to the contract, plans and specifications. If there are any defects or omissions, they should only be minor. The work must be reasonably suitable for habitation and comply with all relevant statutory requirements, including the Building Code of Australia’.
Queensland Audit Office from Department of Health forecasting.
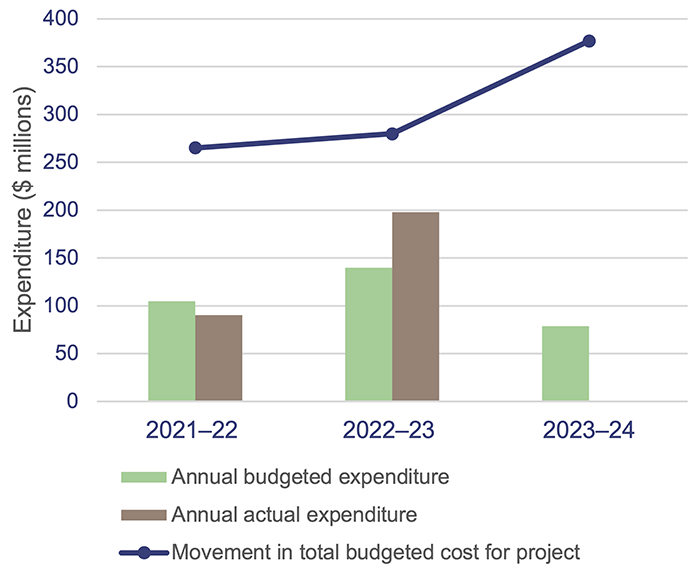
Figure 5G shows the annual budgeted expenditure for the Satellite Hospitals Program compared to the actual recorded expenditure. Expenditure in 2022–23 was over budget by 41 per cent.
|
The original (total) budget for the 4-year Satellite Hospitals Program was $265 million in 2021–22 and has increased to $377 million (42% increase from original budget) in the 2023–24 budget. |
Queensland Government state budget capital statements and information provided by the Department of Health.
6. Demand for health services
Demand for health services in Queensland continues to increase. A growing and ageing population, and a shortage of general practitioners, are the main contributing factors. However, demand trends vary between geographic areas, and are affected by other factors such as:
- differences in underlying patterns of disease and injury
- the number of hospitalisations needed to treat health conditions
- the availability and accessibility of general practitioners.
In Chapter 4, we discussed the continued workforce pressures (as we reported in Health 2022) that reduced the capacity of the health system to address demand pressures. In this chapter, we:
- show how these workforce pressures continue to impact on waitlist times for specialist outpatients and ambulance responses
- provide an update on analysis we have performed in 3 previous reports
- Improving access to specialist outpatient services (Report 8: 2021–22), where we reported that Queensland’s growing and ageing population was increasing pressure on demand for the public health system in a time of significant fiscal constraints. As a result, some patients were waiting longer than they should for a specialist outpatient appointment
- Health 2021 and Health 2022, where we analysed and provided insights on the root causes of ambulance response times.
Chapter snapshot (key demand measures 2022–23)
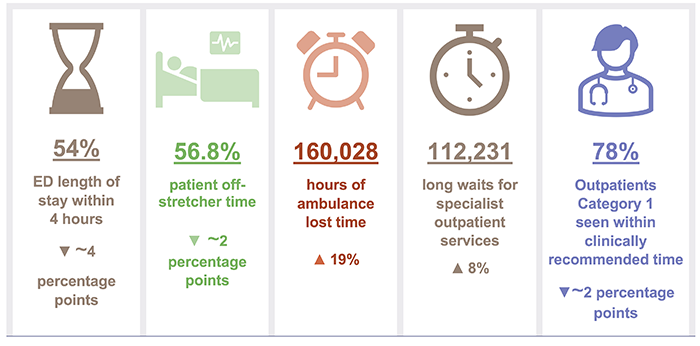
Notes: The increase/decrease in numbers in this snapshot shows the variation between the 2022–23 and 2021–22 financial years. Emergency department (ED) length of stay within 4 hours (ELOS) (see pages 26-27), patient off-stretcher time (POST) (see page 30), ambulance lost time (see page 31) figures, and Outpatients Category 1 seen within clinically recommended time (see pages 32–33) are reported against Queensland’s top 26 reporting hospitals (refer to Appendix J). Lost time and POST data include priority codes 1 and 2 (emergency and urgent cases). ~ means approximately.
Emergency department presentations
Demand for emergency department services continues to grow, and more people are arriving at emergency departments with complex issues. From 2021–22 to 2022–23, the number of presentations (excluding fever clinics episodes) at emergency departments at the top 26 reporting hospitals in Queensland increased by 1.2 per cent. Over the last 5 years, the growth has been 11 per cent.
The hospital and health service areas experiencing the largest increase in demand in the last 5 years are Cairns and Hinterland HHS (21 per cent), Sunshine Coast HHS (18 per cent), Darling Downs HHS (16 per cent), Townsville HHS (15 per cent), and Metro North HHS (13 per cent).
Figure 6A shows the cumulative annual growth in emergency department presentations by mode of arrival (ambulance and walk-ins) at the top 26 reporting hospitals over the last 5 years compared to Queensland’s population growth and ageing population over the same period.
It shows that the increase in emergency department presentations arriving by ambulance was greater than the increase in walk-in presentations in 2022–23, and that all emergency department presentations are increasing faster than the population is growing.
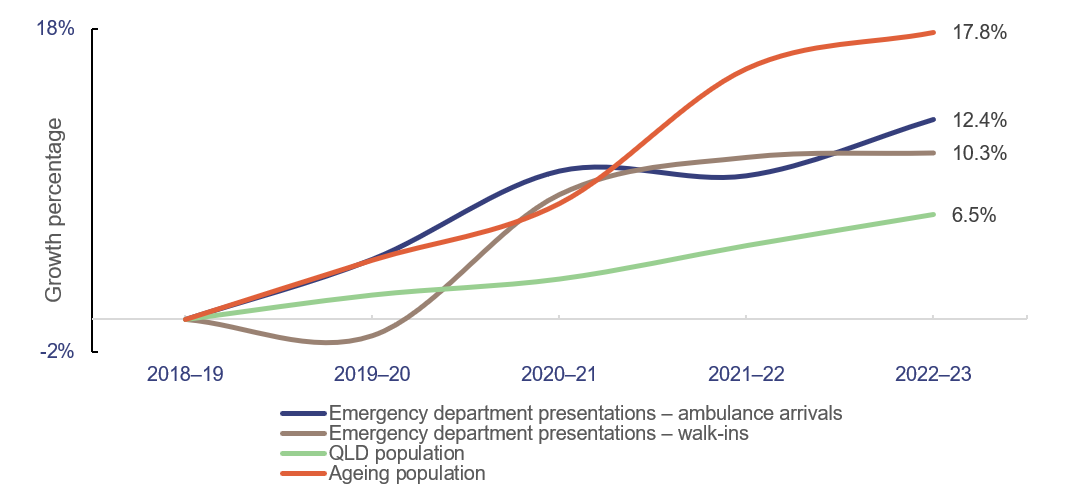
Note: Ageing population refers to the population aged 65 years and older. Emergency presentations data excludes fever clinic (COVID-19 tests) episodes. QLD – Queensland.
Emergency department presentations: Queensland Audit Office from the Queensland Health – System Performance Branch for the top 26 reporting hospitals. Queensland population: quarterly Australian Bureau of Statistics population data (latest available data as of March 2023) Ageing population: Queensland Audit Office, based on projected figures from 2020 and 2022 Chief Health Officer report and 2021 Census.
In 2022–23, 54 per cent of presentations for the top 26 reporting hospitals in Queensland were completed within 4 hours, down from 58 per cent in 2021–22.
In all states of Australia, more patients are staying longer in emergency departments and fewer emergency department visits are completed in 4 hours or less. In 2021–22, Queensland ranked third out of Australian states for the percentage of emergency department presentations with a length of stay of 4 hours or less. With 61.4 per cent, it was only behind Western Australia (64.6 per cent) and New South Wales (64.2 per cent), as shown in Figure 6B.
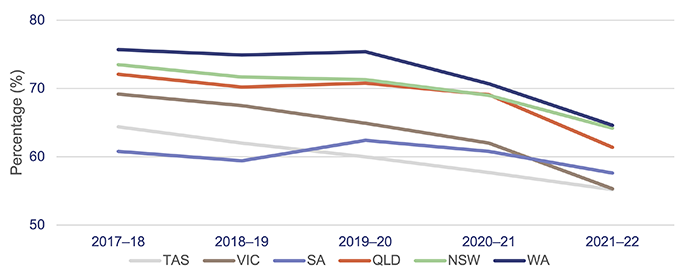
Notes: TAS – Tasmania; VIC – Victoria; SA – South Australia; QLD – Queensland; NSW – New South Wales; WA – Western Australia. Data is for all hospitals across the states. Latest-available information is up to the 2021–22 financial year. The target for emergency length of stay of 4 hours or less ranges between 75 to 90 per cent across the states; the target for Queensland is 80 per cent.
Queensland Audit Office, from Australian Institute of Health and Welfare, My Hospitals data.
Ambulance services
In this section, we provide an updated analysis of the demand for ambulance services, and Queensland Health’s performance against:
- response times (time from when a call to 000 is answered to when an ambulance arrives at the scene of an emergency)
- patient off-stretcher time (POST), which measures the percentage of patients transferred to the care of an emergency department within 30 minutes
- ambulance lost time, which is measured as the amount of time greater than 30 minutes that a patient remains on Queensland Ambulance Service stretchers.
Demand for ambulance services keeps increasing
The overall demand for ambulance services (emergency and urgent incidents, or Code 1 and 2) has grown by 11 per cent in the last 5 years, with the largest increase occurring from 2018–19 to 2020–21 (7 per cent). Over the last 5 years, Queensland Ambulance Service have attended more complex and higher-priority cases and have experienced a decrease in less complex, yet urgent cases. Since 2018–19:
- code 1 incidents (emergency) have increased by 33 per cent
- code 2 incidents (urgent) have decreased by 9 per cent.
The increase in ambulance demand for emergency cases is driven by an increase in population (especially the increase in people aged 65 years and over) and shifting demographics. According to the 2021 census, around 29 per cent of Queenslanders have one or more long-term health conditions. This contributes to an increase in more complex cases requiring ambulance services.
The number of ambulance incidents (code 1 and 2) reported under the mental health category has increased by 32 per cent over the last 5 years, from about 48,300 incidents in 2018–19 to about 63,800 in 2022–23.
Queensland continues to be the Australian state with the highest number of ambulance incidents per 1,000 population. It has been since 2006–07 (which is the earliest data available in the report on government services).
A likely key reason for this is that the Queensland Ambulance Service is publicly funded. New South Wales has adopted a user‑pays model, while Victoria, South Australia, and Western Australia use subscriber models. Figure 6C shows the number of ambulance incidents by state from 2018–19 to 2021–22.
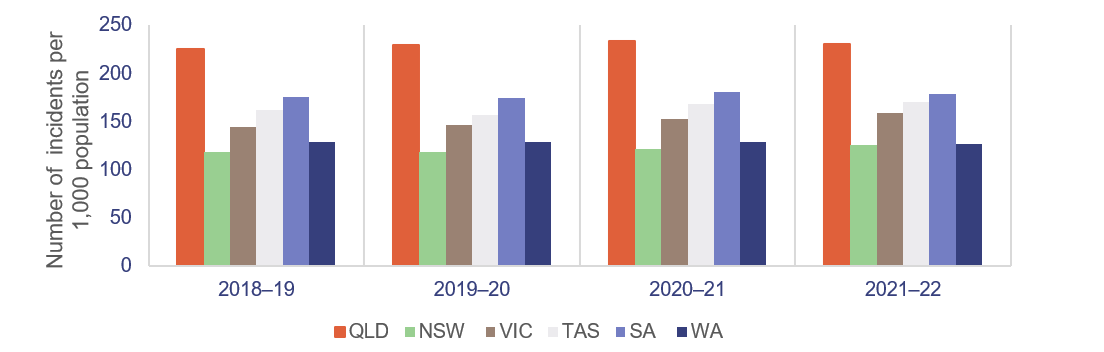
Notes: QLD – Queensland; NSW – New South Wales; VIC – Victoria; TAS – Tasmania; SA – South Australia; WA – Western Australia. Data is for all hospitals across the states. Latest-available information is up to the 2021–22 financial year. Population rates are derived using the 31 December estimated resident population of the relevant financial year.
Queensland Audit Office, from Productivity Commission, Report on Government Services 2022 Part E Section 11 Ambulance Services.
Despite having the highest number of responses in Australia in proportion to population and a 33 per cent growth in code 1 incidents over a 5-year period, the Queensland Ambulance Service continues to achieve better response times for emergency cases (code 1) than most other jurisdictions, as shown in Figure 6D.
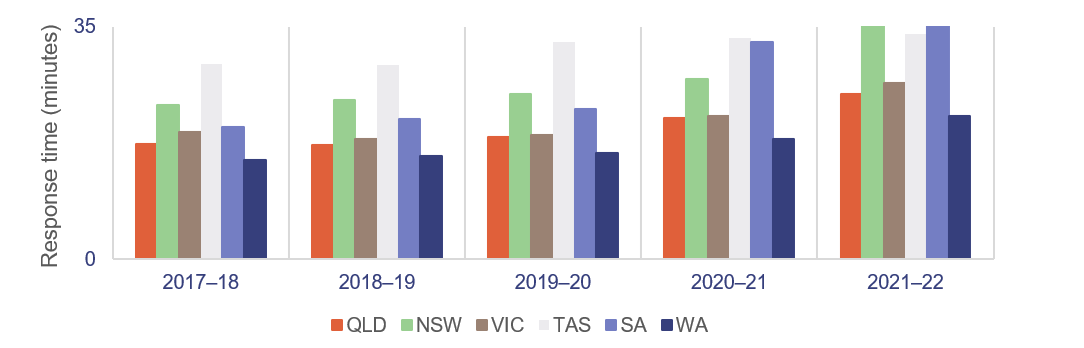
Notes: QLD – Queensland; NSW – New South Wales; VIC – Victoria; TAS – Tasmania; SA – South Australia; WA – Western Australia. Data is for all hospitals across the states. Latest-available information is up to the 2021–22 financial year. The 90th percentile refers to the time in which 90 per cent of emergency incidents are responded to.
Queensland Audit Office, from Productivity Commission, Report on Government Services 2022 Part E Section 11 Ambulance Services.
Ambulance response times
As we stated earlier, ambulance response times measure how long it takes from when a 000 call is answered to when an ambulance arrives at the scene.
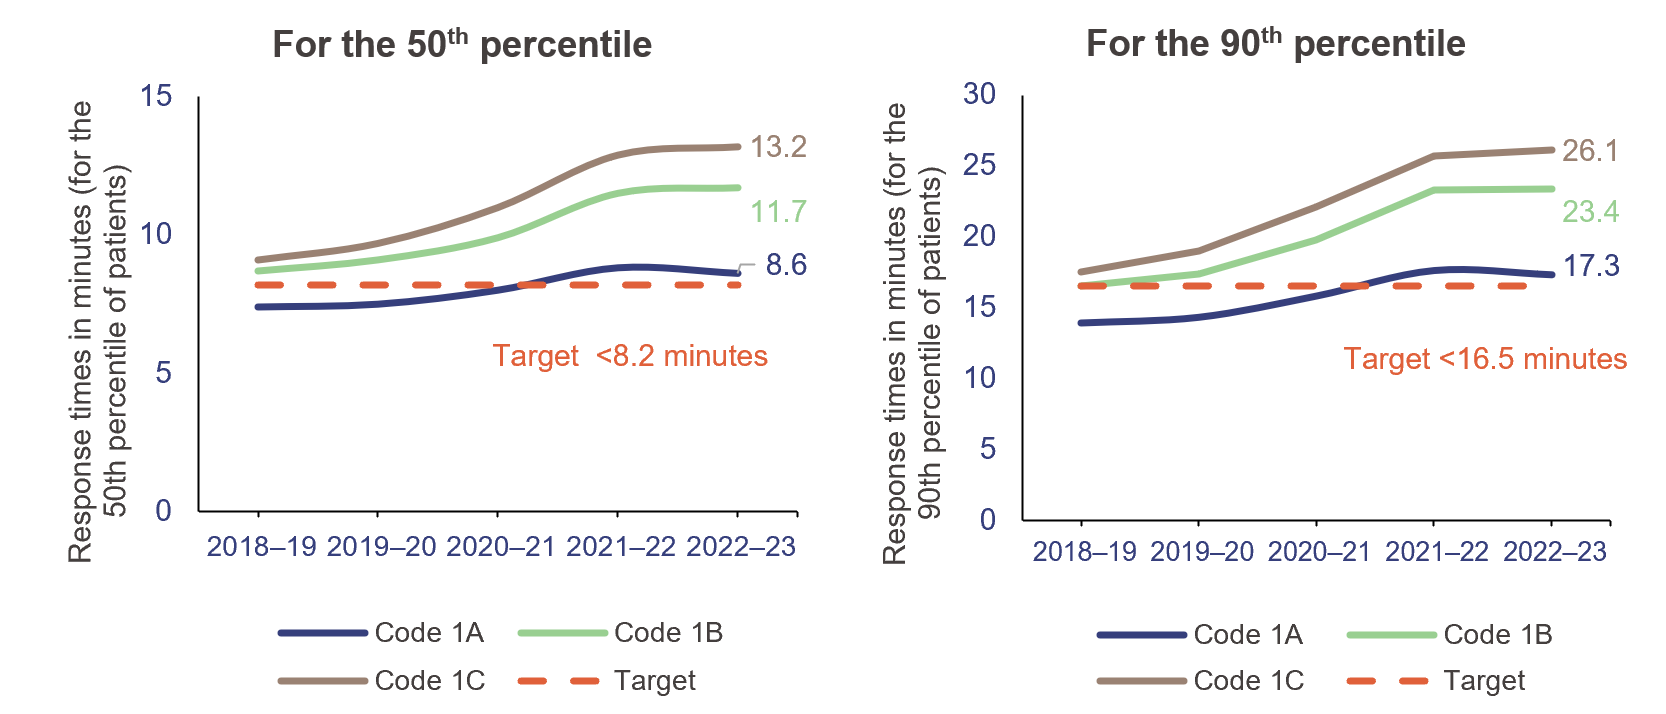
Performance targets for response times are measured in minutes for emergency code 1, but only for the:
- 50th percentile – the Queensland Ambulance Service expects that 50 per cent of ambulances respond to emergency incidents (code 1) in less than 8.2 minutes
- 90th percentile – the Queensland Ambulance Service expects that 90 per cent of ambulances respond to emergency incidents (code 1) in less than 16.5 minutes.
Code 1 response times
Code 1 incidents are potentially life threatening events that require the use of lights and sirens.
There were 523,400 code 1 incidents in 2022–23 (57 per cent of total code 1 and 2 incidents).
In 2022–23, the Queensland Ambulance Service did not meet its response time performance targets for code 1, as shown in Figure 6E. It has not met its response time targets for priority code 1A (actual time‑critical) since 2020–21.
Code 1A is ‘actual time-critical’, code 1B is ‘emergent time critical’, and code 1C is ‘potential time critical’.
Queensland Audit Office, from data received from the Queensland Ambulance Service reporting system.
Code 2 response times
Code 2 incidents may require a fast response, but do not require lights and sirens. Incidents in code 2A are those that require ‘urgent response’ but are not critical.
There were 407,700 code 2 incidents in 2022–23 (43 per cent of total code 1 and 2 incidents). Response times for code 2A slightly decreased from 60.9 minutes in 2021–22 to 60.3 minutes in 2022–23 (for the 90th percentile).
The Queensland Ambulance Service has not set performance targets for code 2 incidents. This is because its focus is on ensuring it is responding to the most urgent cases.
Moving patients off ambulance stretchers
Queensland’s target is to have 90 per cent of patients transferred off stretchers and into the care of an emergency department within 30 minutes (the clinically appropriate time frame recommended in July 2012 in Queensland’s Metropolitan Emergency Department Access Initiative report).
We note that POST is not a performance measure for the Queensland Ambulance Service – it is a measure of the performance of HHSs. It provides an indicator of system-wide issues due to lack of capacity in public hospitals.
Queensland Health has not met the POST performance measure at the statewide level for the past 9 years.
The percentage of patients transferred off stretchers in less than 30 minutes has shown a significant downward trend in the past 5 years. As of 30 June 2023, the overall POST performance was 56.9 per cent – a decrease of around 2 percentage points since 2021–22. Consistent with previous years, none of the 14 HHSs with a top 26 reporting hospital met its POST target, except North West HHS.
Figure 6F shows the overall POST performance for the top 26 reporting hospitals in Queensland over the last 5 years.
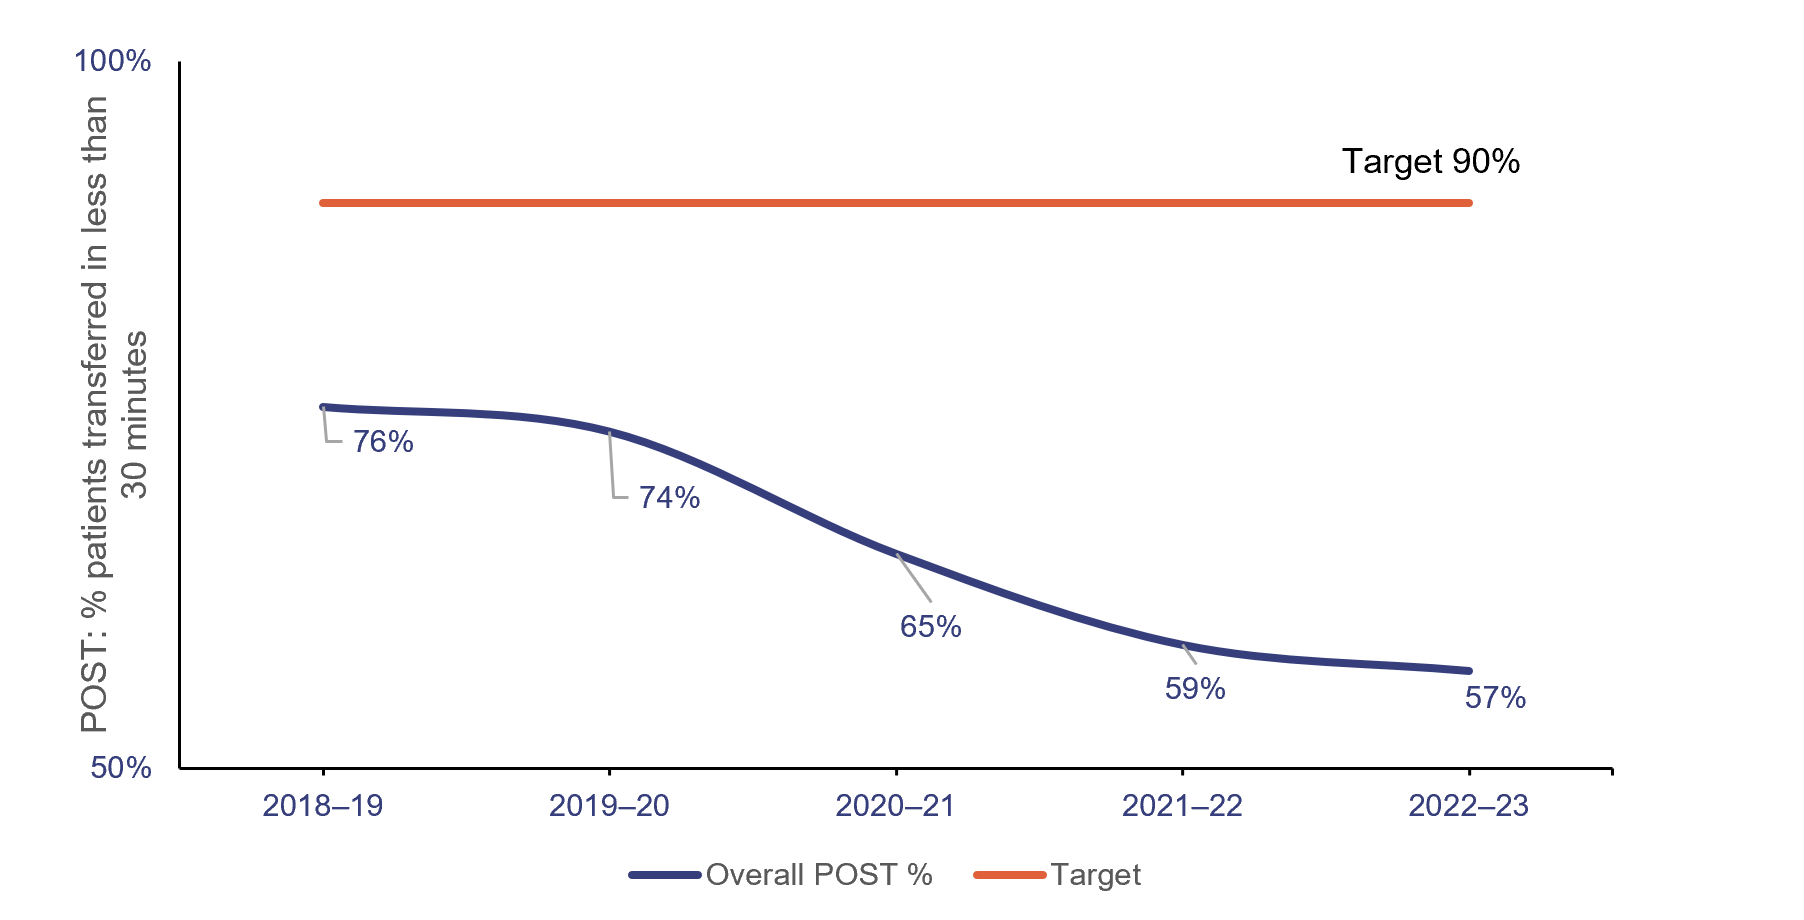
Queensland Audit Office, from data received from the Queensland Ambulance Service reporting system.
The inability to meet this target is linked to the number and complexity of patients presenting for treatment (both walk-ins and ambulance presentations), availability of ward beds, efficiency of hospital discharge processes, and the limited availability of specialists to attend patients in emergency departments.
When there is a patient off-stretcher delay, patients are cared for by Queensland Ambulance Service paramedics until formal transfer of care to the emergency department takes place. Faster off-stretcher times ensure ambulances are available to respond to those patients waiting in the community.
Although the statewide POST target continues to be 90 per cent in the service delivery statements for 2023–24 (service standards agreed as part of the state budget), the department has tailored this target for each hospital and health service in its 2023–24 service agreements with each HHS. The new targets have been set to the actual POST achieved by each HHS as of 30 June 2019.
Ambulance lost time
Figure 6G shows ambulance lost time (measured as the amount of time greater than 30 minutes that a patient remains on Queensland Ambulance Service stretchers) in total hours for code 1 and 2 incidents at the top 26 reporting hospitals, for the last 5 financial years.
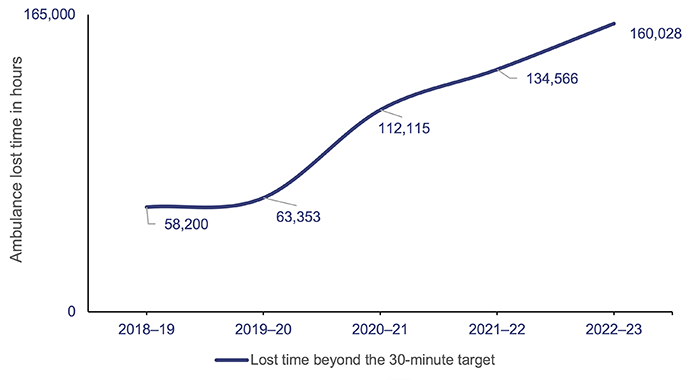
Queensland Audit Office, from data received from the Queensland Ambulance Service reporting system.
A key factor in the increase in ambulance lost time and the decrease in POST performance is the increase in emergency department demand from both ambulance patients and walk-in patients. This has led to significant increases in the time it takes to transfer a patient to an emergency department.
Figure 6H shows, by HHS, the POST performance against accumulated ambulance lost time for the top 26 reporting hospitals for code 1 and 2 incidents.
The HHSs serving heavily populated areas have the lowest performance when it comes to moving patients off stretchers within 30 minutes, and they have the highest amount of ambulance lost time as a result.
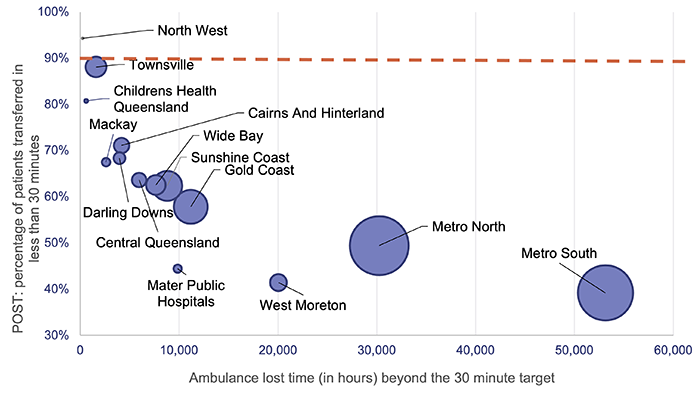
Notes: Data by HHSs only includes the top 26 reporting hospitals. The size of the circles corresponds to the number of patients transferred to emergency departments by the Queensland Ambulance Service. The orange line represents the POST target.
Queensland Audit Office, from data received from the Queensland Ambulance Service reporting system.
Specialist outpatient services
We audited specialist outpatient services in Improving access to specialist outpatient services (Report 8: 2021–22). Since then, the COVID-19 pandemic added further pressure to Queensland Health’s capacity to ensure patients waiting for a specialist outpatient service were seen within the clinically recommended times. In this section, we update key graphs from that report, and from Health 2022 (Report 10: 2022–23), using data provided by the department.
A long wait is when a patient has waited longer (by one day or more) than the clinically recommended time for a specialist appointment.
Seen-within time measures whether patients attend their first appointment within clinically recommended times.
Queensland’s public hospitals use 3 urgency categories for specialist outpatient services, each with a target seen-within time (see Figure 6I). Queensland Health calculates waiting time from the date a patient is placed on a specialist outpatient waiting list to the date they are first seen by a clinician (referred to as the initial service event), excluding any days when a patient was not able to receive care for a clinical or personal reason.
| Urgency category | Appointment required within | Target seen-within time (service delivery statement) |
Target seen-within time (service agreements) |
|
Category 1 |
30 calendar days |
83% |
90% |
|
Category 2 |
90 calendar days |
- |
85% |
|
Category 3 |
365 calendar days |
- |
85% |
Note: The Queensland Health service delivery statements have a target for specialist outpatients seen-within time for category 1 only, since 2020–21. However, the service agreements the department has with the HHSs have set a target for all 3 categories to support timely access to specialist outpatient services for urgent patients, while maintaining a focus on reducing the total number of long wait patients.
Queensland Audit Office from Specialist Outpatient Services Implementation Standard and Queensland Health service delivery statements (SDS) and service level agreements (SLA).
Figure 6J shows the percentage of outpatients seen by a specialist within clinically recommended times for each category. Queensland Health consistently met or closely met the target for category 1 patients from 2016–17 to 2020–21, but did not meet the targets for any of the 3 categories in 2021–22 and 2022–23. In fact, the 2022–23 results were the lowest of the last 8 years.
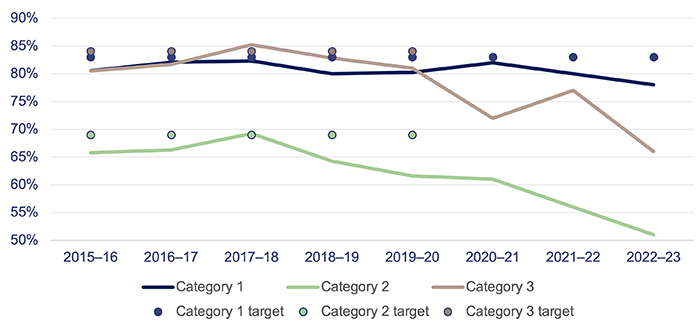
Note: Target used is per service delivery statements. There were no targets for category 2 and 3 patients in 2020–21 to 2022–23 due to the impacts from responding to COVID-19 and the system’s focus on reducing the volume of patients waiting longer than clinically recommended.
Queensland Audit Office, from Queensland Health specialist outpatient data collection.
Despite hospitals not achieving these seen-in-time targets, the number of patients being seen has increased by 9 per cent from 2021–22 (see Figure 6K). While more patients are being seen, the increase in the number of patients listed as long waits since 2020–21 due to the ongoing impacts of COVID-19 means the HHSs have a large backlog of patients to service, while new patients are being placed on the waitlists. This means less patients are being seen in time.
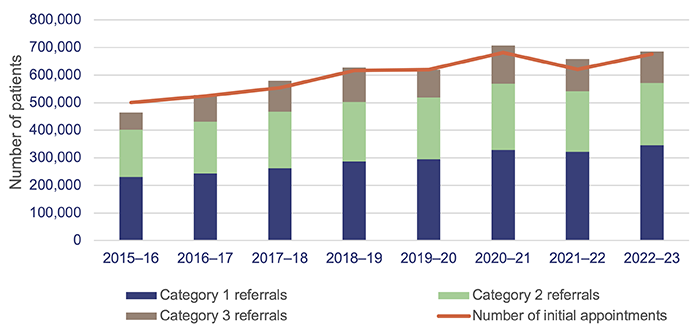
Queensland Audit Office, from Queensland Health specialist outpatient data collection.
Figure 6L shows that the total number of long waits halved in the first 3 years of Queensland Health’s Specialist Outpatient Strategy, which commenced in July 2015. But the total number of long waits as of 1 July 2023 is 37 per cent higher than it was on 1 July 2015.
In 2021–22, the total number of long waits increased by 80 per cent due to the impacts of COVID-19 on system capacity and continued to increase by a further 8 per cent in 2022–23.
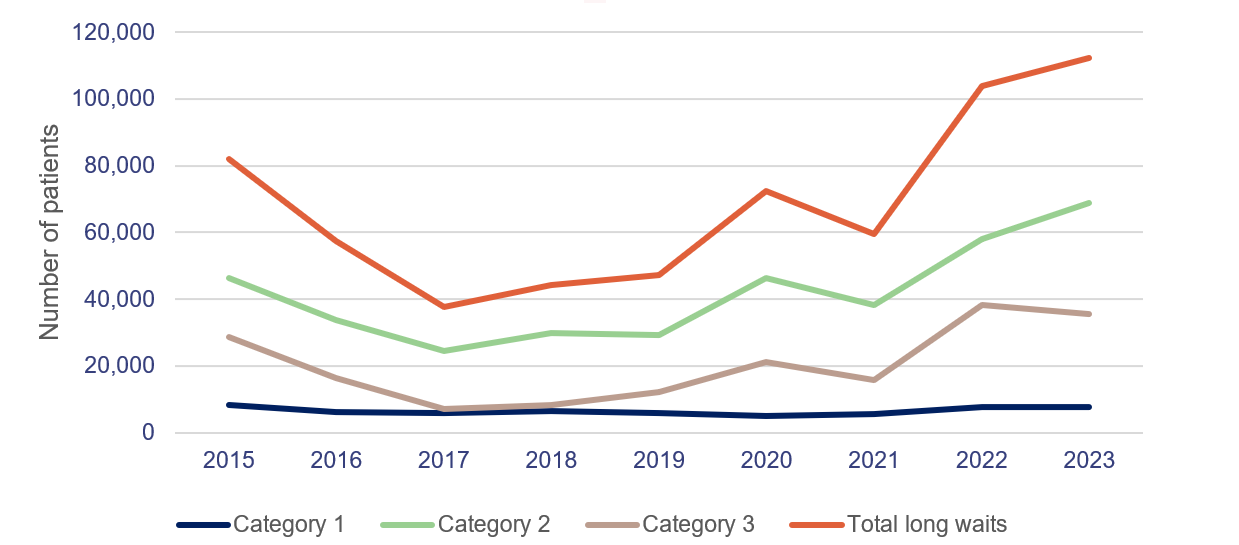
Note: All figures are as at 1 July.
Queensland Audit Office, from Queensland Health specialist outpatient data collection.
Virtual healthcare
In its service agreements with HHSs, the department has provided an incentive for increasing virtual models of care to decrease pressure on facilities. HHSs are expected to deliver 30 per cent of outpatient service events through virtual care.
In 2023–24, HHSs will be paid an incentive of $73.50 per virtual care service event above the 30 per cent target and up to an agreed upper limit (in 2022–23, 8 out of 16 HHSs exceeded their target). The department has allocated $20 million for this incentive.
2023 hospital and health service dashboard
Find your local hospital and health service (HHS) in this Queensland Audit Office visualisation to explore its financial audit data for 2023 and compare to other hospital and health services. This interactive tool includes data on revenue, expenses, assets, liabilities and activity measures.