
Overview
Queensland’s health sector entities work together to provide accessible healthcare for the state and support the wellbeing of people in their communities. They do this while facing financial pressures, increasing demand for services, workforce pressures, and an ageing and growing population.
Tabled 20 January 2026.

Report on a page
This report summarises the audit results of Queensland Health entities, which include the Department of Health (the department) and 16 hospital and health services (HHSs). It also summarises the audit results for 13 hospital foundations, 5 other statutory bodies, and 3 entities controlled by other health entities.
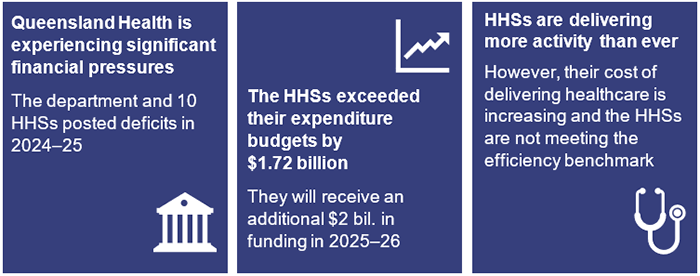
Entities face challenges in managing the cost of services
Queensland’s population has continued to grow, placing additional pressures on the public health system. The number of elderly Queenslanders has also increased, which has a direct impact on demand for health services.
The Queensland public health system has responded by providing an 11.7 per cent increase in services this year. The increased activity has come at a financial cost, with the department and HHSs reporting a combined financial deficit of $960.6 million for the year, higher than ever previously reported.
The financial deficit reflects additional expenditure on employee costs, supplies and services, and asset maintenance and construction. The number of staff employed by the department and HHSs increased by 5.6 per cent this year. This, along with operating expenses, is expected to continue increasing in coming years as the department responds to the additional demands of a growing and ageing population.
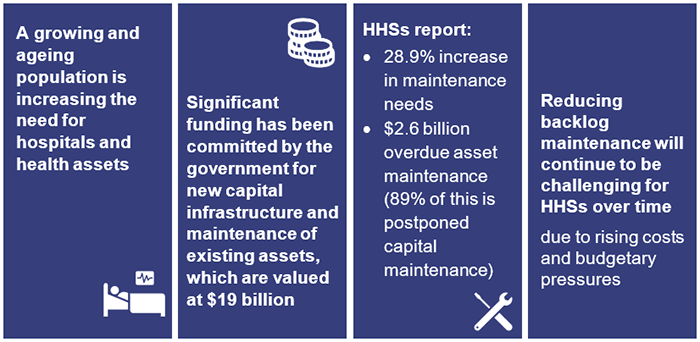
Queensland Health is responsible for maintaining hospitals and related assets valued at $19 billion. It is also responsible for planning for future needs, constructing new hospitals, and expanding existing ones. HHSs report that the cost of the maintenance they have deferred on their assets grew by a further 28.9 per cent to $2.6 billion as at 30 June 2025. The maintenance that is being deferred is impacting on the delivery of some health services. This includes delaying patient treatment or requiring patients to be diverted to other locations for treatment. The government has committed additional funding to address historic shortfalls in funding.
Financial statements are reliable, but controls over information systems still need to be strengthened
Health sector entities’ financial statements are reliable and their internal controls are also generally effective. However, we continue to find deficiencies in information technology (IT) access and security controls. Health entities are considered attractive targets by cyber criminals, due to the personal information they hold and the potential for profit. We therefore consider these access control deficiencies as significant. While management is working to address these complex issues, they need to take more timely action to resolve the deficiencies.
Addressing demand for health services
Emergency departments continue to not meet the 4-hour target to treat and discharge patients, as is the case with other states and territories. The performance of emergency departments also impacts on ambulance services, where time is lost due to delays in transferring patients from ambulances into hospital care. Queensland Ambulance Service response times are better than in other jurisdictions but still below Queensland’s target.
Queensland Health referred more specialist outpatients for treatment during the year than last year, but it continues to fall behind on its time targets, and the number of outpatients classified as ‘long waits’ has grown by 15 per cent this year.
1. Recommendations
We have made one recommendation for hospital and health services (HHSs).
| Development of a plan for managing conflicts of interest for HHS board members |
|
We also found control weaknesses that require further action on the security of information systems used by health entities. We reported these weaknesses to the Department of Health. Further details relating to the weaknesses in information systems have been included in our report Information systems 2025 (Report 6: 2025–26).
Further action needed on prior year recommendations
| Theme | Summary of recommendation | Health report |
|---|---|---|
| Governance and internal controls | Review the status of outstanding audit issues and ensure they are resolved promptly. (Chapter 3 in this year’s report) | Report 12: 2020–21 |
| Asset management | Address inconsistencies in calculating deferred maintenance. (Chapter 5 in this year’s report) | Report 6: 2023–24 |
| Address the backlog of asset maintenance, prioritising high-risk maintenance. (Chapter 5 in this year’s report) | Report 12: 2020–21 | |
Employee expenses
| Improve controls over rostering and approval of overtime, including finalising the current rollout of the electronic rostering system and extending it further. (Chapter 3 in this year’s report) | Report 6: 2023–24 |
| Information systems | Strengthen information and cyber security controls, including progressing the identity and access management maturity project and strengthening password controls. (Chapter 3 in this year’s report) | Report 10: 2022–23 |
| Strengthen the security of information systems by assigning only the minimum level of access to staff, monitoring the activity of users with privileged access, and implementing strong password controls and multi-factor authentication. (Chapter 3 in this year’s report) | Report 12: 2020–21 | |
| Procurement and contract management | Strengthen procurement and contracting controls, including by having contract management systems and maintaining up-to-date contract registers. (Chapter 3 in this year’s report) | Report 12: 2021–22 |
We have included a full list of prior year recommendations and their status in Appendix E.
Reference to comments
In accordance with s. 64 of the Auditor-General Act 2009, we provided a copy of this report to relevant entities. In reaching our conclusions, we considered their views and represented them to the extent we deemed relevant and warranted. Any formal responses from the entities are at Appendix A.
2. Entities in this report
This report summarises the financial audit results for health sector entities.
The Department of Health (the department) is responsible for the overall management of Queensland’s public health system. It works with hospital and health services, which are independent statutory bodies, to deliver health services. It contracts with each hospital and health service’s board through annual service agreements. These establish the health services the department is buying, and the funding that will be provided to each board for delivery of those services.
Figure 2A outlines the main entities and the relationships between them. Appendix F provides a complete list of the health sector entities for which we have issued an audit opinion.
Note: * Mater Misericordiae Health Service Brisbane also provides public health services under a service agreement with the Department of Health.
Queensland Audit Office.
3. Results of our audits
This chapter provides an overview of our audit opinions for entities in the health sector. It also provides conclusions on the effectiveness of the systems and processes (internal controls) the entities use to prepare financial statements.
Chapter snapshot
Audit opinion results
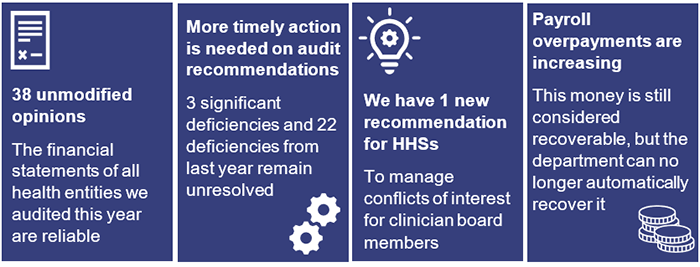
We issued unmodified audit opinions for all health sector entities in Queensland, including the Department of Health (the department), the 16 hospital and health services (HHSs), the 13 hospital foundations, 5 other statutory bodies, and 3 controlled entities. This means that their financial statements can be relied upon. We issued an unmodified audit opinion with an emphasis of matter for 2 controlled entities – we include an emphasis of matter to help users better understand issues in financial statements. It does not change the audit opinion.
All entities reported their results within their legislative deadlines, except for Mackay Hospital Foundation and Queensland Mental Health Commission. Both entities had delays in meeting their legislative deadlines due to resourcing challenges within their financial accounting teams. We signed our audit opinion for Mackay Hospital Foundation 4 days after the legislative deadline, and Queensland Mental Health Commission 10 days after. Appendix F provides detail about the audit opinions we issued for 38 entities in 2025.
Entities tabled their annual reports by the legislative deadline
The timely publication of annual reports, which include audited financial statements, enables parliament and the public to assess the financial performance of public sector entities while the information is still current.
The department, the HHSs, hospital foundations, and other health statutory bodies all tabled their annual reports prior to the legislative deadline of 30 September 2025. Their tabling dates were as follows:
- The department, 13 HHSs, all 13 hospital foundations, and 4 other health statutory bodies tabled on 26 September
- The remaining 3 HHSs and one other health statutory body tabled on 29 September.
We continue to qualify our audit opinion for compliance statements regarding Queensland Health’s aged care facilities
We issued a qualified audit opinion for the annual prudential compliance statement for Queensland Health’s aged care facilities. In this statement, Queensland Health is required to outline to the Australian Government how it has managed refundable accommodation deposits, accommodation bonds, and entry contributions from aged care residents.
We issue a qualified opinion for the annual prudential compliance statement when Queensland Health has not complied with the requirements of the Aged Care Act 1997 (the Act), with the exceptions noted in the opinion. We qualified our audit opinion because of 2 non-compliance issues with the Act. We identified instances where:
- Queensland Health had not complied with the requirement to enter into accommodation agreements within 28 days of a person’s entry to an aged care facility
- we were unable to determine whether refunds were paid within the time period required by the Act where the resident had passed.
We have qualified our opinion on this every year since 2017–18.
Changes to the aged care annual prudential compliance statement (APCS) The Commonwealth Aged Care Act 1997 requires that approved aged care providers who hold refundable accommodation deposits submit an annual prudential compliance statement. These statements help the Commonwealth monitor the financial health and compliance of aged care providers. The department is an approved provider under the Act and prepares a consolidated APCS in relation to the residential aged care facilities that are operated at 5 HHSs. The Commonwealth Aged Care Act 1997 has been replaced by the Commonwealth Aged Care Act 2024, which came into effect on 1 November 2025. The new Act brings many changes, including more detailed reporting as part of the APCS. This new legislation expands the reporting requirements for providers, including a requirement to report on care minutes – which are a record of the actual time spent delivering direct care to aged care residents. From 2025–26, all residential aged care providers will be required to submit an audited care minutes performance statement, which provides detailed information on:
From 1 November 2025, approved provider status will transfer from the department and will be required for each of the 5 HHSs that operate aged care homes that accept refundable accommodation deposits. This change means that the department will no longer be responsible for preparing and submitting the APCS. The responsibility for preparation and submission of the APCS will move to each of the 5 HHSs. In 2025–26, we will provide a separate auditor’s report on the APCS for each HHS that operates an aged care facility. |
Appendix G lists the other audit and assurance opinions we issued.
Some entities do not prepare financial statements
Not all entities in the health sector produce financial statements. Appendix H lists the entities not preparing financial statements and the reasons why.
Generally effective internal controls
Section snapshot
We assess whether the systems and processes (internal controls) entities use to prepare financial statements are reliable. We report any deficiencies in the design or operation of those controls to management for their action. The deficiencies are rated as either:
- significant deficiencies, which are those of higher risk that require immediate action by management, or
- deficiencies, which are those of lower risk that can be corrected over time.
Overall, to the extent that we tested them, we found the internal controls that health sector entities have in place to ensure reliable financial reporting are generally effective, but they can be improved.
While we were able to rely on the internal controls for the purposes of our audits, we continue to identify deficiencies in information systems controls at the department. There are also unresolved deficiencies from prior years.
These deficiencies indicate the entities need to strengthen controls to manage cyber security risks and prevent inappropriate access to the information they hold. We acknowledge the complexity of the systems, and that the department may need extra time to resolve these issues.
During our audits in 2024–25, we communicated with those charged with governance the need for them to give greater priority to resolving these issues within the agreed time frames.
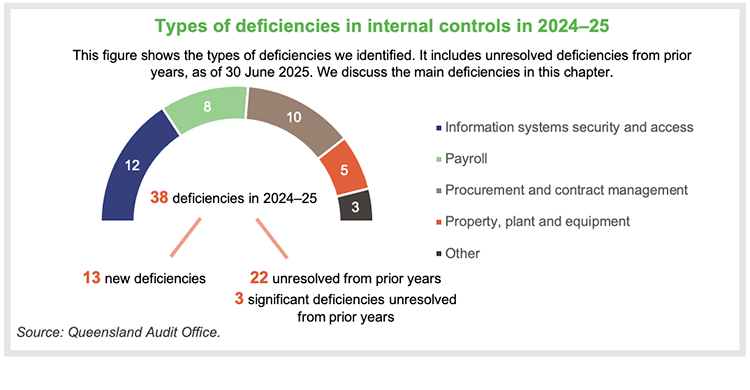
This year, we have reported 3 significant deficiencies – all of which remain unresolved from prior years – and 35 deficiencies – 13 new and 22 that remain unresolved from prior years.
The significant deficiencies that remained unresolved from prior years relate to:
- control of access to information systems at the department – first raised in 2023–24
- our qualified audit opinion of the aged care annual prudential compliance statement – qualified each year since 2017–18
- ineffective controls over staff overtime payments at one HHS – first raised in 2022–23.
We continue to obtain updates from management on how they are addressing the significant deficiencies.
The department and HHSs should continue to work towards resolving these significant deficiencies within the time frames they have set for themselves.
Health sector entities have room for improvement in several areas
Information systems controls and cyber security

| In our Health 2024 (Report 8: 2024–25) report, we identified 13 control deficiencies in relation to security of and access to information systems at the department. Of these, 12 remain unresolved as at 30 June 2025. We also identified one new deficiency at the department in 2024–25. |
We have provided further details of information systems deficiencies, including the reasons why deficiencies remain unresolved, in our Information systems 2025 (Report 6: 2025–26) report.
Procurement and expenses – contracts

| The department and HHSs have worked to resolve several procurement control deficiencies, but we continue to identify new weaknesses in their processes. There are currently 10 outstanding deficiencies relating to procurement controls. We raised 4 deficiencies this year. Of these, 4 were resolved during the year; 10 remain unresolved. |
The nature of the procurement issues we reported this year include:
- non-compliance with the Queensland Government procurement guideline, which requires entities to publish details of significant contracts they have awarded
- procurement processes and policies that do not cover documenting alternative options to engaging a consultant or contractor.
Property, plant and equipment

| We also continue to identify deficiencies in property, plant and equipment processes at the HHSs. We raised 4 deficiencies this year. All remain unresolved. |
The nature of the property, plant and equipment issues we reported this year include:
- errors in the reporting of leased assets
- delays in recording buildings once construction had been completed.
Payroll rostering and overtime

| In Health 2023 (Report 6: 2023–24), we identified a significant deficiency at one HHS relating to ineffective controls over the approval of unplanned overtime. This specifically related to the approval of rosters and timely approval of attendance variation and allowance claim forms. These controls are important in managing unplanned overtime and penalties and in helping to prevent overpayments. This issue remains unresolved from 2023. |
We also reported deficiencies at 3 other HHSs relating to the approval of rosters and overtime. These remain unresolved from last year. While the respective HHSs are continuing to address these issues, they had not yet been resolved by the time we completed our 2024–25 audits.
During the year, we identified an additional instance at another HHS where controls over the approval of roster changes, including allowances and overtime, were ineffective.
As a result, there are now:
- 2 HHSs with issues relating to ineffective controls over paper-based roster variation forms
- 4 HHSs with ineffective controls over rostering approvals.
Another payroll issue that we have reported this year includes a lack of controls for ensuring human resources (HR) delegations set up in the payroll system are consistent with the approved HR delegations.
The department and 16 HHSs should continue to strengthen overtime and payroll controls and implement our recommendations. As discussed further below, the extension of the electronic rostering system will help.
Payroll overpayments

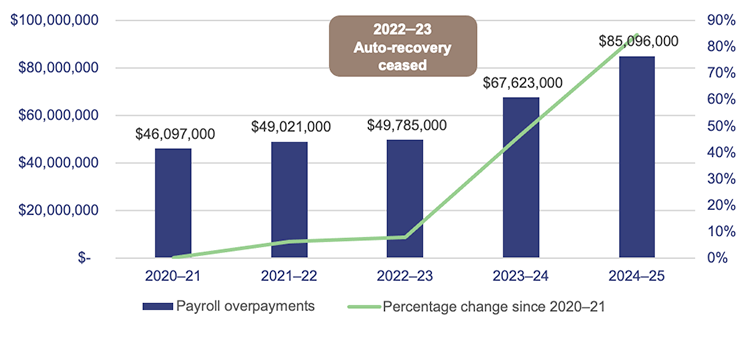
| The department’s 2024–25 financial statements reported outstanding payroll overpayments of $85.1 million, up from $67.6 million last year. This is an increase of $17.5 million, or 25.8 per cent. |
The medical and nursing/midwifery cohorts make up the largest proportion of the overpayment balance, representing approximately 41 per cent and 35 per cent respectively.
Figure 3A shows that these overpayments have increased by $39 million or 84.6 per cent over the last 5 years, with a steep increase first occurring in 2023–24. In addition, the department wrote off $2.7 million of overpayments as unrecoverable this year.
The department’s payroll system was previously programmed to auto-recover payroll overpayments. However, the department stopped its automated recovery of payroll overpayments during 2022–23 to ensure compliance with the Industrial Relations Act 2016. That Act allows employers to recover overpayments related to absences from work, but other types of overpayments require an employee’s consent to recover.
The ceasing of automated recovery of overpayments, and the resulting need to obtain employee consent to enter repayment plans, has contributed to the growth in the total outstanding balance reflected in Figure 3A.
Queensland Audit Office, from Department of Health financial statements.
There are approximately 116,000 full-time equivalent employees across the department and HHSs. Approximately 91.5 per cent of these full-time equivalent employees work at HHSs and the Queensland Ambulance Service (QAS). The nature of HHS and QAS rostered work means these employees attract a large volume of shift penalties, overtime, and other allowance payments.
The department continues to closely monitor and report on trends in payroll overpayments, including reasons for overpayments, and actions taken to recover them. Its reporting shows that the average value of new overpayments each fortnight in 2024–25 was $1.4 million ($1.2 million in 2023–24).
The department estimates that 75 per cent of payroll overpayments are due to the late submission of approved payroll information, and it is working on strategies to address this. Among these is the rollout of an electronic rostering system – the Integrated Workforce Management (IWFM) system – described below.
Integrated Workforce Management system

| In 2024–25, the department finalised the rollout of its electronic rostering system, IWFM, across all HHSs for nursing and midwifery staff. This group represents approximately 40 per cent of the HHS workforce and 38 per cent of the total cost of employee expenses. The IWFM system removes the need for forms to be completed manually and simplifies the roster-to-pay processes. |
The department plans to implement IWFM in a staged approach across the HHSs for other occupational groups, including doctors/medical officers, starting in 2025–26. Eight HHSs are expected to begin implementing this before 30 June 2026, with 4 of these expected to go live by that date. Medical officers account for approximately 12 per cent of the HHS workforce, and 24 per cent of the total cost of employee expenses.
Our initial testing of the IWFM system, specifically over the nursing and midwifery cohorts, indicates that the electronic rostering system has strengthened controls over the timeliness and appropriate delegation of roster approvals and roster variations. By replacing the previous non-IWFM roster approval processes and paper-based forms, the system reduces the risk of salary overpayments and supports more timely processing of rosters and variation forms.

| HHSs should continue to focus on resolving control deficiencies with roster and paper-based roster variation form approvals As IWFM has not yet been implemented across the doctors and medical officer cohort, HHSs should continue to maintain strong controls over roster approvals and paper-based roster variation forms during this transition, and work to resolve these control deficiencies. |
Management of conflicts of interest
The Hospital and Health Boards Act 2011 (the Act) was amended in 2025. As of 1 April 2026, it will require at least one member of each HHS board to be a clinician who is employed or engaged by that HHS. Previously, each HHS was required to have one clinician on its board, but this change now requires HHSs to commence including a clinician from their own HHS.
This change is aimed at giving frontline staff a voice in how HHSs are run. However, when a clinician employed by a HHS is also a member of that HHS’s board, there is potential for conflicts for them in both their employee role and board role. It is not common in the Queensland public sector for employees to be on the board, as one of the functions of a board is to provide independent oversight of the entity. For HHSs, this includes managing strategic issues, overseeing the HHS’s performance, developing and monitoring service plans and strategies, and responding to critical issues in the HHS.
There may be instances when a board member’s role will conflict with their duties as an employee of that HHS. For example:
- there will be a conflict between a clinician’s operational responsibilities for an area of a HHS where they may report to the HHS chief executive, and their board role, where they will oversee their chief executive’s performance
- a clinician responsible for managing risks and incidents in a clinical area will have a conflict when that is subject to oversight by the HHS board.
HHS boards are required to comply with the Code of Conduct for the Queensland Public Service, which requires any actual, potential, or perceived conflicts of interest to be identified and managed. The Act provides specific guidance to HHS boards on how to deal with disclosure of interests at meetings.
|
| HHS board members are designated persons under the Integrity Act 2009 and may request written advice from the Integrity Commissioner on an ethics or integrity issue This includes any conflicts of interest that arise from them being both a board member and an employee of the same HHS. |
Recommendation for the 16 HHSs Development of a plan for managing conflicts of interest for HHS board members
|
Self-assessments against the Queensland Audit Office’s Risk management maturity model
In 2024–25, as part of our annual audit, we asked the HHSs to self-assess the maturity of their risk management processes using our Risk management maturity model. This self-assessment tool helps entities to identify the maturity level they want to achieve and focus on key areas for development.
The 4 levels of maturity are as follows:
| Optimised | an entity is a leader of best practice for risk management |
| Integrated | an entity’s risk management practices are fundamentally sound; however, some elements could be improved |
| Established | an entity shows basic competency in risk management |
| Developing | an entity does not have key components of risk management, or they are limited |
In Figure 3B, we show the self-assessed maturity levels for the HHSs per region for each key attribute of risk management. All regions show similar maturity levels, except in ‘Achieving outcomes and innovation’.
This measures how the entity’s culture supports well-managed risk-taking to foster improvements and innovation. It is important that staff are supported by management in building an innovative and well-managed risk-taking culture, in order to seize opportunities. We include our key observations on strengths and opportunities for all HHSs from the completed maturity models below Figure 3B.
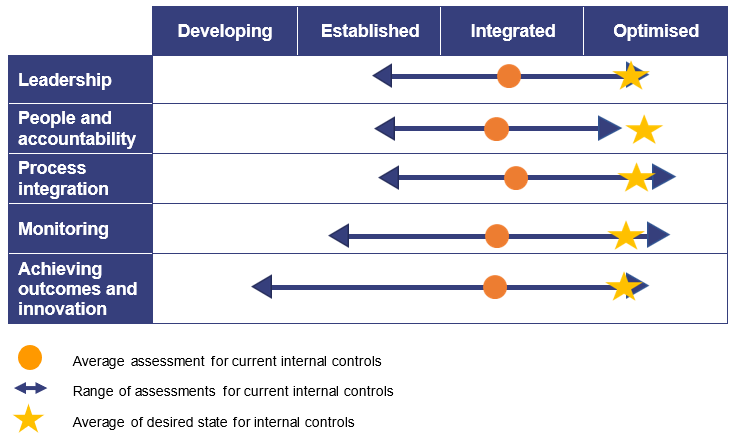
Hospital and health services’ completed self-assessments against the Queensland Audit Office Risk management maturity model – 2025.
| Observations | |
Strengths
| Opportunities
|
4. Financial performance and sustainability
This chapter analyses the financial performance, position, and sustainability of Queensland Health entities, which include the Department of Health (the department) and the 16 hospital and health services (HHSs). In our discussion of sustainability, we consider financial matters as well as emerging issues relevant to the sector.
Chapter snapshot
Operating results summary
The department and 16 HHSs continued to experience financial pressures in 2024–25, posting a total deficit of $960.6 million (2023–24: $14.1 million). This is a significant deterioration in the operating result compared to prior financial years, including the period when hospitals were experiencing the peak of the COVID-19 pandemic.
Entities | Drivers for operating result |
|---|---|

Department of Health $689.1 million deficit for 2024–25 (2023–24: $22.9 million deficit) | This result was driven by the department’s role as manager of the health system and 16 HHSs. It gave a significant amount of funding to the HHSs to provide better clinical outcomes and relieve cost pressures. The department’s budget to support HHSs was in a deficit position at the start of the year due to funding commitments to HHSs being greater than the available budget. The position worsened during the year as the department approved further funding for HHSs. This included $220 million for HHS initiatives targeting specialist outpatient appointments (Smart Referrals) and planned surgeries (Planned Care). This funding was also used to help reduce ambulance ramping-delays in offloading patients from the ambulance to the emergency department doctors and nurses. Other financial implications: The department was at risk of exceeding its approved overdraft limit due to the payments to HHSs and capital works being greater than budgeted. Queensland Treasury provided $800 million to the department to address cash flow challenges across the health system. |

Hospital and health services $271.5 million deficit for 2024–25 (2023–24: $8.8 million surplus) 10 of the 16 HHSs posted a deficit in 2024–25 | This was primarily due to continuing cost pressures from increasing clinical demand, limited capacity to address the increase in demand, and inflation. HHS full-time equivalent employee numbers increased by 5.9% during the year in order to respond to growing demand. The cost of these additional employees, including locums and contractors, has contributed to the operating deficits. Other financial implications: Six HHSs were at risk of exceeding their approved overdraft limits due to the size of their deficits. The department provided $123 million in additional financial support to them to address ongoing cash flow issues. |
Queensland Audit Office from information provided by the Department of Health.
HHSs exceeded their expense budgets by $1.72 billion or 7.8 per cent (2023–24: $1.95 billion or 9.8 per cent). The high expenditure reflects the higher volume of services they delivered this year, increased employee costs, and the impact of inflation on the costs of goods and services. HHSs reported an 11.7 per cent increase in the health services they delivered (2023–24: 6.1 per cent increase).
As noted above, HHSs received more funding, enabling them to deliver additional activity and offset the impact of inflation on costs. Revenue for the health sector was 6.6 per cent higher than budgeted (2023–24: 9.9 per cent higher).
Employee-related expenses were $887.2 million higher than budgeted (2023–24: $1 billion higher than budgeted), reflecting the increase in the number of employees, as well as the outcomes of enterprise bargaining agreements.
From 2019–20 to 2022–23, the department received additional COVID-19-related funding totalling $2.16 billion. As this funding ceased in December 2022, the department and HHSs need to find alternate revenue sources or reduce expenses.
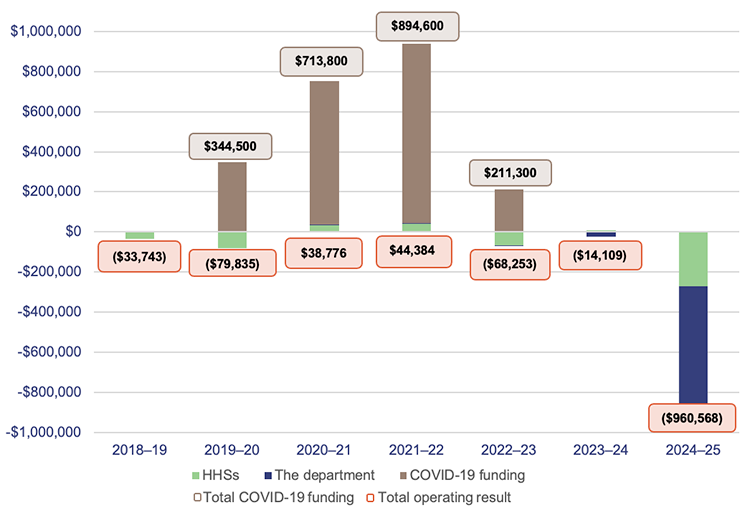
Note: From 2018–19 to 2022–23, the department had operating results very close to nil which are not clearly visible on the figure (2018–19: $632; 2019–20: $2,180; 2020–21: $5,384; 2021–22: $2,163; 2022–23: -$440).
Queensland Audit Office, from Queensland health entities’ financial statements.
The pressure on hospital and health services’ operating budgets is increasing
The 2024–25 state budget expected each HHS and the department to break even during the year, with total income equalling total expenditure. Yet, the department and 10 HHSs reported operating deficits.
The 2025–26 state budget again has an expectation that the department and all HHSs will break even. To assist the department and HHSs in achieving this, the budget is providing an additional $2 billion in funding compared to last year’s budget.
Despite this, achieving a break-even result may be challenging, as cost increases and demand for health services are unlikely to ease. This year’s budgeted funding is 11.4 per cent higher than last year’s budget. This is 8.3 per cent higher than last year’s actual funding.
Analysis of health sector expenditure
Total expenditure at the department increased by 8.6 per cent this year, from $38.4 billion to $41.8 billion. This spending was 5.7 per cent higher than budgeted.
The largest increase was in health services expenditure, which was $797 million higher than budgeted. Health services expenditure is the funding the department provides to HHSs and other health service providers for the delivery of health services across the state.
Total expenditure incurred by HHSs increased by 9.3 per cent this year, from $21.8 billion to $23.8 billion. All HHSs incurred expenses higher than their budgeted amounts, with variances between 4.3 per cent and 12.9 per cent.
The reasons for increased expenditure this year included:
- additional funding to support HHS Planned Care, Smart Referrals, Surgery Connect (public patients receiving surgical procedures in private hospitals), and initiatives to address ambulance ramping
- the increased staff numbers required to address the growth in demand for healthcare services, resulting in higher employee-related expenses
- pay increases for staff in line with enterprise bargaining agreements, and increased expenses relating to sick leave, overtime, reproductive leave, and COVID-19 leave
- outsourcing to private sector health providers to reduce waitlists
- use of external contractors to cover staff on leave and staff vacancies
- increased expenditure on supplies and services due to the increased level of activity delivered during the year
- price increases on certain supplies and services, particularly drugs and pathology.
Workforce pressures are increasing
Queensland Health’s Health Workforce Strategy for Queensland to 2032 includes projections for population growth, ageing, increased hospital activity, and the impact on the required workforce. The strategy projected that from 2023, the workforce would need to increase by 45,000 or 30.3 per cent to meet these demands. From 2026, approximately 36,000 additional employees will need to be onboarded to meet this target based on the number of full-time equivalent employees reported in the 2024–25 financial statements.
Adding to the challenge of recruiting new staff is the need to replace staff who leave due to retirement and other reasons. The department projects that within the next 10 years, 20 per cent of the existing workforce will reach retirement age. The health sector has experienced an increase in turnover since 2020, with higher turnover in rural and remote areas, where it is 9.5 per cent (4.5 per cent for metro areas).
Leave balances remain high, but are decreasing
Recreation leave balances have trended downwards across all HHSs and are at the lowest level for the last 3 years. Balances decreased by 2.3 per cent in 2024–25 (3.3 per cent decrease in 2023–24).
In Health 2022 (Report 10: 2022–23) we reported that recreation leave balances increased from 2019–20 to 2021–22 due to the impact of COVID-19 affecting the ability of staff to take leave. Since then, the ability of staff to take leave has improved.
Overall, sick leave taken and overtime worked have both increased by 5 per cent this year compared to last year. This increase can be attributed to the 5.63 per cent increase in the number of full-time equivalent employees.
COVID-19 leave and reproductive leave
In addition to sick leave, in 2024–25 health staff were also eligible to take special leave if they were unable to work due to COVID-19, and up to 10 days of reproductive leave – which started from 30 September 2024.
As reproductive leave resets on 1 July each year (10 days per year) and does not require any evidence to be claimed, there was a large uptake of this leave in June 2025.
In 2024–25, health staff took:
- approximately 563,000 hours of special leave due to COVID-19 – a 37 per cent decrease from the prior year
- approximately 174,000 hours of reproductive leave from 28 April to 30 June 2025, which cost approximately $8.9 million. We are unable to report reproductive leave prior to 28 April, as this leave type was mixed with other leave types in the payroll system from October 2024 to 27 April 2025.
Expenditure on frontline contractors is decreasing in most regions
In 2024–25, Queensland Health recorded a 3.6 per cent decrease in expenditure for frontline contractor staff, for example, nurses and other clinical contractors – a decrease of $15.6 million. All regions show a decrease in expenditure on frontline contractors except for ‘Other regional’ HHSs, whose expenditure on this increased by 15 per cent. Most of this increase is from the West Moreton region where there is significant population growth and demand for services.
Figure 4C shows expenditure on this across the HHS regions.
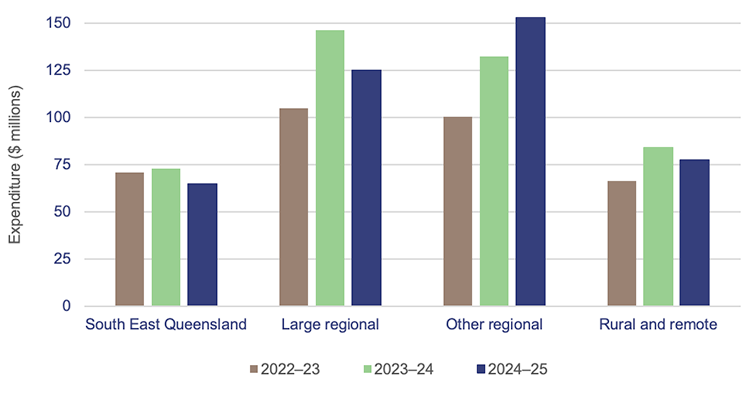
Queensland Audit Office, from Department of Health data.
Expenses for supplies and services have increased in line with activity
HHS expenditure on supplies and services was $6.1 billion this year (2023–24: $5.6 billion), an increase of 7.7 per cent ($433 million) over last year. HHSs delivered 11.7 per cent more activity in 2024–25, requiring more clinical supplies and services.
There was a 9 per cent ($124.9 million) increase in clinical supplies and services and an 8 per cent ($78.4 million) increase in pharmaceutical expenses. The increase in clinical supplies and services is in line with the increase in activity, and higher than the 2.1 per cent increase in the consumer price index (CPI) from June 2024 to June 2025.
Efficiency of health service delivery
HHSs’ income this year was 6.6 per cent above budget (2023–24: 9.9 per cent above budget). The income of all HHSs individually was higher than projected in the state budget.
| TYPES OF FUNDING FOR HHSs |
The 4 main funding sources for HHSs are:
The main types of government funding for HHSs are:
|
Hospital and health services delivered more activity than last year
Service agreements are negotiated between the department and each HHS. The agreements outline the services the department purchases from each HHS, the volume, and the amount it pays for those services.
The HHSs receive ABF and/or block funding (for services beyond the scope of ABF). Of the 16 Queensland HHSs, 15 are funded primarily by ABF. The Central West HHS receives block and other funding rather than ABF. This is because it operates smaller public hospitals, where the technical requirements for ABF are difficult to apply.
Under the service agreements, the department and HHSs measure service activity using Queensland Weighted Activity Units (QWAUs), which tie into ABF.
Figure 4D shows that activity delivered by HHSs increased by 11.7 per cent this year to 2,969,967 QWAUs (2023–24: 2,659,070 QWAUs). This was 7 per cent higher than the total volume of activity the department agreed with HHSs for 2024–25.
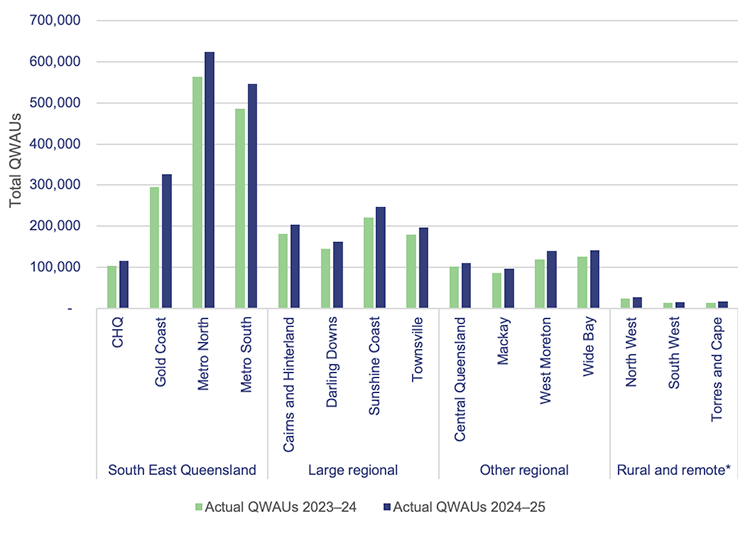
Note: * Central West HHS did not report on activity in 2023–24 and 2024–25 as it did not receive activity based funding in those years. CHQ – Children’s Health Queensland.
Queensland Audit Office, from hospital and health service annual reports 2023–24 and 2024–25.
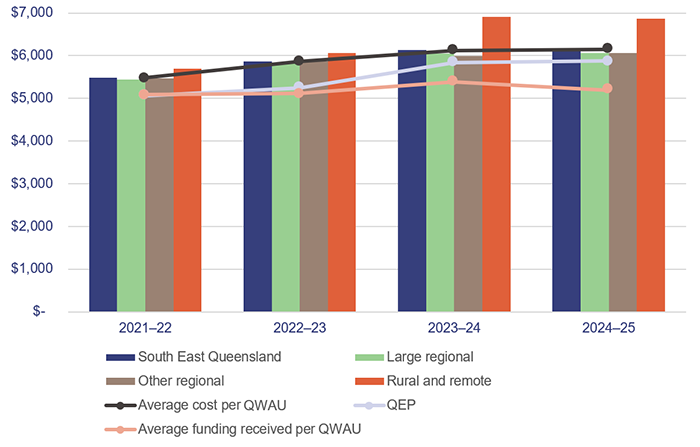
The HHSs’ performance in delivering activity efficiently can be measured against the Queensland Efficient Price (QEP). The QEP reflects the benchmark cost for Queensland to purchase one unit of activity based on the total funding available that year.
Figure 4E shows that the QEP has increased over time; however, the actual average cost per QWAU has exceeded it each year. This means that while the HHSs are delivering more activity, they are not meeting the efficient cost benchmark.
The change in healthcare activity costs has been very closely aligned to movement in CPI since June 2022. The average cost per QWAU has increased by 12.26 per cent since 2021–22 and CPI has similarly increased by 12.37 per cent in the same period. Comparatively, the average amount of funding received per QWAU has only increased by 2.12 per cent since 2021–22.
Figure 4E shows this growing gap between the cost of delivering health services and the funding received for this activity.
Note: Rural and remote only includes North West HHS, as the other HHSs do not record this efficiency measure.
Queensland Audit Office, using activity data from hospital and health service annual reports and the Queensland Efficient Price published by Queensland Health.
Health’s energy consumption
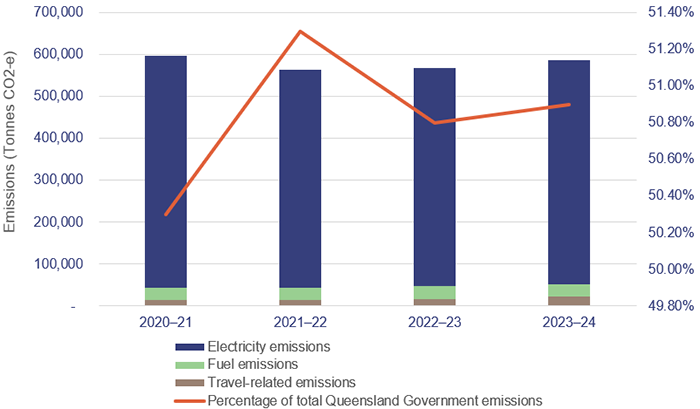
According to data published by Queensland Treasury, Queensland Health is responsible for roughly 51 per cent of the total Queensland Government greenhouse gas emissions. Figure 4F shows this has stayed consistent over the past 4 years (2020–2024), with between 91 to 93 per cent of these emissions coming from electricity over this period.
The emissions data reported does not capture all emissions from all Queensland Government agencies. We expect the accuracy and quality of reporting on emissions will improve as agencies standardise their definitions and methodologies for these calculations. Several HHSs have published sustainability and climate-related strategies. These plans have generally identified similar key themes: waste, energy, water, procurement, and transport. These HHSs have created their own strategies and some have set their own targets in advance of specific requirements being placed on them
| Emissions definitions | ||||||
Queensland Treasury states that:
|
Reporting on Scope 2 emissions is more straightforward than Scope 1 and Scope 3 as this information can be obtained directly from the suppliers. Despite this, there are still challenges due to the high volume of suppliers providing these services in the health system. This contributes to a lack of consistency in reporting, especially where many suppliers cannot provide tailored reporting.
Note: Tonnes CO2-e stands for carbon dioxide equivalent, which is the standard unit to measure greenhouse gas emissions.
Queensland Audit Office from the Queensland Government open data portal.
5. Asset management in health entities
Health entities need to effectively manage their assets to ensure they deliver high quality, efficient healthcare services. This includes planning for future needs by considering factors such as demand for services, and population age and growth.
To balance value for money with optimal health outcomes, health entities and Health Infrastructure Queensland (a division of the Department of Health), need to closely integrate how they manage and maintain existing assets with how they plan and construct new ones.
Chapter snapshot
The impact of population growth and ageing on the need for hospitals and other assets
Queensland has 20.5 per cent of Australia’s total population. The state’s population has been growing steadily, and in 2025, it had the third highest growth of any state or territory, with an increase of 1.75 per cent or 98,600 people (2024: 2.5 per cent growth).
Consistent with other Australian states and territories, and many countries around the world, Queensland has an ageing population. The Australian Bureau of Statistics’ Quarterly Population Estimate shows that the number of Australians aged 65 years and older grew by 36 per cent from the first quarter in 2015 to the first quarter in 2025.
As at 31 March 2025, 17.5 per cent (956,000 individuals) of the Queensland population was aged 65 years and older. Projections indicate that this number could exceed 1.3 million by 2036 (a 36 per cent increase over an 11-year period). By 2071, people aged 65 years and older are projected to make up between 25 per cent and 27 per cent of the Queensland population.
This, together with the overall growth in population, will place more pressure on the healthcare system.
The health sector needs sufficient infrastructure to meet the demands of the growing and ageing population. It also needs to plan and replace or renew existing infrastructure as it reaches end of life.
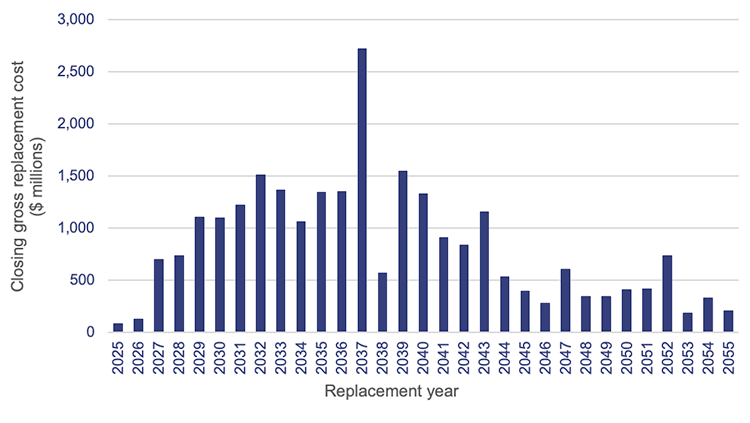
Figure 5A shows the value of assets that need to be replaced each year over the next 30 years. Approximately 39.9 per cent ($10.3 billion) of buildings currently owned by the Department of Health (the department) and the 16 hospital and health services (HHSs) are due to be replaced within the next 10 years.
This is based on their recorded remaining useful lives. ‘Useful life’ is the number of years an entity expects to use an asset – not the maximum period possible for the asset to exist. Within the next 12 years, more than 56 per cent of the current buildings – equivalent to $14.3 billion – will need to be replaced.
Closing gross replacement cost is the estimated cost to construct a similar asset, without adjustments for the age and condition of the existing asset, as of 30 June each year.
Queensland Audit Office, from Department of Health and hospital and health service asset registers 2025.
Figure 5A shows a significant peak is expected in 2037, when $2.7 billion worth of buildings will be due for replacement.
However, as of last year, buildings are now expected to last longer. This is due to HHSs extending the useful lives of their buildings. The department anticipates that buildings will last longer than their recorded remaining useful lives currently indicate, due to planned refurbishments, redevelopments, and other capital maintenance projects (subject to suitable funding being provided). This also depends on HHSs adequately funding repairs and maintenance to prevent premature deterioration of existing assets.
The Queensland Government has increased the capital budget for the health sector
The Queensland Budget 2025–26 – Budget Capital Statement identifies significant investments that will be made in the health sector over the next 5 years. These are to address the pressure on ageing infrastructure caused by growing demand for healthcare services.
In 2025–26, the total capital investment program for the Queensland Health portfolio is $3.67 billion (2024–25: $2.17 billion), which is significant. This increase has been in response to an independent review the Queensland Government commissioned of the Queensland Health capital program.
The most significant programs outlined in the 2025–26 budget include:
- $3.159 billion over 5 years ($664.1 million in 2025–26) for the Hospital Rescue Plan to support the Timely Investment Infrastructure Program, which provides for maintenance, replacement, and refurbishment of Queensland Health’s existing assets
- $1.783 billion (for 2025–26) as part of the total $16.9 billion for major hospital infrastructure. This includes works at Bundaberg, Coomera, and Toowoomba, the new Queensland Cancer Centre, a new cardiac hybrid theatre in Rockhampton to provide Central Queenslanders with enhanced cardiac services closer to home, and major hospital expansions at 10 sites across Queensland, including Brisbane, Cairns, Hervey Bay, Ipswich, Logan, Mackay, Redcliffe, and Townsville.
In 2024–25, the budgeted capital expenditure target was $2.17 billion. The health sector actually spent $2.55 billion – 17.5 per cent over the budgeted target. As shown in Figure 5B, it delivered several infrastructure projects across the state last year.

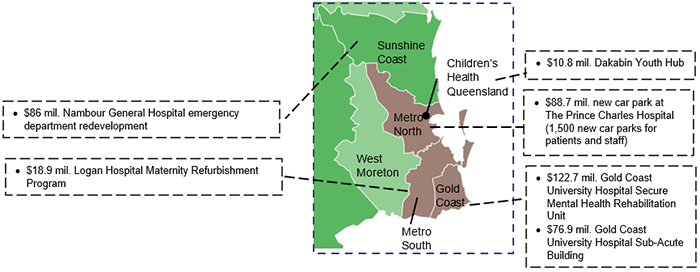
Note: We have only included those completed projects above $10 million.
Queensland Audit Office, from the hospital and health services’ annual reports and Department of Health records.
Over the past 5 years, rising costs and shortages of materials and labour have delayed the completion of major health projects. Over the next 7 years, these pressures will increase, as many major projects are rolled out across Queensland, including for the Olympic and Paralympic Games, as well as transport, energy, and water initiatives.
Effectively managing challenges such as a tight labour market, industrial disputes, and rising supply costs will be essential to delivering these projects on time and on budget, as laid out in the Hospital Rescue Plan.
We have reported on these competing infrastructure projects in Major projects 2025 (Report 8: 2025–26).
Reporting on maintenance needs of assets
In the 2024–25 annual reports, HHSs reported a 28.9 per cent increase in maintenance needs (40 per cent increase in 2023–24), with a total of $2.6 billion of assets requiring maintenance. This amount includes both operational and capital maintenance that has been deferred.
Most health entities are using consistent terminology for deferred maintenance
In Health 2024 (Report 8: 2024–25), we highlighted the lack of clarity and consistency in how HHSs reported deferred maintenance in their annual reports.
In response, during 2024–25:
- The department finalised and issued its Asset Management Key Terms paper. The department requested HHSs follow the guidance in the paper to ensure greater consistency in asset management reporting.
- HHSs reported their deferred maintenance using the new categories. Fifteen of the 16 HHSs reported details of deferred maintenance and postponed capital maintenance in their annual reports. One HHS only reported details of its deferred maintenance.
- Deferred maintenance (which comes from operational expenditure – OPEX) is unfunded operational works expenditure for building-related elements/services needed in the current financial year. It is maintenance that has not yet been carried out, but is necessary to prevent the deterioration of an asset or its function. OPEX refers to the ongoing costs required for the day-to-day functioning and maintenance of assets, so they remain in good operating condition.
- Postponed capital maintenance (CAPEX) is unfunded capital works expenditure for building-related elements/services needed in the current financial year. It is defined as capital works that are required to bring the condition of building assets to a required standard to meet service delivery needs. CAPEX involves investments that either extend the lifespan of an asset or replace significant components of it, such as major parts of machinery or infrastructure.
- Forecast life cycle replacement, renewals, and refurbishments are unfunded capital works identified for future years. They are required to maintain assets over their life, and include refurbishment, extensions, and new assets to deliver healthcare services. (They include work required to change the use of assets.)
Source: Queensland Audit Office, adapted from Department of Health Asset Management Key Terms paper – 9 May 2025.
This improved consistency of reporting by HHSs in their 2024–25 annual reports. Most HHSs are now applying the department’s revised asset management terminology and acting on its guidance. Of the 16 HHSs, 12 referred to ‘deferred maintenance’ (up from 9 in 2024), while 4 used the term ‘anticipated maintenance’ (down from 7 in 2024) when describing ‘deferred maintenance’.
‘Anticipated maintenance’ is a legacy term. Its continued use by some HHSs suggest they need more communication and guidance.
Maintenance needs are growing
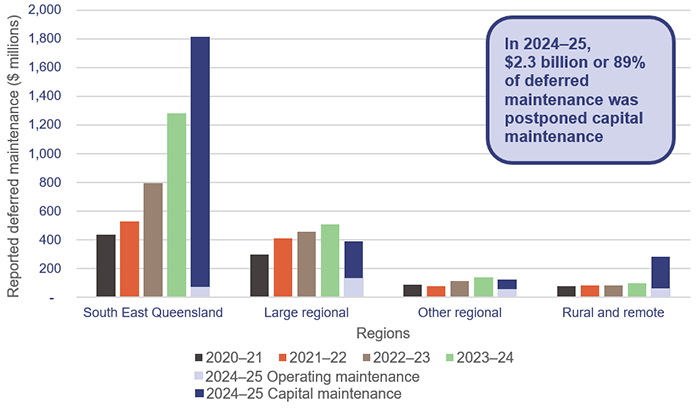
As at 30 June 2025, the total cost of reported maintenance required across all HHSs was $2.6 billion – an increase of $587 million (29 per cent) from 2024. This increase has mainly been driven by a $495 million increase across 2 HHSs in the South East Queensland region.
For the first time, in 2024–25, HHSs have reported separate figures for deferred maintenance and postponed capital maintenance in their annual reports.
Figure 5C shows the growth in the amounts reported for maintenance needs over the last 5 financial years for each HHS region. As 2024–25 was the first year HHSs reported maintenance by the deferred maintenance and postponed capital maintenance categories, we can only provide these individual figures for last year, not the previous 4.
Queensland Audit Office, from the hospital and health services’ annual reports.
Capital maintenance has historically been underfunded. The annual base funding for capital maintenance was set in 2010 and remained largely unchanged despite a 284 per cent (to 2024) growth in the Queensland Health asset base. In the 2025–26 budget, $671.9 million has been allocated compared to $215 million last year, to help address these needs and balance the shortfall.
The level of deferred maintenance, which HHSs are responsible for managing and funding through their annual budgets, remains relatively small compared to the volume of postponed capital maintenance funded by the department. However, reducing deferred maintenance will continue to be challenging for HHSs over time, particularly given rising costs, the pressure to achieve a balanced budget, and the increasing number of HHSs that reported operating deficits in 2025.
The department has reviewed the required maintenance reported by HHSs and identified that the significant increase seen across the HHSs is due to 3 main factors:
- stricter evaluations of asset conditions, leading to the identification of additional maintenance needs that were already present
- increased cost of undertaking maintenance. Market conditions, including shortages of materials and labour, are placing significant pressure on costs, and causing difficulties in accurately forecasting costs
- inconsistency in the methodology employed by HHSs for asset condition assessments.
Queensland Health sets maintenance targets
HHSs have an annual expenditure target for maintaining their assets. Queensland Health has determined that this needs to be 2.81 per cent of the replacement value of those assets.
This maintenance expenditure target is made up of:
- a 1.56 per cent capital maintenance component, which is funded by the department following planning and applications by HHSs. This does not include building replacements or major refurbishments
- a 1.25 per cent operating repairs and maintenance component, which is funded by the HHSs.
Queensland Health is in the process of developing a methodology to measure the 1.25 per cent operating target of repairs and maintenance expenditure as a percentage of gross replacement costs for HHSs. The methodology includes not only repairs and maintenance expenses relating to buildings and land improvements, but also the costs incurred for trades and artisans, to reflect the true cost of maintaining buildings.
The department has engaged with the HHSs to ensure the methodology is complete and captures all repairs and maintenance costs associated with buildings. Through this process, it has identified that some HHSs are classifying certain building, engineering, and maintenance administration costs inconsistently. As a result, it is currently unable to accurately determine whether HHSs are meeting their asset maintenance targets.
|
| The Department and HHSs should work together to finalise their methodology to accurately measure and report on whether HHSs are meeting their repairs and maintenance targets Building, engineering, and maintenance administration costs should be classified consistently across the HHSs’ financial systems, to make it easier to monitor and measure them. |
Asset maintenance affects service delivery
Through our audits, and our engagement with various HHS stakeholders, we have identified several instances where assets have failed due to increasing delayed maintenance issues. We present these examples in Figure 5D to illustrate the consequences of not adequately addressing deferred maintenance. These examples do not indicate these issues are pervasive across the health system.
Issue | Impact on health services |
|---|---|
| In September 2025, the boilers at a major South East Queensland hospital failed. This meant there was no steam for the sterilisation equipment, and the sterilisation process had to stop for 3 hours while it was rectified. | This resulted in operating theatres having to be temporarily shut down. |
| Electrical equipment at a major South East Queensland hospital was flagged as being at very high risk of failing and needing to be replaced. Replacement parts could no longer be sourced, as parts were no longer being manufactured. The HHS had to source replacement parts from an electrician who was storing this old stock in his garage. | There was a serious risk of a power system failure if parts were not obtained. |
| Rust was found on large pendant lights throughout the intensive care unit of a major regional hospital. | Corrosion on electrical equipment and lighting could affect the safe delivery of patient services by increasing the likelihood of equipment failure or short circuits that may cause power outages. |
| The Queensland Tissue Bank was at risk of closing due to an imminent failure of critical facility infrastructure. | This could result in the service being unavailable locally and tissue having to be stored and distributed from other tissue bank locations. There is a risk that human tissue donated by Queenslanders for transplants may become unviable if the building is not adequately maintained. |
| Reverse osmosis (water purification) outages and plumbing issues at a hospital affected the ability to supply clean water to renal and pathology services. | This resulted in the hospital being unable to provide dialysis services, requiring patients to travel to other hospitals to receive care. This issue has been ongoing for 6 months and remains unresolved. |
Queensland Audit Office, from HHS risk registers, and review of audit and risk committee meeting minutes.
We note that action on recommendations relating to the maintenance needs of assets is likely to remain ongoing, as budgets and maintenance requirements will continue to change over time. This will continue to be an area that HHSs must actively monitor and manage to ensure assets are appropriately maintained.
All health entities should continue to address recommendations relating to maintenance needs including:
- Recommendation 5 from our Health 2020 (Report 12: 2020–21) report, which was to prioritise high-risk maintenance (see Appendix E in this report)
- Recommendation 2 from our Health 2023 (Report 6: 2023–24) report, which was to standardise the process for assessing deferred maintenance to ensure reliability in reporting and strategic asset management planning (see Appendix E in this report).
6. Demand for health services
Demand for health services in Queensland continues to increase, because of a growing and ageing population and a shortage of general practitioners.
This impacts on emergency departments and ambulances, even with the services provided by the satellite health centres built in recent years. It also contributes to delays in patients seeing specialists within the recommended times.
Chapter snapshot
Notes: For all items except the section on managing demand, the figures are reported for Queensland’s top 26 reporting hospitals (see Appendix J). Ambulance ramping data includes priority codes 1 and 2 (emergency and urgent cases).
Long waits are when a patient has waited longer – by one day or more – than the clinically recommended time for a specialist appointment.
Virtual Emergency Care is where a patient called 000 and emergency medical dispatchers have assessed alternative pathways that do not require an ambulance vehicle dispatch.
Emergency department presentations
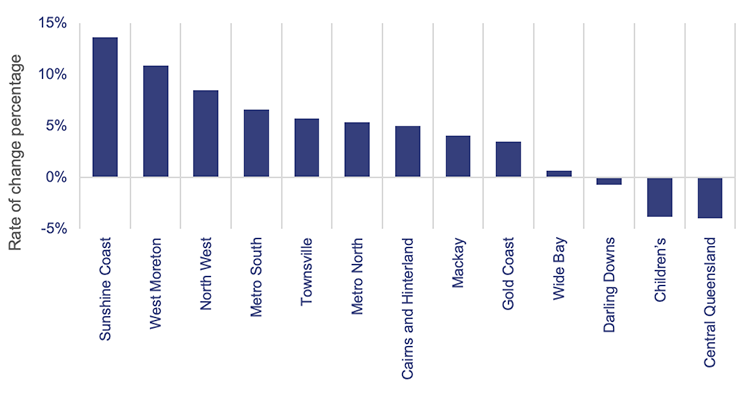
Demand for emergency department services since 2020–21 has increased by 4.5 per cent. Figure 6A shows the change in emergency presentations by hospital and health service (HHS).
The areas that have experienced the largest increase in demand since 2020–21 are Sunshine Coast HHS (13.65 per cent), followed by West Moreton HHS (10.9 per cent) and North West HHS (8.48 per cent).
Emergency department presentations: Queensland Audit Office, from Queensland Health – System Performance Branch – for the top 26 reporting hospitals.
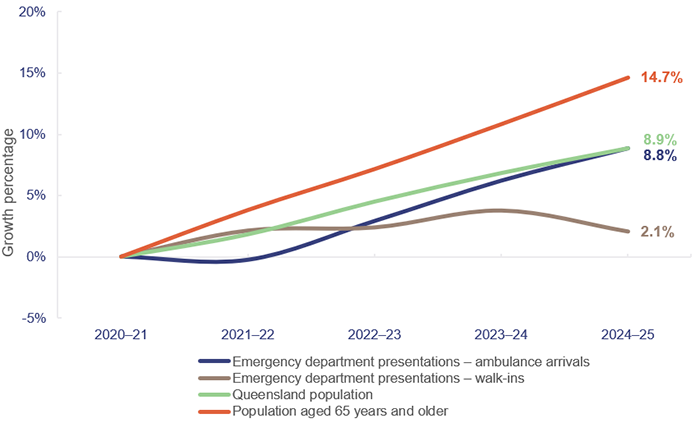
Figure 6B shows the cumulative growth in emergency department presentations by mode of arrival (ambulance and walk-ins) since 2020–21. It also shows Queensland’s population growth and ageing population over the same period.
Emergency department presentations: Queensland Audit Office, from Queensland Health – System Performance Branch – for the top 26 reporting hospitals. Queensland population: quarterly Australian Bureau of Statistics population data (latest available data as of March 2025). Ageing population: Queensland Audit Office, based on data from Queensland Government Statistician’s Office and Report of the Health Officer Queensland, March 2025.
Overall, patients arriving at emergency departments by ambulance are increasing on par with Queensland’s population growth and increasing at a faster rate than walk-in arrivals. Demand for emergency services is driven by the increase in population – especially the increase in people aged 65 years and over, which has increased by 14.7 per cent since 2020–21.
According to the 2021 census, around 32 per cent of Queenslanders, and around 63 per cent of Queenslanders aged 65 years and over, have one or more long-term health conditions. This contributes to an increase in more complex cases requiring emergency and ambulance services.
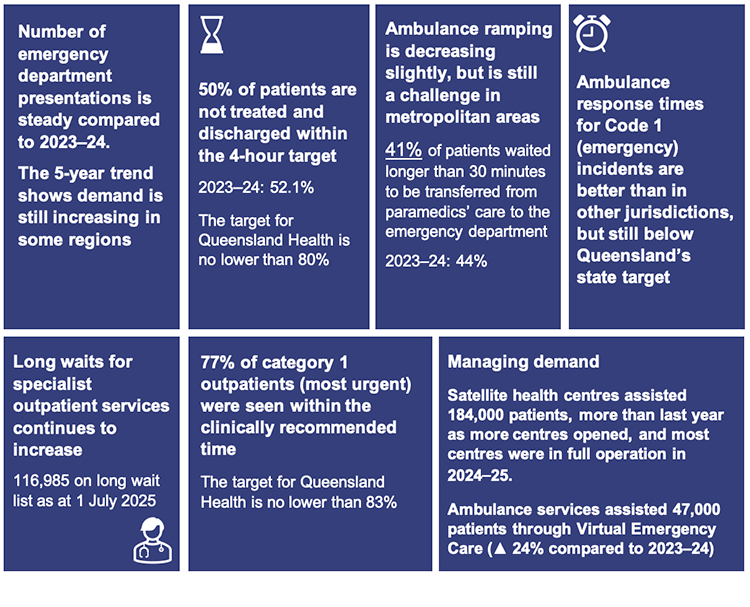
Emergency department presentations have steadied in the last year
Overall demand for emergency department services in 2024–25 remained steady. In 2024–25, the number of presentations at emergency departments was 1,767,000, a decrease of 0.2 per cent. Walk-in arrivals decreased by 1.6 per cent and ambulance arrivals increased by 2.5 per cent.
Some of the contributing factors to the steady number of presentations at emergency departments are:
- the completion of the satellite health centre program, which commenced in 2023
- the expansion of virtual care services such as the first state Virtual Emergency Care Service, which started in July 2024.
These initiatives aim to reduce the pressure associated with emergencies by offering alternative care pathways to patients who may not require assessment or admission at an emergency department.
50 per cent of patients are not treated and discharged within the 4-hour target
In 2024–25, the top 26 reporting hospitals in Queensland treated and discharged 882,000 patients at their emergency departments within 4 hours or less. The target is 80 per cent of presentations within 4 hours or less. Queensland achieved 49.9 per cent this year, which is 2 percentage points worse than last year. Queensland’s performance is similar to that of other states.
In most Australian states, more patients are staying longer in emergency departments and fewer emergency department visits are completed in 4 hours or less. In 2023–24, Queensland ranked sixth across all states and territories in Australia and fourth across all states in Australia. At 51.9 per cent, it was behind Western Australia (59.1 per cent), New South Wales (57.4 per cent), and Victoria (53.2 per cent), as shown in Figure 6C.
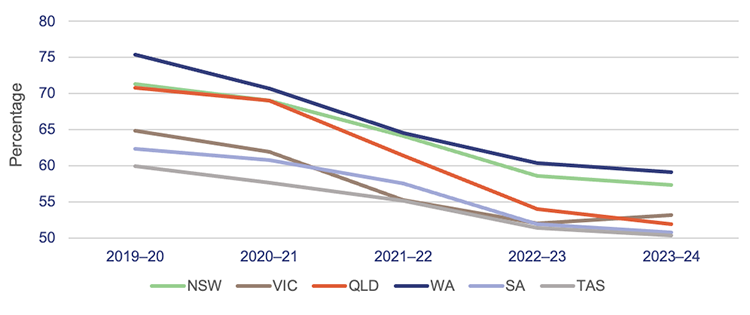
Notes: The target for emergency length of stay of 4 hours or less ranges between 75 to 90 per cent across the states. The target for Queensland is 80 per cent.
TAS – Tasmania; VIC – Victoria; SA – South Australia; QLD – Queensland; NSW – New South Wales; WA – Western Australia. Data is for all hospitals across the states. The latest available information is up to the 2023–24 financial year.
Queensland Audit Office, from Australian Institute of Health and Welfare, My Hospitals data.
Satellite health centres are having an impact
In February 2025, Queensland Health renamed the satellite hospitals to ‘satellite health centres’ to reduce public confusion about the facilities’ purpose. This change reflects feedback from frontline clinicians and primary care providers, to better represent the services these facilities offer – urgent care for illnesses and injuries not expected to be life-threatening in nature. This aims to reduce category 4 and 5 presentations at emergency departments in major hospitals. However, due to unmet demand at general practitioners and community-based health services, satellite health centres may not always drive a direct reduction of patients at nearby hospitals.
| Emergency department triage categories | ||
When patients present to an emergency department, they are assessed and triaged according to the following categories of urgency:
Source: Australasian Triage Scale. |

Queensland Health opened 7 satellite health centres in the last 2 years. Figure 6D shows the opening dates and the nearby hospitals.
There were 183,505 presentations at satellite health centres in 2024–25 compared to 90,740 in 2023–24. The increase is mainly due to an increase in capacity over time, as shown in Figures 6D and 6E.
| Satellite health centre | Opening date | Nearby hospitals* |
|---|---|---|
| Caboolture | 3 August 2023 | Caboolture Hospital |
| Redlands | 28 August 2023 | Redland Hospital |
| Ripley | 30 August 2023 | Ipswich Hospital |
| Tugun | 15 November 2023 | Robina Hospital |
| Kallangur | 11 December 2023 | Redcliffe and The Prince Charles hospitals |
| Eight Mile Plains | 27 May 2024 | Logan and Princess Alexandra hospitals |
| Bribie Island | 17 July 2024 | Caboolture Hospital |
Note: *Only Queensland public hospitals are listed.
Queensland Audit Office, from Queensland Health – System Performance Branch.
As shown in Figure 6E, satellite health centres mainly treated category 3 and 4 triage categories in 2023–24 and 2024–25.
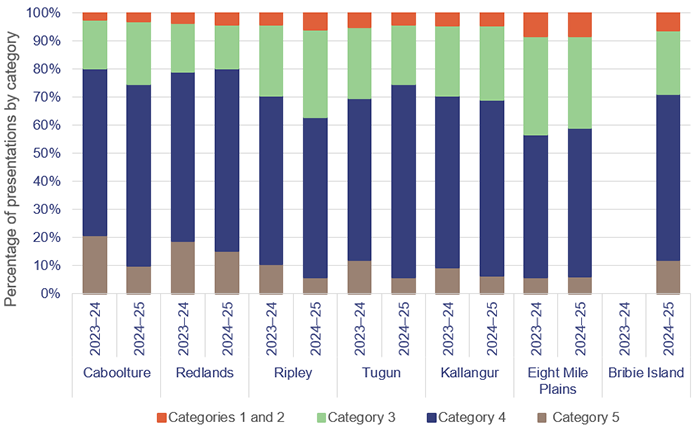
Queensland Audit Office, from Queensland Health – System Performance Branch.
As the announcement of the change in name came into effect in February 2025, it is expected that the number of patients in categories 1 and 2 will decrease in 2025–26 and onwards.
Figure 6F shows how non-urgent presentations at emergency departments close to satellite hospitals have changed since 2022–23. The Ipswich Hospital emergency department has seen the greatest reduction (33 per cent) in non-urgent (category 4 and 5) presentations, followed by Logan Hospital and Redland Hospital at 11 per cent. Robina Hospital emergency department has shown a 3 per cent increase in non-urgent (category 4 and 5) presentations.
A range of factors influence the number of presentations at satellite health centres and whether this is reducing the number of presentations at hospital emergency departments. Some of these factors include:
- overall demand growth in a region
- whether there was previously unmet demand that is now being met by a satellite health centre
- demand for services after hours
- transport and accessibility options
- services available in an area
- patient awareness and behaviour.
Health Infrastructure Queensland is conducting an evaluation to determine the impact of satellite health centres on hospital demand.
Queensland Audit Office, from Queensland Health – System Performance Branch.
Ambulance services
Delays in hospitals have a flow-on effect on ambulances. In this section, we provide an updated analysis of the demand for ambulance services, and on Queensland Health’s and Queensland Ambulance Service’s performance against:
- ambulance ramping, which measures the percentage of patients transferred to the care of an emergency department beyond 30 minutes
- response times (the time from when a call to 000 is answered to when an ambulance arrives at the scene of an emergency).
Demand for ambulance services keeps increasing
The overall demand for ambulances (excluding virtual models of care) has increased by 3.2 per cent since last year and 10.5 per cent since 2020–21.
Since 2020–21:
- Code 1 incidents (emergency) have increased by 48.4 per cent.
- Code 2 incidents (urgent) have decreased by 22.4 per cent.
The number of ambulance incidents (codes 1 and 2) reported under the mental health category has also increased by 40 per cent over the last 5 years, from about 58,000 incidents in 2020–21 to about 82,000 in 2024–25.
A contributing factor to the decrease in code 2 incidents is the use of the Virtual Emergency Care Service, with 47,007 patients assessed and treated in 2024–25.
Comparison with other states
Queensland continues to be the Australian state with the highest number of ambulance incidents per 1,000 population.
A likely reason for this is that the Queensland Ambulance Service is publicly funded. New South Wales has adopted a user-pays model, while Victoria, South Australia, and Western Australia use subscriber models.
Figure 6G shows the number of ambulance incidents by state from 2019–20 to 2023–24.
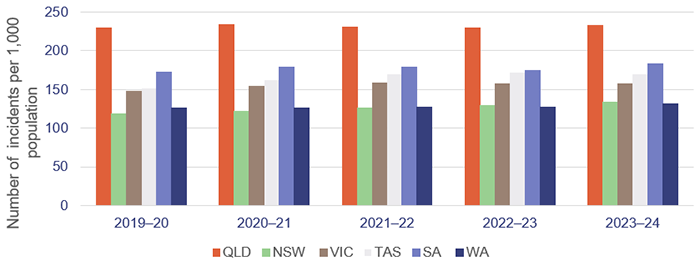
Notes: Data is for all hospitals across the states. The latest available information is up to the 2023–24 financial year. Population rates are derived using the 31 December estimated resident population for the relevant financial year.
Queensland Audit Office, from Productivity Commission, Report on Government Services 2025, Part E Section 11 Ambulance services.
Ambulance ramping continues to be an ongoing challenge
The Queensland Government’s goal is to reduce ambulance ramping to below 30 per cent by 2028. In 2025–26, Queensland Health introduced specific ambulance ramping targets in its service agreements with HHSs. Each top 26 reporting hospital is expected to contribute to a collective statewide ramping reduction of 3 percentage points by the end of 2025–26.
In 2024–25, 41 per cent of patients were ramped for longer than the recommended time frame in the top 26 reporting hospitals. Overall, ambulance ramping has shown an improvement of 3 percentage points compared to last year. However, ramping continues to be an ongoing challenge in some areas, as demand for emergency services continues to increase.
Ramping: When an emergency department is at capacity, ambulance paramedics are unable to transfer patients to emergency department nurses and clinicians in a timely manner. This delay is referred to as ambulance ramping or patient off-stretcher time delay.
For Queensland public hospitals, ramping is measured when patient off-stretcher time is not within 30 minutes of an ambulance arriving at the hospital.
Patient-off stretcher time (POST): This is the time between presentation of a patient by ambulance services to an emergency department triage point and the transfer of the patient to an emergency department bed.
Figure 6H shows the ramping rates per HHS in 2023–24 and 2024–25. The HHSs with the biggest ambulance ramping in 2024–25 were West Moreton, Metro South, Gold Coast, and Metro North. West Moreton experienced a 2 percentage point increase in ramping from 2023–24 to 2024–25, while the others experienced a slight improvement in ambulance ramping.
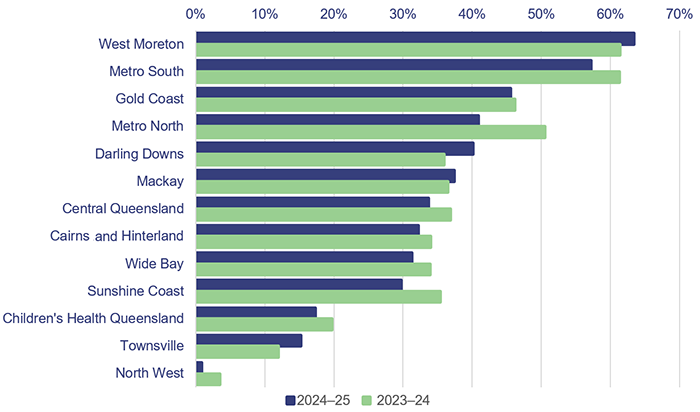
Queensland Audit Office, from Queensland Health – System Performance Branch for the top 26 reporting hospitals.
Ramping means that paramedics are unable to respond to subsequent ambulance callouts while they wait for patients’ care to be formally transferred to emergency departments. Faster off-stretcher times ensure ambulances are available to respond to those patients waiting in the community.
Ambulance ramping is linked to the:
- number and complexity of patients presenting for treatment (both walk-ins and ambulance presentations)
- limited availability of specialists to attend patients in emergency departments
- availability of ward beds to receive patients transferred from emergency departments
- inefficiency of hospital discharge processes in freeing up hospital beds, and the increase of patients who remain in hospital beds despite being clinically ready for discharge.
The average length of stay of patients admitted to hospital at the top 26 reporting hospitals increased by 4 per cent in 2024–25 compared to 2023–24, going from 2.6 days to 2.7 days. Mackay HHS and West Moreton HHS showed the largest increases, with 26 per cent and 12 per cent respectively.
In terms of the average length of stay for patients over 65 years old, West Moreton HHS and Darling Downs HHS showed the largest increases, with 17 per cent and 13 per cent respectively. This puts pressure on ambulance ramping when it takes longer to discharge patients from the hospital to free up hospital beds. This can occur, for example, when a patient cannot be discharged due to unavailable beds in an aged care facility.
The Queensland Ambulance Service achieves some of the best response times in the country, but does not meet all its performance targets
Comparison with other states
As noted earlier, the Queensland Ambulance Service continues to achieve better response times for emergency cases (code 1) than most other jurisdictions, as shown in Figure 6I. This is despite having the highest number of responses in Australia in proportion to population, and a 48.4 per cent growth in code 1 incidents over the last 5 years.
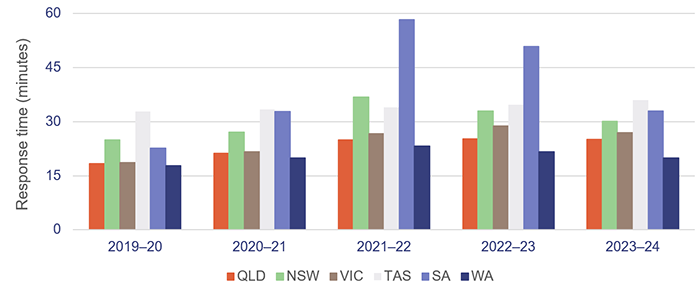
Notes: The latest available data is up to the 2023–24 financial year. *The 90th percentile refers to the time in which 90 per cent of emergency incidents are responded to.
Queensland Audit Office, from Productivity Commission, Report on Government Services 2025, Part E Section 11 Ambulance services.
Ambulance response times measure how long it takes from when a 000 call is answered to when an ambulance arrives at the scene.
Performance targets for response times are measured in minutes for code 1 emergencies, for the:
- 50th percentile – the Queensland Ambulance Service expects that 50 per cent of ambulances respond to emergency incidents (code 1) in less than 8.2 minutes
- 90th percentile – the Queensland Ambulance Service expects that 90 per cent of ambulances respond to emergency incidents (code 1) in less than 16.5 minutes.
Code 1 response times
Code 1 incidents are potentially life-threatening events that require the use of ambulance lights and sirens. Code 1A is ‘actual time critical’, code 1B is ‘emergent time critical’, and code 1C is ‘potential time critical’.
There were 628,276 code 1 incidents in 2024–25 (62.44 per cent of total code 1 and 2 incidents).
The Queensland Ambulance Service has not met its response time targets for priority code 1A since 2020–21 and has not met its response time targets for code 1B and 1C incidents since at least 2017–18, when we started tracking this measure.
Figure 6J shows ambulance response times for code 1 from 2020–21 to 2024–25.
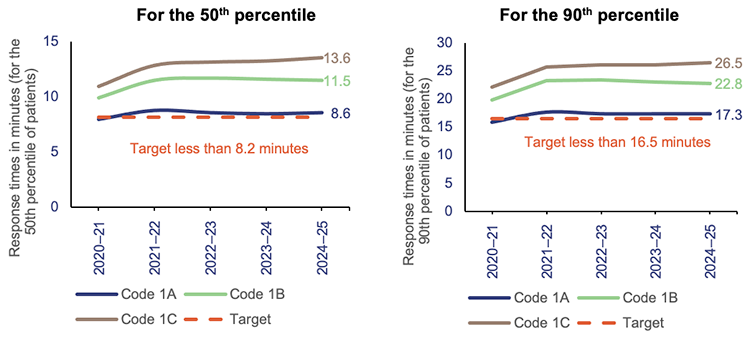
Queensland Audit Office, from data received from the Queensland Ambulance Service reporting system.
Code 2 response times
Code 2 incidents may require a fast response, but do not require lights and sirens. Code 2A incidents require an urgent response but are not critical.
There were 377,931 code 2 incidents in 2024–25 (37.6 per cent of total code 1 and 2 incidents). Response times for code 2A incidents (28 per cent of total code 1 and 2 incidents) slightly increased from 61.1 minutes in 2023–24 to 61.7 minutes in 2024–25 – for the 90th percentile.
The Queensland Ambulance Service has not set performance targets for code 2 incidents. This is because its focus is on ensuring it is responding to the most urgent cases.
Specialist outpatient services
We audited specialist outpatient services in Improving access to specialist outpatient services (Report 8: 2021–22). In this section, we update key graphs from that report, and from Health 2024 (Report 8: 2024–25), using data provided by the Department of Health.
Outpatients are not seeing specialists within the target time measures
Seen-within time measures whether patients attend their first appointment within clinically recommended times.
A long wait is when a patient has waited longer – by one day or more – than the clinically recommended time for a specialist appointment.
Figure 6K shows the 3 urgency categories for specialist outpatient services and the clinically recommended times within which patients should be seen. It also shows the target for the percentage of patients seen-within time, as per Queensland Health’s service delivery statement and service level agreements.
Since 2020–21, service delivery statements have only had a target for category 1 specialist outpatients’ seen-within time. However, the department’s service agreements with the HHSs include targets for all 3 categories.
Urgency category | Appointment required within | Target seen-within time | Target seen-within time |
|---|---|---|---|
Category 1 | 30 calendar days | 83% | 90% |
Category 2 | 90 calendar days | - | 85% |
Category 3 | 365 calendar days | - | 85% |
Queensland Audit Office, from Specialist Outpatient Services Implementation Standard and Queensland Health service delivery statements and service level agreements.
Figure 6L shows the percentage of outpatients seen by a specialist within clinically recommended times for each category. For patients in category 1, Queensland Health has not met the targets from 2021–22 to 2024–25. However, the percentage of patients seen-within time remained steady from 2023–24 to 2024–25.
For patients in category 2, 2024–25 shows the lowest percentage of patients seen in time in the last 9 years, from 50 per cent in 2023–24 to 46 per cent in 2024–25.
There was a slight improvement in category 3, from 68 per cent in 2023–24 to 69 per cent in 2024–25.
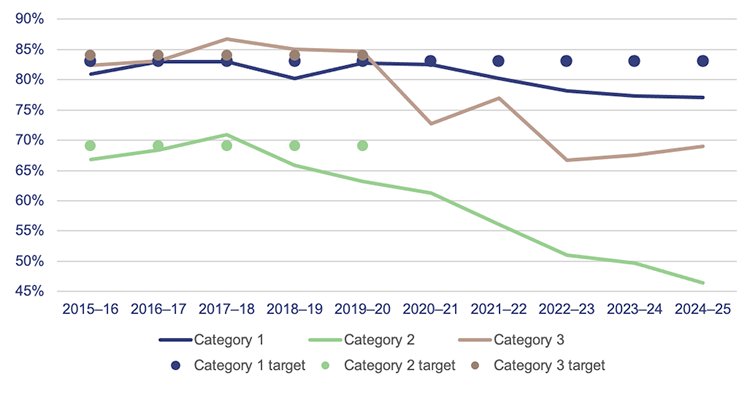
Notes: The target is per service delivery statements. Data is for Queensland’s top 26 reporting hospitals at each reporting year and the specialist outpatient services within reporting scope applicable to each year. Caloundra Hospital was a reporting hospital until 2016–17 and is included in this graph until 2017–18.
Queensland Audit Office, from Queensland Health specialist outpatient data collection.
There has been a 5.9 per cent increase in the number of initial outpatient specialist appointments delivered and an 8.1 per cent increase in the number of specialist outpatient referrals, which may be impacting HHSs’ ability to meet their targets (see Figure 6M).
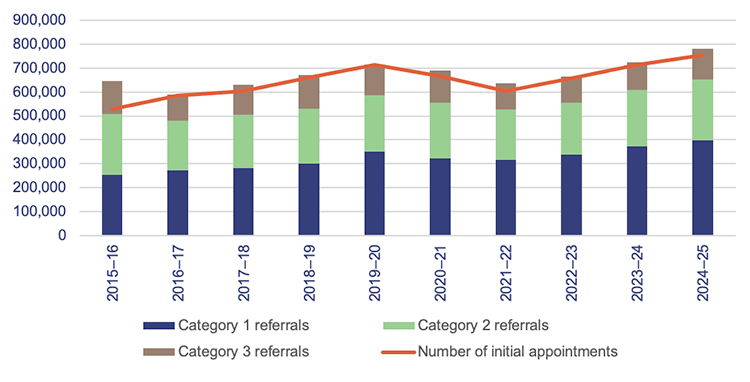
Note: Data is for Queensland’s top 26 reporting hospitals at each reporting year and the specialist outpatient services within reporting scope applicable to each year. Caloundra Hospital was a reporting hospital until 2016–17 and is included in this graph until 2017–18.
Queensland Audit Office, from Queensland Health specialist outpatient data collection.
More people are waiting longer than clinically recommended for specialist care
Figure 6N shows that the total number of long waits who are ready for care (available to attend an appointment) halved in the first 3 years of Queensland Health’s Specialist Outpatient Strategy, which began in July 2015. But the total number of long waits as of 1 July 2025 is 44 per cent higher than it was on 1 July 2015.
In 2024–25, outpatient long waits who are ready for care reached their overall peak, with 116,985 patients ready for care waiting (as at 1 July 2025). This represents an increase of 15 per cent, or 15,217 patients, compared to 2023–24.
While the HHSs are working through the backlog of patients, new patients are being placed on waitlists. This means managing the specialist outpatient waitlist requires the HHSs to balance the overall growth in demand by prioritising seeing the longest waiting patients and patients with the most urgent clinical needs.
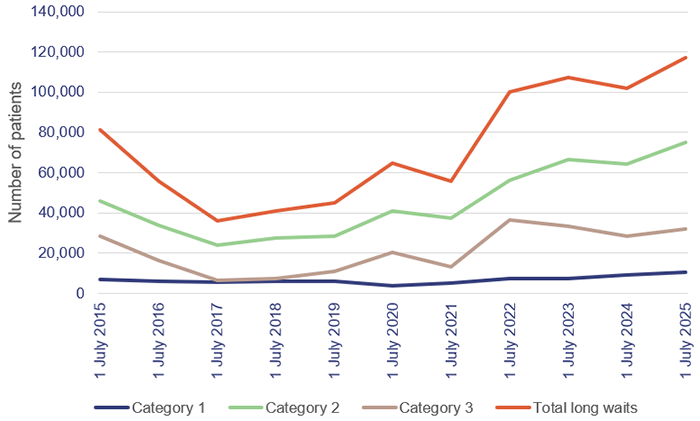
Notes: In 2021–22, the total number of long waits increased by 80 per cent due to the impacts of COVID-19 on system capacity. Data is for Queensland’s top 26 reporting hospitals at each reporting year and the specialist outpatient services within reporting scope applicable to each year. Caloundra Hospital was a reporting hospital until 2016–17 and is included in this graph until 2017–18.
Queensland Audit Office, from Queensland Health specialist outpatient data collection.
2025 hospital and health service dashboard
Find your local hospital and health service (HHS) in this Queensland Audit Office visualisation to explore its financial audit data for 2025 and compare to other hospital and health services. This interactive tool includes data on revenue, expenses, assets, liabilities and activity measures.