
Overview
Queensland's local governments are the first line of connection to communities; providing Queenslanders with a wide range of services such as roads, water and waste, libraries, and parks. While the COVID-19 pandemic presented challenges for local governments to deliver these services over the past few years, they are now recovering from the financial impacts of the pandemic.
Tabled 11 May 2022.

Report on a page
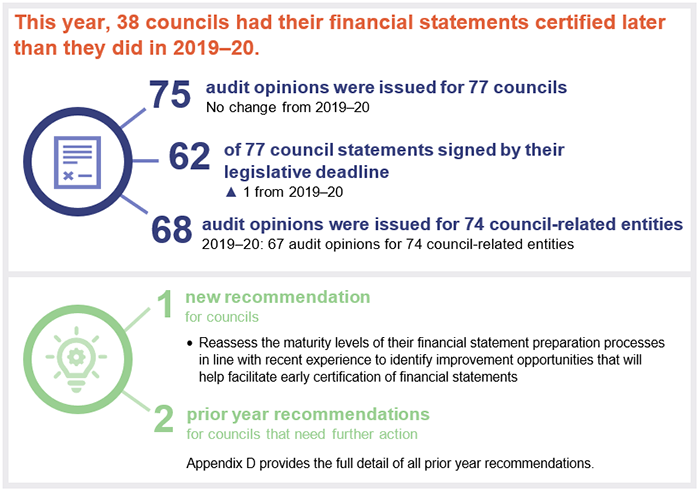
Financial statements are reliable, but timeliness has deteriorated since 2018–19
As of the date of this report, we have certified the financial statements of 75 of 77 (2019–20: 75 of 77) local governments (councils). The financial statements of these councils, and the entities they control, are reliable and comply with relevant laws and standards.
For several years, we have stressed the importance of councils having us certify their financial statements within a reasonable time frame after 30 June. This ensures timely information is available to decision makers and their communities. Substantial improvement was seen in the 2018–19 financial year, when 58 councils had their statements certified at least 2 weeks prior to their legislative deadline of 31 October.
In 2019–20, this number had dropped to 47 councils, in the face of the COVID-19 pandemic, local government elections, and the need to implement new accounting standards. In 2020–21, despite not facing these sorts of challenges, only 36 councils had their financial statements certified 2 weeks prior to the statutory deadline.
Controls over financial systems and processes have improved, but most high-risk issues have not been resolved after more than a year
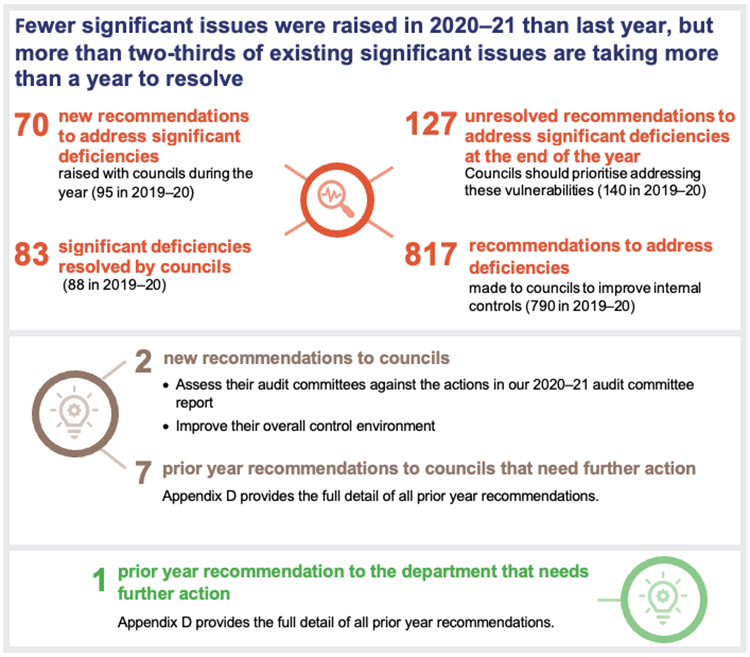
Councils have made efforts to reduce the number of significant deficiencies we have identified with their control environments in recent years (significant deficiencies are of high risk and need to be addressed immediately). As at 30 June 2021, the number of unresolved significant deficiencies was the lowest in 5 years. However, 86 significant deficiencies (68 per cent of all unresolved significant deficiencies) are still unresolved more than one year after being identified.
For the last few years, we have seen persistent problems with councils’ information systems, risk management, and procurement and contract management practices.
For several years we have recommended councils strengthen their governance. Despite this:
- 15 councils (2019–20: 16 councils) do not have an audit committee. Of those who do, there are 3 councils whose committees did not meet in the 2020–21 financial year, and 2 councils whose committees met only once
- 12 councils were in breach of their legislation – 6 councils (30 June 2020: 7 councils) did not have an internal audit function and another 6 councils (7 in 2019–20) with an internal audit function did not have any audit activity during the 2020–21 financial year.
Financial sustainability has marginally improved
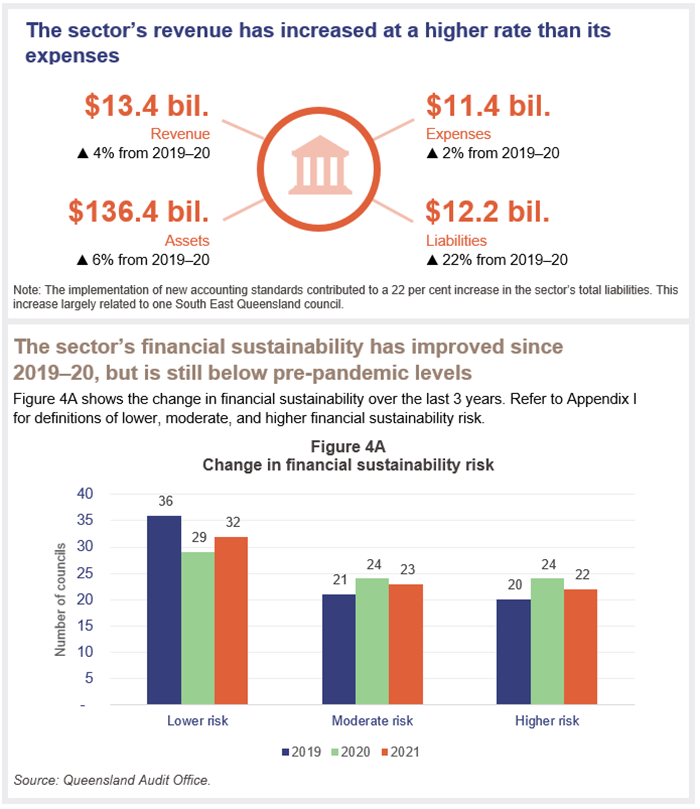
Councils are recovering from the financial impacts of the COVID-19 pandemic. For the 2020–21 financial year, 35 councils (2019–20: 21 councils) generated an operating surplus. As a result, fewer councils are at a moderate or high risk of not being financially sustainable (see Appendix I).
Although this is encouraging, 45 councils (approximately 60 per cent of the sector) are still at either a moderate or a high risk of not being financially sustainable.
Recommendations for entities
This year, we are making the following recommendations to councils. These are in addition to the recommendations we have made in prior year reports that remain unresolved, which are included in Appendix D.
Reassess the maturity levels of their financial statement preparation processes in line with recent experience to identify improvement opportunities that will help facilitate early certification of financial statements |
|
| REC 1 |
All councils should reassess their initial self-assessment against the financial statement maturity model and compare this to their recent financial statement preparation experiences. Councils should also reflect on their processes from the 2018–19 financial year that enabled them to have their financial statements certified earlier. Together, these reflections will identify improvement opportunities to assist elected members and their executives to improve the timeliness of certification of financial statements. |
Assess their audit committees against the actions in our 2020–21 audit committee report |
|
| REC 2 |
Those councils who have an audit committee function, and those that are looking to establish one, should consider implementing the actions we have identified in our report Effectiveness of audit committees in state government entities (Report 2: 2020–21). This would improve the effectiveness of their audit committees, with flow-on benefits to council governance and performance. |
Improve their overall control environment |
|
| REC 3 |
All councils should use the annual internal control assessment tool available on our website to perform an initial self-assessment of the strengths and improvement opportunities of their internal controls. Where their results do not meet their performance expectations, they should develop and implement a plan to strengthen their internal controls over a specific period. |
Asset management plans to include councils’ planned spending on capital projects |
|
| REC 4 | All councils should review their asset management plans to confirm that these plans include the proposed timing and cost of their capital projects, including the cost of maintaining these assets over their whole lives. This would help councils identify their future funding needs and provide better information to the department on the timing of capital funding sought by councils. |
Review the asset consumption ratio in preparation for the new sustainability framework. Assess whether the actual usage of assets is in line with the asset management plan |
|
| REC 5 |
All councils should review their asset consumption ratio in preparation for the new sustainability framework to assess whether they are in line with the proposed benchmark. This ratio would inform councils whether their assets have been used in line with their asset management plans. Any variance between the expected and actual usage may either result in additional maintenance to improve the service levels of their assets or to reassess their expectation about asset usage. |
Enhance their liquidity management by reporting their unrestricted cash expense ratio and their unrestricted cash balance in monthly financial reports |
|
| REC 6 |
All councils should enhance their liquidity management by reporting their unrestricted cash expense ratio and their unrestricted cash balance in the monthly financial reports they table in council meetings. |
1. Overview of entities in this sector
Queensland Audit Office.
2. Results of our audits
This chapter provides an overview of our audit opinions for the local government sector.
Chapter snapshot
We express an unmodified opinion when financial statements are prepared in accordance with the relevant legislative requirements and Australian accounting standards.
We issue a qualified opinion when financial statements as a whole comply with relevant accounting standards and legislative requirements, with the exceptions noted in the opinion.
We include an emphasis of matter to highlight an issue of which the auditor believes the users of the financial statements need to be aware. The inclusion of an emphasis of matter paragraph does not change the audit opinion.
Audit opinion results
Audits of financial statements
As of the date of this report, we had issued audit opinions for 75 councils (2019–20: 75 councils) and 68 of the entities they control (2019–20: 67 controlled entities). Of the 75 councils we issued audit opinions for:
- 62 (2019–20: 61 councils) met their legislative deadline
- 10 (2019–20: 10 councils) met the extended time frame granted by the minister (the minister for local government may grant an extension to the legislative time frame where extraordinary circumstances exist)
- 3 (2019–20: 4 councils) that received ministerial extensions did not meet their extended time frame.
Councils’ financial statements are reliable
For those councils for which we issued audit opinions, we found the financial statements were reliable and complied with the relevant laws and standards. We included an emphasis of matter in our audit report for Wujal Wujal Aboriginal Shire Council to highlight uncertainty over its ability to repay its debts as and when they arise.
One controlled entity, Local Buy Trading Trust (controlled by the Local Government Association of Queensland Ltd) received a qualified opinion because it was unable to provide us with enough evidence to confirm the revenue it recorded was complete.
We also included emphases of matter in our audit reports for 13 entities controlled by local governments because:
- 9 had decided to wind up their operations
- 2 were reliant on financial support from their parent entities
- one had uncertainty over its ability to repay its debts as and when they arise
- one was not able to demonstrate an account balance was correct.
Not all local government entities are required to prepare financial statements or are required to be audited by the Auditor-General. Appendices F and G provide a full list of these entities.
Status of unfinished audits from previous year
At the time we tabled Local government 2020 (Report 17: 2020–21) in April 2021, 2 councils and 7 council-related entities had not finalised their 2019–20 financial statements. Except for one council‑related entity (Western Queensland Local Government Association), all of them subsequently did so.
Palm Island Aboriginal Shire Council received a qualified opinion regarding the completeness and accuracy of the revenue it reported in its financial statements.
We included an emphasis of matter in our audit opinion for TradeCoast Land Pty Ltd (controlled by Brisbane City Council) to draw attention to a litigation matter.
The other council and the remaining 5 council-related entities all received unmodified opinions.
Appendix H provides a full list of these entities and the results of their audits.
Poor financial statement processes continue to impact on the timeliness of reporting
Queensland councils have until 31 October each year to have their financial statements certified. This is 2 months more than Queensland state entities are allowed.
For several years, we have emphasised to councils the importance of having us certify their financial statements ahead of the legislative deadline. By providing audited financial statements early to the community they ensure the information is more current and relevant.
Between the 2016–17 and 2018–19 financial years, councils made significant efforts to reduce the time between the end of the financial year and the dates on which their financial statements were certified. For the year ended 30 June 2019, 58 councils had their financial statements certified 2 weeks before the legislative deadline.
This time frame deteriorated in the 2019–20 financial year when only 47 councils had their financial statements certified 2 weeks prior to the statutory deadline. This was impacted by the COVID-19 pandemic, local government elections, and the need to implement new accounting standards. However, despite councils not facing as many challenges in the 2020–21 financial year, only 36 councils had their financial statements certified 2 weeks prior to the statutory deadline. Overall, this year, 38 councils (49 per cent of councils) had their financial statements certified later than they did in 2019–20. This seems to be linked to the removal of our traffic light reporting mechanism (refer Appendix J).
Over the last 5 years, 5 councils have regularly failed to meet the legislative deadline for their financial statements. Of these, Palm Island Aboriginal Shire Council and Richmond Shire Council have not met the deadline for the last 3 consecutive years.
Figure 2A shows the time frames for certification of council financial statements over the last 5 years.
Note: * 2021 (post 31 October) includes 2 councils that are yet to complete their financial statements.
Queensland Audit Office.
Over the years, we have observed councils’ ability to meet their legislative reporting deadline has been impacted by ineffective month-end and year-end processes and poor asset management practices.
Ineffective month-end and year-end processes
Councils that have strong month-end processes are better able to produce good quality end of year financial statements and do so in less time. Year-end reporting becomes simpler when standardised monthly accrual accounting processes (recognising revenue and expenses as they are earned or incurred, regardless of when cash has been received or paid) are implemented.
Some examples of strong month-end processes include:
- checking key balances against supporting documents in a timely manner
- keeping general ledgers up to date, particularly with regard to assets
- implementing quality reviews over month-end financial reports by staff independent of those who prepared the reports
- providing complete information that assists councils in their decision-making process – this includes monthly financial reports that are prepared using accrual accounting processes.
This year, we identified 73 deficiencies (weaknesses in processes) in addition to 84 unresolved deficiencies from prior years, across 60 councils where improvement was required to ensure timely and reliable month-end and year-end reporting.
The most common issues were:
- At 31 councils, important balances in the financial statements were not being matched to supporting documents in a timely manner or were not being matched at all.
- At 10 councils, the quality review over month-end and year-end financial reports was either inadequate or non-existent.
This year we asked councils to perform a self-assessment of their financial statement preparation process (discussed further in this chapter). This self-assessment identified that 46 councils (almost two-thirds of the sector) have not adopted accrual accounting processes for key balances in their monthly financial reports. This means that management and councillors are not provided with complete information to make decisions.
We continue to recommend councils improve financial reporting by strengthening their month-end and year-end financial reporting processes. Appendix D provides the full prior year recommendation and status as at 30 June 2021.
Asset management, maintenance of asset data, and asset valuation continue to present challenges
This year, 5 councils did not meet their legislative time frames because they were unable to have their asset valuations completed in time. In addition, 9 councils (2019–20: 9 councils) have recognised assets of $108 million (2019–20: $230 million) in their financial statements for the first time, even though these assets existed in prior years. This is due to not maintaining good asset data in their systems.
Common issues we continue to see with asset management, asset valuation, and asset data maintenance processes are:
- delays in engaging with external valuers in determining fair values (the amounts for which the assets could be sold in a fair transaction), resulting in delays in preparing financial statements
- individual parts of assets not being recorded correctly, resulting in incorrect values being assigned to the assets
- inadequate review of information provided by external valuers, resulting in a number of errors (identified by the auditors) and increasing the amount of time needed to complete the audit of the financial statements.
Asset management is critical to the long-term sustainability of councils. If they do not budget appropriately for the significant cost of maintaining, replacing, or upgrading assets (such as roads), they risk being unable to provide safe and consistent services.
We continue to find councils with asset management plans that are not current or complete. This year, we identified 11 councils (2019–20: 11 councils) who either had out-of-date or incomplete asset management plans. This may negatively affect their ability to maintain their assets to meet the needs of their communities.
This is particularly important for large and growing councils, due to their larger asset base and the changing needs of their communities. However, all councils need a good asset management plan to ensure their assets are maintained at a level that services their communities and meets their expectations.
A good asset management plan is reliant on good asset data, which should be maintained in councils’ financial systems as well as in their geographical information systems. (Councils use geographical information systems to capture, store, and manage detailed components of assets such as roads, bridges, and dams.) Data in these 2 systems should always match, and any differences should be resolved in a timely manner.
We continue to recommend councils improve their asset valuation and asset management practices. Appendix D provides our full recommendation from 2020–21, which still requires further action by councils.
We are currently undertaking a performance audit on improving asset management in local government. Our audit is examining whether councils are effectively managing their infrastructure assets to maximise services to the community, while minimising the total cost of owning these assets.
While councils have self-assessed their financial statement preparation processes as ‘mature’, many still need improvement
This year, we asked councils to undertake a self-assessment of their financial statement preparation processes using the maturity model on our website at www.qao.qld.gov.au/reports-resources/better-practice. The model considers the size, nature, and unique challenges of each council (including the geographical location) when assessing the maturity of financial statement preparation processes. This is in recognition of the fact that what works for a council in a large city may not necessarily work for a council in a regional town.
By self-assessing their current practices, councils can identify opportunities to strengthen their financial statement processes.
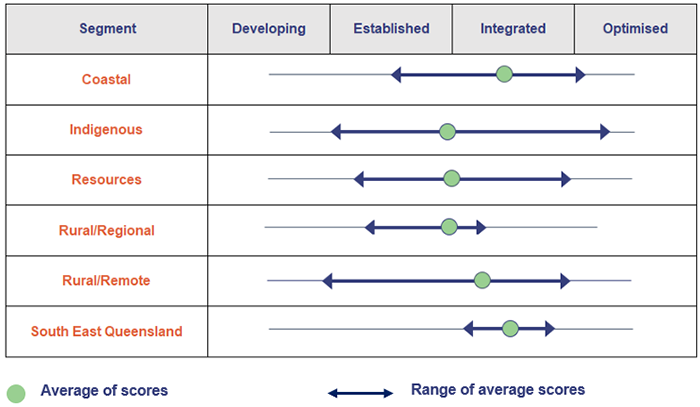
In Figure 2B, we have summarised the maturity levels for the sector at a segment level (as defined by the Local Government Association of Queensland – refer Appendix B) based on councils’ self-assessed scores. This graph shows the minimum and maximum score for each component of the model, and the average of all scores. Individual scores for each council vary.
Queensland Audit Office.
The time it takes to have the financial statements certified is directly related to how strong or weak a council’s financial statement processes are. The stronger the processes, the better prepared councils are to have their financial statements certified within a reasonable time after 30 June.
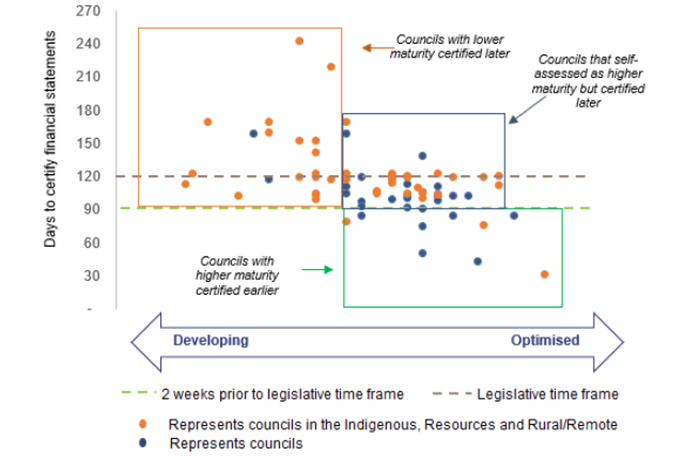
In Figure 2C, we have compared the self-assessed maturity levels and the number of days it has taken councils to have their financial statements certified for the 2020–21 financial year.
Queensland Audit Office.
We would expect that those councils with higher maturity scores should be able to have their financial statements certified within a reasonable time after 30 June each year. Councils with lower maturity scores generally take longer.
While this holds true for the majority, as demonstrated in Figure 2C above, 22 councils have self‑assessed their maturity to be relatively high but were unable to have their financial statements certified earlier. Of these, 14 councils are within the Indigenous, Resources and Rural/Remote segments.
In Figure 2D, we have shown the average number of days it has taken all segments to have their financial statements certified from 30 June for the 2018–19 to 2020–21 financial years.
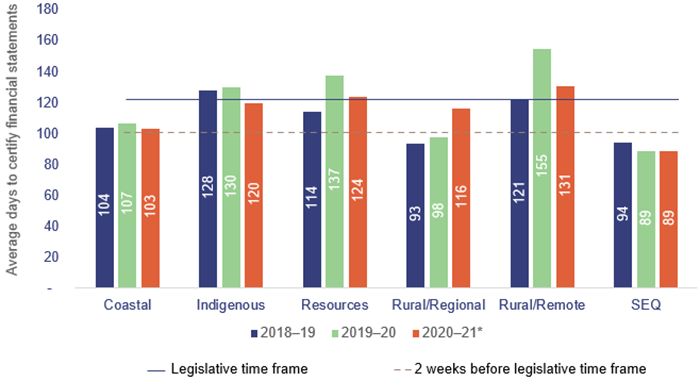
Note: * Richmond Shire Council in the Rural/Remote segment and Palm Island Aboriginal Shire Council in the Indigenous segment have not completed their financial statements for the 2020–21 financial year and have been excluded in the average days calculation for financial year 2020–21.
Queensland Audit Office.
In most years, the average days taken by the Indigenous, Resources and Rural/Remote segments to have their financial statements certified has exceeded the legislative deadline – suggesting that this is a systemic issue for many councils in these segments. These 3 segments have generally found it difficult to attract and retain qualified staff – which has resulted in poor processes, which in turn has affected the timeliness and quality of the financial statements over the years.
Recommendation for all councilsReassess the maturity levels of their financial statement preparation processes in line with recent experience to identify improvement opportunities that will help facilitate early certification of financial statements (REC 1) |
|
All councils should reassess their initial self-assessment against the financial statement maturity model and compare this to their recent financial statement preparation experiences. Councils should also reflect on their processes from the 2018–19 financial year that enabled them to have their financial statements certified earlier. Together, these reflections will identify improvement opportunities to assist elected members and their executives to improve the timeliness of certification of financial statements. |
3. Internal controls
Internal controls are the people, systems, and processes that ensure an entity can achieve its objectives, prepare reliable financial reports, and comply with applicable laws. Features of an effective internal control environment include:
- a strong governance framework that promotes accountability and supports strategic and operational objectives
- secure information systems that maintain data integrity
- robust policies and procedures, including appropriate financial delegations
- regular management monitoring and internal audit reviews.
This chapter reports on the effectiveness of councils’ internal controls and provides areas of focus for improvement. When we identify weaknesses in the controls, we categorise them as either ‘deficiencies’, which need to be addressed over time, or ‘significant deficiencies’, which are high risk and need to be addressed immediately.
Chapter snapshot
There are fewer unresolved significant deficiencies, but strong governance is still needed to improve the control environment
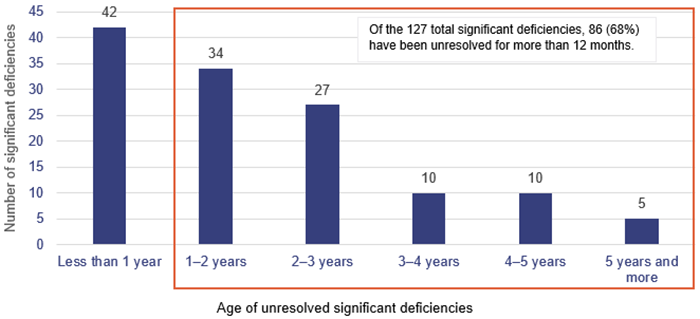
Over the last 5 years, councils have made significant progress in reducing the number of unresolved significant deficiencies relating to internal controls. Figure 3A shows the total significant deficiencies we have identified in the sector, along with the number that have remained unresolved over the last 5 years.
Queensland Audit Office.
Although the number of unresolved significant deficiencies has been reducing, 68 per cent of them have been unresolved for more than 12 months, as shown in Figure 3B.
Queensland Audit Office.
A significant deficiency is a deficiency or a combination of deficiencies that requires immediate remedial action. When a significant deficiency is identified, councils should allocate enough resources to resolve it as a matter of priority. If remedial action is not taken in a timely manner, significant deficiencies may result in substantial financial or reputational loss to councils – which in turn may impact on their financial sustainability (see Appendix J for details of our assessments of councils’ financial governance).
Councils that have strong leadership and governance – which includes having an effective audit committee and internal audit function – together with qualified staff, generally have resolved their significant deficiencies in a timely manner.
As at 30 June 2021, we note that:
- 57 per cent of the unresolved significant deficiencies were at councils that did not have an effective audit committee and an internal audit function (this is discussed later in this chapter)
- 52 per cent of the unresolved significant deficiencies were at councils that have a higher risk of being financially unsustainable.
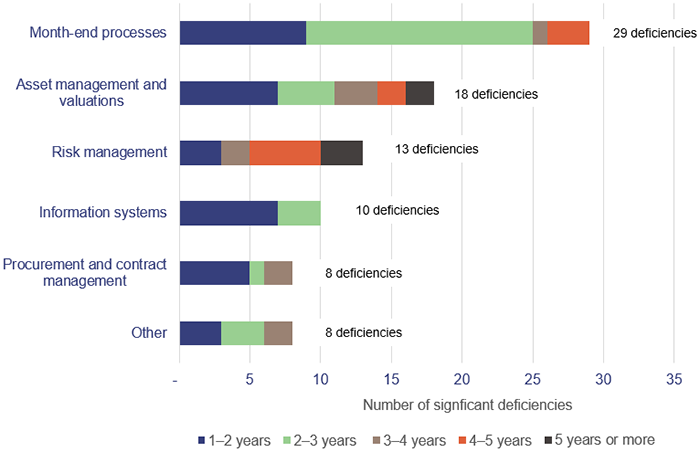
Figure 3C shows the common significant deficiencies that have been unresolved for more than one year.
Queensland Audit Office.
These unresolved significant deficiencies in Figure 3C have been identified for several years. This is discussed later in this chapter.
Audit committees and internal audit functions
Audit committees provide oversight of an entity’s internal control environment, financial reporting processes, risk management, and internal and external audit functions. Audit committees also hold management to account in overseeing the timely resolution of audit issues and would help councils take appropriate action on the long outstanding issues across the sector.
For several years, we have stressed the importance of audit committees and internal audit functions in strengthening the control environments of councils.
Despite this, as at 30 June 2021, there are still 15 councils (30 June 2020: 16 councils) that did not have an audit committee. In addition, 2 councils had audit committees that did not meet during the year, and 3 councils had committees that met only once. Councils who met less than twice during the year did not meet their minimum requirements (2 meetings) under the legislation.
In all, this means 20 councils did not have an audit committee function established at 30 June 2021.
An internal audit function further strengthens a council’s control environment by assisting councillors and management to improve internal controls, risk management and governance processes through independent reviews.
Every council in Queensland is required to have an effective internal audit function under the legislation. Yet, at 30 June 2021, 12 councils were in breach of the legislation – 6 councils (30 June 2020: 7 councils) did not have an internal audit function and another 6 councils with an internal audit function did not have any audit activity during the 2020–21 financial year (7 in 2019–20).
In our report Effectiveness of audit committees in state government entities (Report 2: 2020–21), we identified several actions for entities and audit committee chairs to improve the effectiveness of their audit committees. We plan to undertake a similar review of the effectiveness of audit committees in local government in coming years.
Recommendation for all councilsAssess their audit committees against the actions in our 2020–21 audit committee report (REC 2) |
|
Those councils who have an audit committee function, and those that are looking to establish one, should consider implementing the actions we have identified in our report Effectiveness of audit committees in state government entities (Report 2: 2020–21). This would improve the effectiveness of their audit committees, with flow-on benefits to council governance and performance. |
Common internal control deficiencies across the sector
In all, 47 councils have at least one significant deficiency that needs to be addressed. Many of these deficiencies are the same as those identified in our prior year recommendations that still required further action as at 30 June 2021. (Refer to Appendix D for full recommendations and status of implementation.)
We recommend councils address these internal control deficiencies to help strengthen their control environments.
Weaknesses in information system controls are prevalent across the sector
Local governments rely on information technology systems to operate their businesses and prepare their financial statements. They must have strong controls over who has access to the systems and over the information in them. Weaknesses in information technology controls increase the risk from cyber attacks, undetected errors and potential financial loss, including through fraud.
Last year, in Local government 2020 (Report 17: 2020–21), we reported that the most common internal control deficiency across councils related to the security of information systems. In that report – and in all our public sector reports that year – we recommended that entities strengthen the security of their information systems.
This year, our audits identified 67 new internal control deficiencies with respect to councils’ information systems. These are in addition to the 28 information systems internal control deficiencies that are unresolved from previous years. As at 30 June 2021, 45 councils (30 June 2020: 32 councils) did not have sufficient controls in place to protect their information systems.
The most common weaknesses in information systems controls were in relation to incorrect levels of system access assigned to staff, which can lead to the processing of transactions that have not been correctly authorised. Councils should ensure their staff have an appropriate level of access to information systems to perform their role within the organisation, but no more than that.
Since the start of the COVID-19 pandemic, cyber threats have intensified in frequency and sophistication. This makes it even more important that organisations promptly fix any weaknesses in their systems.
This year, there has also been a significant increase in malware (malicious software intended to create damage to a computer, network, or server) threats. This is consistent with the Australian Cyber Security Centre ACSC Annual Cyber Threat Report 2020–21, which noted a 15 per cent increase in ransomware cyber crime (malware that blocks access to a device and data until the owner pays a ransom fee) reported to its ReportCyber website since 2019–20.
Another critical element in managing the risk of a cyber incident is to provide adequate training to staff on cyber threats and educate them on the impact such incidents have on councils’ operations.
In our report Local government entities: 2018–19 results of financial audits (Report 13: 2019–20), we recommended councils develop and implement mandatory cyber security awareness training for all staff. As of this year, 20 councils had not provided this training to their staff.
Councils are not adequately managing their risks
Councils operate in a complex environment and continue to face change and uncertainty. They must identify and manage risk effectively in order to have the ability to deliver the desired outcomes to their communities.
This year, we found that 22 councils (2019–20: 29 councils) still do not have enough processes in place to identify and manage risk. Commonly, they:
- either do not have a risk management framework, or have one that is outdated
- do not have a complete risk register that captures the risks they are exposed to
- either have no business continuity and disaster recovery plans, or have plans in draft forms that have neither been approved nor tested to confirm they would be effective in the event of a disaster
- have either not completed a fraud risk assessment or have not adequately assessed their risk of fraud.
Procurement and contract management practices are still weak
Each year, the local government sector spends approximately $8 billion in procuring goods and services from various suppliers and service providers.
To achieve value for money from their purchasing activities, councils need to ensure that they have strong procurement and contract management practices. As at 30 June 2021, 29 councils (2019–20: 31 councils) still had weak practices. Of these, 19 councils have not addressed these weaknesses for more than 12 months.
Common weaknesses we noted were that councils:
- were not obtaining sufficient tenders/quotes for the purchase of goods or services. This means that these councils were not ensuring if they were getting the best price for the goods and services they procured
- were procuring goods prior to entering into an agreement with the supplier. This could lead to disagreements over the terms of the purchase
- either did not have a contract register (which includes key information about all contracts, including dates and values) or had incomplete contract registers. In both cases, they were not able to effectively manage their contracts
- were not performing checks when changes were made to vendor information (which could mean payments could be misdirected).
Assessment tools for internal controls
We are developing new assessment tools for internal controls relevant to public sector entities. They will provide the entities with greater insight into the strength of their internal control processes.
These tools focus on asset management, change management, culture, governance, grants management, information systems, monitoring, procure-to-pay (the whole procurement process), record keeping, and risk management.
We are currently consulting with our clients on these tools and intend to begin using them in our audits from 2021–22. Our reporting on internal control deficiencies will not change.
4. Financial performance
This chapter analyses the financial performance of councils, with emphasis on their financial sustainability.
Chapter snapshot
Common challenges in achieving financial sustainability
Local governments were established to provide 4 essential services to their communities – roads, water, waste collection, and wastewater. However, local governments in regional Queensland (which represent 70 per cent of the sector in terms of the number of councils) provide various other services to their communities, such as airports, and child and aged care centres.
In more populous areas, these services are generally provided by private sector entities, but they are often not financially viable in regional parts of the state. As such, regional local governments take the responsibility of providing these services to meet the needs of their communities. In most cases, the cost of providing these services outweighs the revenue they generate.
Geographically, Queensland is a large state (almost twice the size of New South Wales and Victoria combined). Given the vast nature and diverse spread of the local government areas, each community is very reliant on its own local economy. The further these communities are away from larger cities, the lower their population density and the lower the number of businesses offering employment opportunities. As a result, local governments in regional Queensland become the primary employers in their regions.
In addition, Queensland has a smaller population (when compared to New South Wales and Victoria). This means it has less ability to generate revenue – particularly from general rates, the primary source of revenue for councils, which are used to maintain a significant amount of infrastructure to meet the needs of communities. Having a low revenue base and a large infrastructure asset base to maintain adds significant financial pressure to councils in Queensland.
These factors make it difficult for councils, especially in regional Queensland, to be financially sustainable.
In Figure 4B, we have compared some of the relevant statistics in Queensland, New South Wales, and Victoria.
|
State |
Land area km1 in ‘000 |
Working population1 |
Number of businesses1 |
People employed per km2 | Rates revenue per km2 |
|---|---|---|---|---|---|
|
Queensland |
1,800 |
2,666,600 |
921,600 |
1.48 | $3,921 |
|
New South Wales |
809 |
4,160,000 |
1,635,213 |
5.14 | $7,431 |
|
Victoria |
227 |
3,471,300 |
1,310,965 |
15.29 | $28,577 |
Note: 1 sourced from Australian Bureau of Statistics; 2 calculated by Queensland Audit Office.
Queensland Audit Office.
As a result of these factors, many Queensland local governments have, over the years, relied on grants from the Queensland and Australian governments to sustain their operations and replace/construct community assets.
Financial sustainability measures – now and in future
The financial sustainability of councils in Queensland is measured using the following legislated ratios, which are explained in the Financial Management (Sustainability) Guideline 2013:
- operating surplus ratio – the extent to which operating revenues (revenues generated by councils from their day-to-day business) cover operating expenses
- net financial liabilities ratio – the extent to which the operating revenues can meet liabilities
- asset sustainability ratio – the extent to which assets are replaced as they reach the end of their useful lives (number of years an entity expects to be able to use an asset).
All councils, regardless of their nature, size and unique challenges, have been expected to use these ratios and achieve the same target benchmarks (detailed in Appendix I) to measure their financial sustainability. The department has recognised that this one size fits all approach could be improved and is developing a new financial sustainability framework.
Consultation is taking place with councils and other stakeholders in the local government sector on the new framework, which is expected to be implemented in the 2023–24 financial year.
The new framework will introduce various ratios to measure councils’ operational and asset sustainability. The benchmark for each ratio will vary depending on the category of a council. How councils will be categorised is yet to be determined in the new framework.
The overall financial sustainability of the sector has improved but is still below pre-pandemic levels
Councils have started to recover from the financial impacts of the COVID-19 pandemic. In the 2020–21 financial year:
|
| Of the remaining councils, 3 councils paid down their debts substantially to improve their net financial liability ratio and one council invested more in its assets to improve its asset sustainability ratio |
|
Reliance on grants
Given the significant role grants play in the operations of some local governments, this year we have continued to group councils and analyse their financial sustainability risk based on their dependency on grants.
Figure 4C shows the financial sustainability risk of councils, categorised by their reliance on grant revenue.
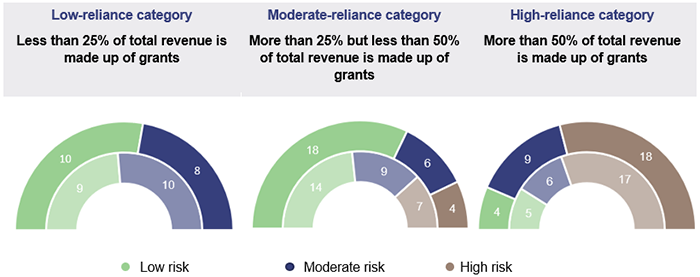
Note: Light shaded (inner) colours represent financial year 2019–20 and the dark shaded (outer) colours represent financial year 2020–21.
Queensland Audit Office.
This year, 3 more councils have become highly reliant on grants and one less council has a low reliance on grants. This was expected, given additional grants were made available to councils to help them recover from the COVID-19 pandemic.
As at 30 June 2020, these councils were close to the thresholds (25 per cent and 50 per cent respectively) for being classified under the moderate and high reliance categories, but none of them experienced a change in financial sustainability risk as a result of their increased reliance on grants.
Grant funding to local governments is provided for operational (day-to-day business) and capital purposes (for building/maintaining community assets). In last year’s report, we recommended the department provides greater certainty over long-term grant funding. Such certainty would allow councils to develop strategies to attract new industries and people to their areas and maximise any investment that is made in community assets (such as roads).
The department has partially implemented this recommendation, with 2 capital grants in the 2020–21 financial year being offered as a 3-year program. It is undertaking further reviews to offer long-term funding for future capital grants.
Councils are best placed to know what their long-term funding needs are – most of which are to acquire a new asset, replace an existing asset or renew a current asset (together known as capital projects). Spending for these capital projects is significant and is usually incurred over more than one financial year.
An effective asset management plan would inform councils on the timing and cost of their capital projects, including the cost of maintaining these assets – and allow them to have meaningful discussions with the department about their long-term funding needs. This will also provide better information to the department on the timing of capital funding required by councils.
While councils are recovering from the financial impact of the COVID-19 pandemic, they are still finding it challenging to generate surpluses
For the 2020–21 financial year, 35 councils (2019–20: 21 councils) generated operating surpluses. This is an improvement on last year and is consistent with the results before the pandemic.
As discussed earlier in this chapter, Queensland councils – particularly those in rural and remote regions – face a number of challenges. These can impede their ability to generate operating surpluses. For these councils, some alternate ratios to measure financial sustainability need to be considered.
One such ratio is the unrestricted cash expense ratio. It assesses the number of months a council could continue to operate, using only its unrestricted cash balance (unrestricted cash is money that is not required to be spent on specific things, for example, construction of an asset), based on its current monthly expenses.
In our report, Local government entities: 2017–18 results of financial audits (Report 18: 2018–19) we highlighted the importance of this ratio to the sector. The department, in its proposed financial sustainability framework, is considering mandating this ratio for all councils. Under the draft framework, the benchmark for this ratio would depend on the categorisation of councils, which is yet to be determined.
The unrestricted cash expense ratio provides information to councillors and executive management on how much cash is available for the council’s operational and emergent spending. As such, this is a key liquidity ratio that should be reported in councils’ monthly financial reports, regardless of whether the department mandates this ratio in the new sustainability framework.
We expect that councils would generally have between 3 and 6 months of unrestricted cash reserves at any point in time. This will, however, be impacted by their rating periods – generally being either quarterly or biannual. The following benchmarks, commonly reported in other Australian jurisdictions, assess the adequacy of cash balances held as:
- inadequate – less than 3 months
- adequate – 3 to 6 months
- more than adequate – 6 to 12 months
- possibly excessive – greater than 12 months.
Figure 4E shows each council’s unrestricted cash expense ratio at 30 June 2021. Given the categorisation of councils is currently being determined under the proposed framework, for the purpose of our analysis we have categorised councils based on the segments as defined by the Local Government Association of Queensland.
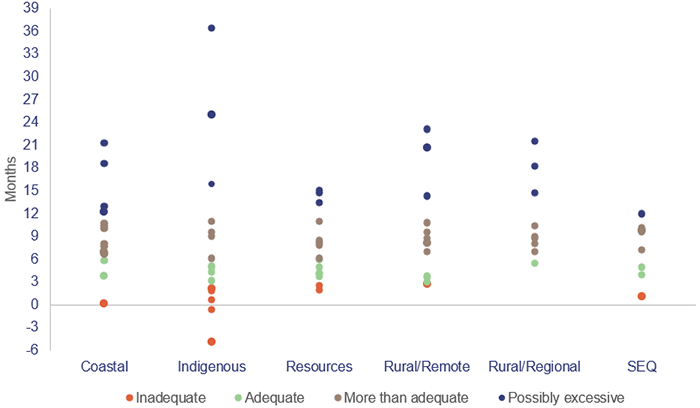
Queensland Audit Office.
On 30 June 2021, 11 councils had inadequate cash reserves, which suggests that these councils may not have good cash management processes. Good cash management processes ensure that councils have maintained sufficient cash balances to meet their planned operational expenses, and any unforeseen expenditure that may arise. Some principles of good cash management are:
- preparing a thorough and realistic budget and cashflow forecast
- periodically measuring actual performance against budget, and resetting the budget where necessary
- collecting revenue from rate payers and granting bodies in a timely manner
- avoiding unplanned spending where possible.
Some councils manage their cash position by using overdraft facilities (loans) available through the Queensland Treasury Corporation. These loans are short term in nature and are available for councils to drawdown as and when needed with the expectation that the loan is repaid when a council’s cash balance improves. To access these overdraft facilities, councils need to demonstrate their ability to generate sufficient revenue to repay the loan.
Councils with poor cash management processes combined with consistent operating deficits would not have the ability to pay down these loans and, consequently, would be unlikely to secure such an overdraft facility.
Of these 11 councils, 2 councils have a negative unrestricted cash balance, meaning they have likely used grant funding received for specific purposes (such as to construct a community asset) for their day‑to-day operations. This would represent a breach of their grant agreements.
Large unrestricted cash expense ratios should be supported by robust long-term capital budgeting, risk management and investment strategies. Strategies for holding cash are appropriate where councils have specific projects planned and have made an informed decision to not use debt due to their inability to make repayments while maintaining council service levels.
On 30 June 2021, 17 councils have cash reserves that are ‘possibly excessive’. Of these, 6 councils’ unrestricted cash reserves are more than their borrowings with Queensland Treasury Corporation. If these councils have no specific planned projects that would require them to spend their cash reserves, they could consider paying down some of their borrowings. This will reduce the interest costs on their borrowings, and consequently improve their financial performance.
While the unrestricted cash expense ratio is a good ratio for assessing operational performance, it is a point-in-time measure – meaning it does not measure councils’ performance for the entire financial year. However, reporting this ratio on a regular basis, together with the balance of unrestricted cash, would assist elected members and executives in making appropriate financial decisions.
The sector continues to invest in community assets while keeping debt levels relatively low
Councils continue to invest in community assets. For the 2020–21 financial year, total investment in community assets was $4.2 billion (2019–20: $4.2 billion). Funding for this investment was through a combination of capital grants, borrowings, and own-source revenue (revenue earned by councils from their day-to-day business), as shown in Figure 4F.
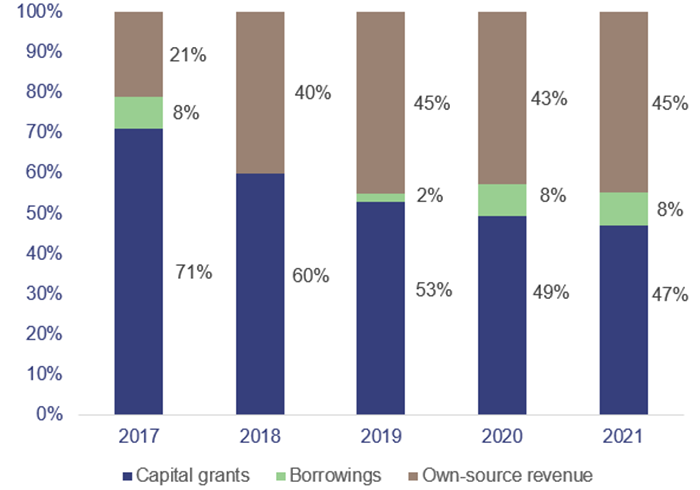
Queensland Audit Office.
As shown in Figure 4F, while the reliance on borrowings has increased, the borrowing levels have remained low across the sector. The total borrowings of the sector at 30 June 2021 were $6.2 billion (30 June 2020: $5.83 billion). This represents only 5 per cent of the value of community assets at 30 June 2021 (30 June 2020: 5 per cent).
One of the key responsibilities of local governments is to ensure that their assets are sustainable – meaning their assets meet the needs and expectations of their communities. Under the department’s guidelines, this is currently measured using the asset sustainability ratio, which approximates the extent to which councils replace their assets as they reach the end of their useful lives. In our previous reports, we have drawn attention to the fact that this ratio has its shortcomings and should be complemented with some additional ratios.
In the proposed framework, the department has considered some additional ratios for councils to supplement the current ratio to measure asset sustainability. One such ratio is the asset consumption ratio. This measures the current value of assets relative to what it would cost to build a new asset with the same benefit to the community.
Figure 4G shows the asset consumption ratio for all councils as at 30 June 2021. The proposed benchmark for this ratio is set at 60 per cent for all councils; as such, our analysis did not categorise councils by segment. We have grouped councils based on their asset consumption ratio, as follows:
- lower than proposed benchmark – where councils’ asset consumption ratio is below 60 per cent
- risk of not meeting proposed benchmark in the next few years – where councils’ asset consumption ratio is between 61 and 65 per cent
- currently above proposed benchmark – where councils’ asset consumption ratio is greater than 65 per cent.
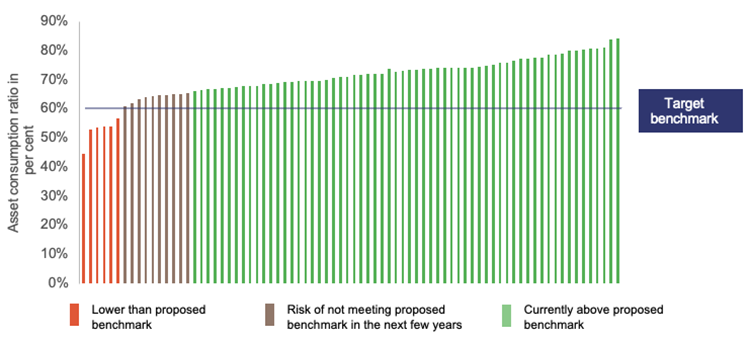
Note: Each line in the graph represents a council. Names of the councils have been withheld.
* The 2020–21 audits for Palm Island Aboriginal Shire Council and Richmond Shire Council are unfinished. The asset consumption ratios for these councils are based on the audited 2019–20 financial statements.
Compiled by Queensland Audit Office.
As at 30 June 2021, 6 councils have an asset consumption ratio of less than 60 per cent. This suggests they have used more than 40 per cent of their asset value and risk the possibility of their assets not meeting community expectations.
Another 10 councils have an asset consumption ratio of between 61 per cent and 65 per cent. While this is still within the proposed benchmark, if these councils do not take action to maintain their assets appropriately, they run the risk that they will not meet their communities’ needs over the next few years.
Of these, 5 councils’ asset management plans are outdated – meaning they do not have appropriate plans to maintain their assets at the level expected by their communities.
One of the shortcomings of the current measure – the asset sustainability ratio – is that it is positively skewed towards councils that are highly reliant on grants to replace their assets. As grant funding is used to replace assets, the expenditure on renewals is inflated in these councils, thus inflating the ratio.
This often occurs in councils in certain regions of Queensland that are impacted by natural disasters each year. These councils generally do not generate enough revenue to fund the replacement of their assets and are reliant on natural disaster funding for this purpose.
Of the 16 councils mentioned above, 9 have achieved the target ratio for asset sustainability. This is because, together, they have received $276 million in natural disaster funding over the last 5 years to assist with replenishing their assets. All these councils have either a moderate or high reliance on grants and have a combined average operating surplus ratio of negative 11 per cent. This indicates that they would not have the ability to replace their assets if they were not provided with natural disaster funding.
The asset consumption ratio is an alternate measure that would help councils in determining whether the amount of assets being used is in line with their expected level (as per their asset management plan). While this is a good measure for all councils to adopt, this is more important for those councils that are highly reliant on grants for the reasons mentioned above.
Where assets are being used more than their expected levels, councils will need to invest more in those assets to ensure they are brought up to the standard that will meet the needs of their communities. On the other hand, where assets are not used as much as expected, councils will need to revisit their asset management plans to assess whether their estimates of the assets’ useful lives are appropriate.
Local government dashboard 2021
Our interactive map of Queensland allows you to search and compare councils to view their financial performance and sustainability indicators. This tool includes information on revenue, expenses, operating costs, assets, liabilities and sustainability indicators.