
Overview
Each year, the Treasurer prepares consolidated state government financial statements. These statements separately disclose transactions and balances for the total state sector, including the general government sector. Tabled 11 February 2020.


Report on a page
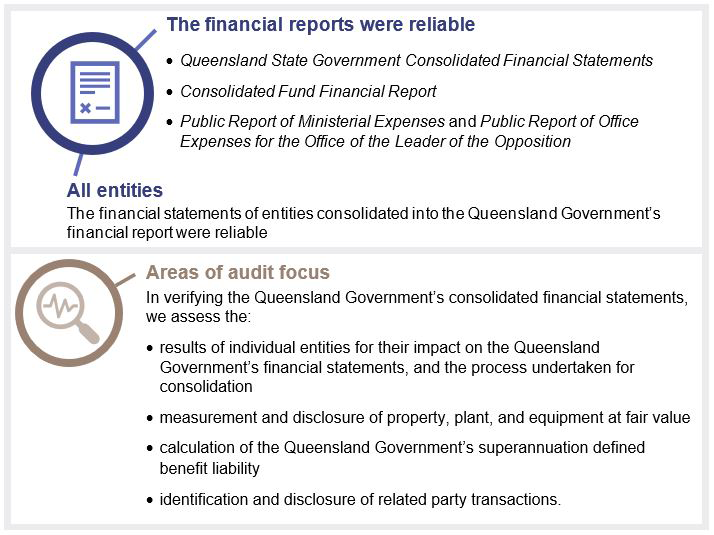
Financial reports are reliable
We found that the Queensland Government financial statements, the Consolidated Fund Financial Report, the Public Report of Ministerial Expenses, and the Public Report of Office Expenses of the Office of the Leader of the Opposition are reliable and comply with legislative requirements.
Queensland Government expenses are increasing faster than revenue
The financial performance of the Queensland Government has reduced over the last two financial years, with expenses incurred increasing at a greater rate than revenue. The Queensland Government is aiming to reduce general government sector expenses through ‘reprioritisation targets’ established in the 2018–19 State Budget.
The Queensland Government is now receiving less funding from the Australian Government from goods and services tax (GST) grants. The Commonwealth Grants Commission is reviewing its methodology for assessing each state’s financial strength, which could impact on Queensland’s future share of GST grants. These grants are expected to further decline in 2019–20.
The Queensland Government’s expenses were affected by financial assistance provided to Queenslanders impacted by severe natural disasters and climate events. The growing public sector workforce is a significant factor in the increasing expenses.
The 2019–20 State Budget forecasts revenue to be higher than expenses over the next four years, with the net operating surplus for the General Government Sector (GGS) increasing over this period.
Infrastructure investment and debt levels are forecast to increase
Queensland Government debt is expected to rise over the next four years as the government commences an expansive program of capital works. The delivery of major infrastructure projects, including Cross River Rail, needs to be closely monitored. Based on current forecasts, the increase in debt is sustainable but needs to be managed.
Government may need to fund emerging obligations
Recent court decisions and legal action may result in future additional obligations for the government, including for the class actions from the 2011 floods, and native title compensation claims. The government will need to manage the impacts of these obligations if they are realised.
1. Overview of the Queensland Government
This report analyses the consolidated position of the Queensland Government. A more detailed analysis of the results of our audits for specific industry sectors, including health, energy, water, and transport, are included in separate individual reports.
This report also refers to the non-financial public sector (NFPS), which is a combination of the general government and public non-financial corporation sectors.
Compiled by the Queensland Audit Office.
2. Results of our audits
This chapter provides an overview of our audit opinions on the:
- Queensland State Government Consolidated Financial Statements
- Consolidated Fund Financial Report
- the Public Reports of Ministerial Expenses and the Public Report of Office Expenses for the Office of the Leader of the Opposition.
The chapter also provides conclusions on our areas of audit focus.
Chapter snapshot
Chapter summary
The Queensland Government’s consolidated financial statements received an unmodified opinion in 2018–19, meaning the financial statements present a true and fair view of the state’s financial performance and position. We issued unmodified opinions for all significant entities consolidated in the Queensland Government’s financial statements.
State entities apply significant judgement in determining the fair value of their assets. The state also applies judgement in estimating its defined benefit superannuation liability. We focused on these areas in conducting our audit of the consolidated statements with satisfactory results.
Queensland Government financial statements
The Financial Accountability Act 2009 requires the Treasurer to prepare annual consolidated financial statements for the Queensland Government. The Deputy Premier, Treasurer and Minister for Aboriginal and Torres Strait Islander Partnerships certified the 2018–19 financial statements on 22 January 2020.
On 24 January 2020, we issued an unmodified audit opinion on the Queensland Government’s 2018–19 consolidated financial statements. The results in the financial statements can be relied upon.
We express an unmodified opinion when the financial statements are prepared in accordance with the relevant legislative requirements and Australian accounting standards.
Areas of audit focus
The government’s financial statements consolidate the results of all significant state entities
All entities significant to the financial performance and position of the Queensland Government were completely and accurately accounted for in the consolidated financial statements. There was no significant change to the number of entities consolidated (97 individual entities) or the composition of the sectors of government.
We issued unmodified opinions on the financial statements for each significant entity consolidated in the Queensland Government’s financial statements, including all departments, large statutory bodies and government owned corporations (GOCs). This meant we could rely on these financial statements in testing the consolidated financial statements.
The valuation of property, plant and equipment involves the use of complex methodologies to measure and disclose assets at their fair value
Our testing confirmed that the reported values of property, plant, and equipment in the consolidated financial statements were consistent with their fair value.
The Queensland Government is responsible for the stewardship of a large portfolio of assets that includes land, buildings, infrastructure, heritage, and cultural assets. Property, plant, and equipment is the largest balance on the Queensland Government’s balance sheet ($272 billion) and is reported at fair value.
There are inherent difficulties in valuing some assets due to the specialised nature of the assets and the absence of available market prices for equivalent assets (for example, roads, hospitals, and museum collections). Accordingly, entities use complex valuation methodologies that require significant judgement and estimation.
Complexity in calculating the superannuation defined benefit liability
We assessed the reasonableness of the underlying assumptions and judgement applied in determining the defined benefit superannuation liability and confirmed the value at 30 June 2019.
The Queensland Government holds the superannuation defined benefit obligation for the State Public Sector Superannuation Scheme (QSuper). At 30 June 2019, the Queensland Government’s superannuation liability for this scheme was $26 billion.
The value of this liability is assessed annually by the State Actuary. The underlying model used to value the liability is complex and involves significant judgement and estimation in selecting long-term assumptions, including salary growth, interest rates, and inflation. The valuation of the liability is highly sensitive to changes in these assumptions.
Chapter 3 includes further analysis of the superannuation liability and how it is funded.
No related party transactions require disclosure
All ministers are key management personnel of the Queensland Government for the purpose of accounting standard AASB 124 Related Party Disclosures. Each year, ministers prepare declarations identifying their related parties, as defined in AASB 124, and any transactions they are aware of between these related parties and the Queensland Government.
Our testing included an assessment of declarations made by the ministers. This confirmed there were no transactions between the Queensland Government and the ministers and their related parties that required disclosure in the Queensland Government’s financial statements.
Consolidated Fund Financial Report
The Consolidated Fund (CF) is the Queensland Government’s central bank account. Revenue and other moneys received by the government, including taxes, royalties, Australian Government grants, fines, and vehicle registration fees, are paid into the CF. Dividends paid by government owned corporations (GOCs) (to the government as their owners) are also paid into the CF.
Each year, government departments receive funding out of the CF, referred to as appropriations. The amounts appropriated to departments are approved by parliament as part of the annual state budget process.
The Financial Accountability Act 2009 requires the Treasurer to keep a ledger recording the amounts received into and paid out of the CF. The Consolidated Fund Financial Report (CFFR) acquits the amounts paid into and appropriated from the CF each year. It also acquits amounts appropriated to departments to the amounts approved by parliament.
Result of our audit
We issued an unmodified audit opinion on the CFFR on 5 September 2019, which was within the legislative deadline of 30 September 2019. Our independent auditor’s report included an emphasis of matter paragraph to draw attention to the fact that the report was prepared on a cash basis.
Public reports of ministerial expenses
Ministers and assistant ministers of the government have staff and resources to assist them in their duties. The Department of the Premier and Cabinet administers expenditure for ministerial offices and the Office of the Leader of the Opposition.
The Financial Accountability Act 2009 requires the Department of the Premier and Cabinet to prepare an annual public report of ministerial expenses.
The Opposition Handbook also requires the Leader of the Opposition to prepare, and have audited, an annual report of expenditure.
Results of our audits
We issued unmodified audit opinions on the Public Report of Ministerial Expenses and the Public Report of Office Expenses for the Office of the Leader of the Opposition on 22 August 2019.
Our independent auditor’s reports included an emphasis of matter paragraph to draw attention to the fact that these reports are prepared to fulfil the responsibilities of the Director-General, Department of the Premier and Cabinet, under the Financial Accountability Act 2009 and the Queensland Ministerial Handbook and of the Leader of the Opposition under the Opposition Handbook.
Analysis of ministerial expenses
In 2018–19, total expenses incurred by ministerial offices and the Office of the Leader of the Opposition were $47.5 million, an increase of $2.54 million (5.6 per cent) on the previous year. Since 2016, increases in these expenses have been driven by:
- increases in salaries and employee expenses
- building services and information technology costs following the move to 1 William Street.
Figure 2A below shows total office expenses for ministerial offices and the Leader of the Opposition, by category, for the past nine years.
Queensland Audit Office.
3. Financial results of the Queensland Government
This chapter analyses the financial performance, position, and sustainability of the Queensland Government.
The information in the Queensland Government’s financial statements describes its main transactions and economic events for the year. In our discussion of sustainability, we consider both financial sustainability and emerging issues relevant to the state.
Chapter snapshot
Chapter summary
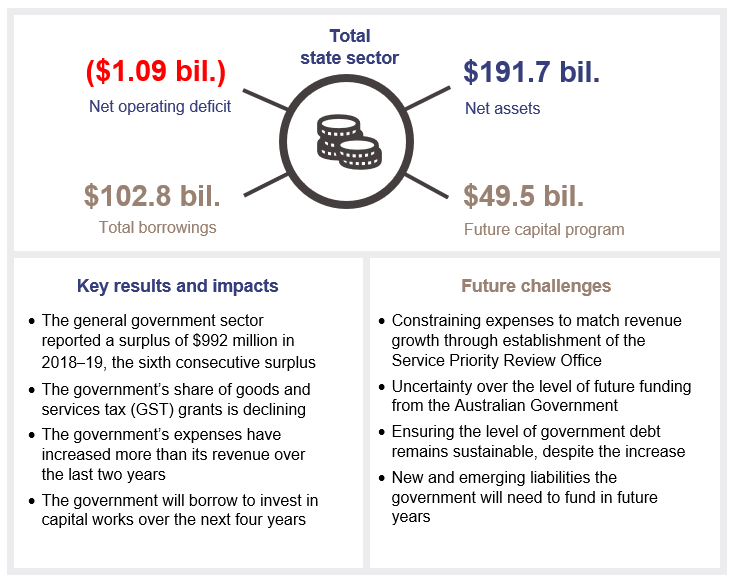
This year, the Queensland Government reported a net operating deficit of $1.1 billion for the total state sector. While the Queensland Government has continued to grow its revenue, this has not kept pace with the growth in expenses over the last two years.
The growth in the Queensland Government’s revenue this year was impacted by a reduction in the goods and services tax (GST) grant funding it received from the Australian Government. In 2018–19, this funding reduced by approximately $800 million (5.3 per cent). The funding Queensland receives from GST grants is expected to decline further in the future, although the methodology for allocating funding between the states is currently being reviewed.
The continued growth in the number of Queensland Government employees contributed to employee expenses increasing by $1.5 billion (6.2 per cent) in 2018–19.
Grant expenses increased by $1.6 billion (21.8 per cent) in 2018–19, influenced by three key factors: the impact of natural disasters in Queensland, the early payment of Australian Government grants received ahead of the 2019–20 financial year, and advance payments made to local councils as compensation for the new waste levy from 1 July 2019.
This year, the Queensland Government’s net worth (excess of assets over liabilities) remained steady. However, the Queensland Government’s net financial worth (excess of liabilities over financial assets) declined, with liabilities increasing by $11.4 billion. Low interest rates were a significant factor in increasing the reported value of the Queensland Government’s liabilities, including:
- $6.1 billion increase in borrowings
- $1.9 billion increase in the Queensland Government’s superannuation and employee entitlement obligations
- $1.9 billion increase in other liabilities associated with the government’s obligation under the National Injury Insurance, WorkCover, and National Redress schemes, and the Queensland Government Insurance Fund.
These increases largely represent changes in the measurement of the existing liabilities and do not represent significant changes in the underlying liabilities owed by the Queensland Government.
The Queensland Government holds sufficient investments to meet its future superannuation obligations. However, the increase in the government’s superannuation liability and a decrease in the value of the investments held, meant the extent to which the liability is supported, on an accounting basis, declined by $2.1 billion on the previous year.
The Queensland Government is planning to invest in a $49.5 billion capital program over the next four years, which will be partly funded by additional borrowings. As a result, borrowings are forecast to increase by $15.4 billion over this period. Based on current forecasts of revenue and operating expenses in the 2019–20 State Budget, we expect this increase in debt to be sustainable.
The financial performance of the Queensland Government reduced this year
The net operating balance is a key measure of financial performance. It shows the revenue earned by the Queensland Government against the expenses it incurred on day-to-day operations.
The net operating balance is the difference between revenue and expenses.
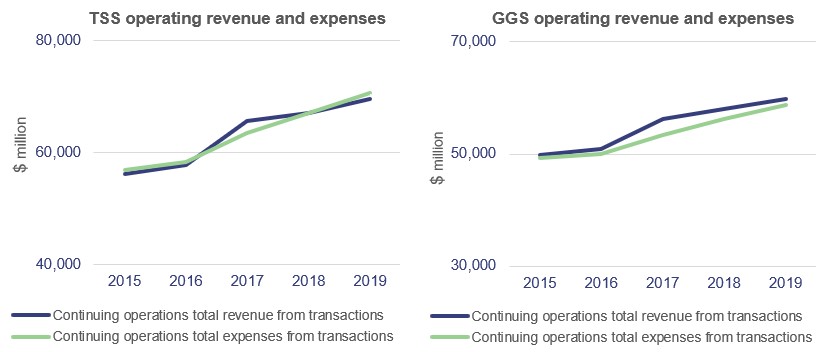
This year, the net operating balance for the total state sector (TSS) was a deficit of $1.1 billion. This means that revenue generated by the Queensland Government was insufficient to cover its expenses for the year.
The net operating balance for the general government sector (GGS) remained in surplus (revenue was greater than expenses), but this surplus has reduced over the past two years. Total revenue for the GGS included $2.8 billion in dividends and tax equivalents received from other sectors of government. While the GGS recognises these dividends and taxes as revenue, they are eliminated in the TSS because they represent transactions within the TSS itself.
In 2016–17, the TSS and GGS reported operating surpluses of $2.2 billion and $2.8 billion respectively. However, since 2016–17, expenses incurred by the Queensland Government have increased at a greater rate than the revenue it has earned, as represented in Figure 3A below. This has resulted in the erosion of the TSS surpluses reported in 2016–17.
Queensland Audit Office.
Since 2016–17, the Queensland Government’s expenses have increased by $7.3 billion (11 per cent), while it has only been able to increase total revenue by $4 billion (six per cent).
The growth in expenses over this period has been driven by increases in:
- employee expenses, including superannuation (13 per cent)
- other operating expenses (nine per cent)
- grant expenses (15 per cent).
Consistent with prior years, the health and education sectors represent the highest proportion of total state expenses, as represented in Figure 3B below.
Queensland Audit Office.
The growth in revenue has largely resulted from increases in royalties (34 per cent) and taxation (nine per cent), with growth in revenue from Australian Government grants and sales generated by public non-financial corporations slowing to three per cent.
Maintaining the Queensland Government’s revenue base
The Queensland Government has several revenue sources, some of which are influenced by factors outside of the Queensland Government’s economic policies and pricing. Figure 3C shows the composition of TSS revenue over the past five years.
Queensland Audit Office.
To be sustainable, the Queensland Government needs to maintain an appropriate balance between the revenue it receives from the Australian Government and its own-sourced revenue (for example, taxes, royalties, and sales). If the Australian Government reduces the grant revenue it provides, the Queensland Government may need to increase the revenue it generates itself to meet its service delivery costs.
Impact of changes to Australian Government grant revenue
Grants distributed by the Australian Government from the collection of the goods and services tax (GST) are the largest revenue item received by the Queensland Government. The Queensland Government can spend these grants at its own discretion, unlike other Australian Government grants, which must be spent for specific purposes such as health, education, and disaster recovery.
The Commonwealth Grants Commission distributes GST revenue to give each state the financial capacity to deliver services and associated infrastructure at the same (average) standard.
In 2018–19, Queensland’s GST grant revenue decreased because the Australian Government downsized its estimate of the GST pool and reduced Queensland’s share of the GST pool. Figure 3D shows the annual movement in the amount of GST grant revenue received by the Queensland Government over the past five years.
Note: FYE—Financial year end.
The Consolidated Financial Statements of the Government of Queensland.
The reduction in Queensland’s share of the GST pool reflects the Commonwealth Grants Commission’s assessment of the Queensland Government’s improved financial capacity to deliver services relative to other states. Queensland’s share of GST revenue is expected to decline further in 2019–20.
The commission is currently reviewing its methodology for assessing each state’s financial strength and recommending shares of GST revenue. This review is due to be completed in 2019–20 and could impact on Queensland’s future share of GST revenue, either positively or negatively.
The 2019–20 State Budget also identified that there were 19 non-infrastructure National Partnership Agreements with the Australian Government due to expire by 30 June 2020. The extent to which the Australian Government agrees to provide funding for expiring agreements may impact on the government’s ability to fund services in future years.
Increases in coal prices driving royalties
The Queensland Government receives royalties from natural resources extracted and sold by the private sector. These are mainly royalties from coal, petroleum, base metals, and precious metals.
The increase in royalties in recent years has been driven by an increase in hard coking coal prices and export volumes. In 2018–19, petroleum royalties also increased through the impact of Queensland’s liquefied natural gas (LNG) industry. Figure 3E shows the increase in royalties revenue over the past five years.
QAO audit of the Queensland Treasury.
Growth in royalty revenue is forecast to be lower in 2019–20 due to an expected gradual decline in coal prices, which are expected to return to medium-term levels during 2021. However, this should be partially offset through an increase of 2.5 per cent in the petroleum royalty rate.
Increases in taxation driven by economic activity
Taxation revenue mainly consists of transfer duties, payroll tax, vehicle registration fees, gaming taxes and levies, and land tax. The level of taxation revenue is driven by both the government’s taxation policy and key economic factors—such as economic growth, employment, consumer confidence, and wage growth.
On average, taxation revenue has grown by three per cent per year over the past five years, above the Queensland economy’s average growth of 2.3 per cent. In 2018–19, taxation growth was influenced by increases in:
- payroll tax—reflecting improved employment conditions in the mining, higher education, and energy sectors
- duties paid on transactions—including transfers of residential properties, sale of motor vehicles, and insurance contracts
- land tax—reflecting increases in property valuations and changes to land tax rates.
The government has budgeted to receive additional tax revenue in 2019–20 through the introduction of a waste disposal levy and changes to payroll tax and land tax.
While the government has capacity to grow taxation revenue by changing its taxation policies, it has a fiscal principle of maintaining a competitive taxation position.
Our analysis of the 2019–20 budgets for each state identified that Queensland is projected to rank below New South Wales, Victoria, and Western Australia in terms of tax revenue per capita. Queensland’s tax revenue per capita is also forecast to remain below the average across all states. This is consistent with the government’s fiscal principle. This is demonstrated in Figure 3F below.
QAO and 2019–20 budgets for the Australian and state governments.
Declining regulated revenue from the electricity sector
The Queensland Government generates sales revenue through government owned corporations (GOCs), which operate on a commercial basis in the energy, water, and transport sectors. Sales revenue increased slightly this year (two per cent), but this growth was lower than that experienced in previous years.
While entities in these sectors generally remain profitable, profits in the energy sector decreased because the Australian Energy Regulator reduced the amount of revenue entities can earn from transmission and distribution. This resulted in the Queensland Government receiving lower dividends from the energy GOCs this year.
Our assessments of the financial performance of energy, water, and transport GOCs are included in our sector reports on our website at www.qao.qld.gov.au/reports-resources/reports-parliament.
Expenses increasing at a faster rate than revenue
Employee expenses and the public sector workforce continue to increase
This year, full-time equivalent employees for the TSS grew by two per cent (2017–18: three per cent). In line with the government’s fiscal principles, the 2019–20 State Budget has forecast employee growth to be lower than estimated population growth of 1.75 per cent over the four‑year period from 2019–20 to 2022–23.
The increase in employees, and employee expenses, has mostly occurred in the health and education sectors. Figure 3G shows the increase in employee costs and numbers over the past five years.
The Consolidated Financial Statements of the Government of Queensland.
Increase in amounts provided for under compensation and insurance schemes
During the year, the Queensland Government recognised an increase in expenses arising from its obligations under various compensation and insurance schemes. These included:
- $780 million for future payments under the National Injury Insurance Scheme Queensland
- $300 million for future workers’ compensation claims
- $190 million provided for an agreed conditional settlement in a class action against the state (Pearson v State of Queensland)
- an additional $56 million for future payments under the National Redress Scheme for Survivors of Institutional Child Sexual Abuse.
As these represent amounts that the Queensland Government will need to pay in future financial years, they also increased the amounts provided for as liabilities in the Queensland Government’s balance sheet—from $7 billion at 30 June 2018 to $8.9 billion at 30 June 2019.
The liabilities for national injury insurance and workers compensation are fully funded through investments held by the National Injury Insurance Scheme Agency Queensland and WorkCover Queensland respectively. The liability for the settlement of the class action will be partially funded through the Queensland Government Insurance Fund.
Assisting primary producers impacted by natural disasters
The record-breaking monsoon flooding in 2019 impacted many local government areas and left behind catastrophic impact on communities, businesses, and primary producers. This resulted in the Queensland Government providing additional grants in 2018–19. In addition, the Australian Government provided an upfront payment of a three-year agreement to assist with the disaster-affected primary producers in north and far north Queensland.
The 2019–20 State Budget forecasts future expenditure of $1.4 billion arising from natural disasters that have impacted Queensland in previous years. Future expenditure may also be impacted by other natural disasters, including continuation of the severe drought conditions in parts of Queensland.
In addition to the impact of natural disasters, advance grant payments were paid to local governments in 2018–19 to:
- compensate them for the Queensland waste levy, which commenced on 1 July 2019
- pass on the Australian Government’s advance payment of financial assistance for the
2019–20 financial year.
Uncertainties in future revenue may impact on the Queensland Government’s ability to meet future expenses
Unless the Queensland Government can increase its revenue or constrain the recent growth in its expenses, it risks not being able to meet the costs of its activities from the revenue it earns going forward. As identified in this report, the Queensland Government faces several uncertainties around its future revenue including the level of grant funding provided by the Australian Government.
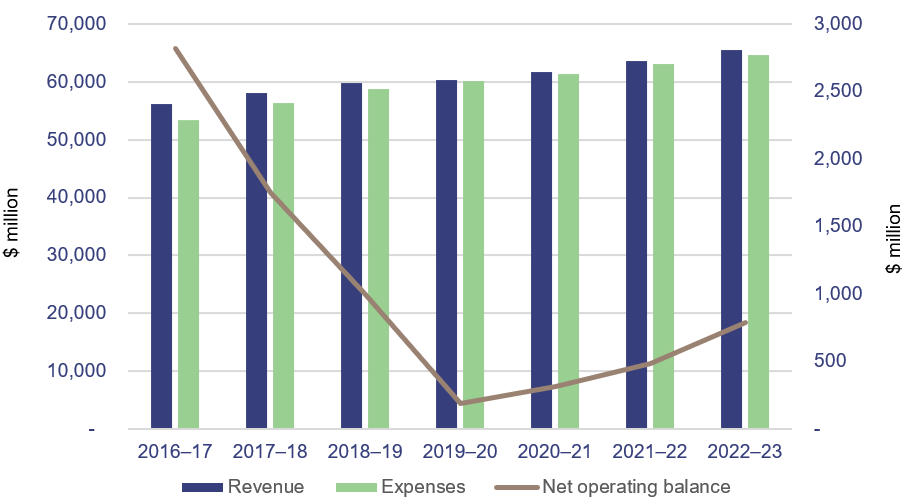
The 2019–20 State Budget has projected that, over the next four years, increases in GGS expenses will largely align with revenue growth. This would see the GGS report a small net operating surplus in 2019–20, increasing in subsequent years as represented in Figure 3H below.
Queensland Audit Office.
The extent to which the government achieves its revenue growth projections may also be influenced by general economic factors at the national and international level.
As part of the budget, the government has factored in savings of $200 million in 2019–20 and $500 million per annum from 2020–21 onwards. This is supported by the establishment of a new Service Priority Review Office in Queensland Treasury, which will aim to drive the realisation of savings by conducting reviews of Queensland public sector agencies and programs.
The Queensland Government’s liabilities are increasing
We measure financial position by assessing the state’s net worth—the difference between total assets and total liabilities. We also consider the state’s net financial worth—the difference between the state’s financial assets and its liabilities.
The government needs to maintain a strong balance sheet to provide it with stability, flexibility, and capacity to deal with emerging financial and economic pressures, and a strong foundation for providing services to the community. Figure 3I shows the net worth and net financial worth for the TSS at 30 June 2019.
Queensland Audit Office.
The TSS’s net worth increased slightly in 2018–19 (one per cent). However, the TSS’s net financial worth decreased by 12 per cent, as the $11.4 billion increase in liabilities was significantly greater than the $2.6 billion increase (three per cent) in the state’s financial assets.
Low interest rates significantly impacted the reported values of the Queensland Government’s liabilities this year by:
- increasing the market value of the total state borrowings
- reducing the discount rate applied to estimated future payments to convert them to today’s dollars when calculating the liabilities at 30 June 2019.
These impacts reflect changes in the measurement of the liabilities, and not a significant change in the underlying liability owed by the state.
The state will borrow to expand its asset base
The state borrowing program
Queensland Treasury Corporation (QTC) borrows money on behalf of the Queensland Government by issuing securities, such as government bonds. QTC on-lends these borrowings to other government entities to fund the delivery of assets and services. It may also borrow money in advance of future requirements to ensure Queensland public sector entities have ready access to funding when required and to reduce risk when refinancing maturing loans.
In 2018–19, the value of TSS borrowings increased by $6.1 billion (6.3 per cent) to $102.8 billion. This includes amounts borrowed on behalf of non-state government entities. The increase largely reflects $4.3 billion in net market value movements in borrowings as a result of lower interest rates this year. The 2019–20 budget forecasts that government debt will begin to increase from 2019–20 due to additional borrowings to partially fund the Queensland Government’s capital program.
The market value of TSS borrowings on-lent by QTC to other sectors of the Queensland Government at 30 June 2019 was $77.6 billion ($72.8 billion at 30 June 2018). In addition, $9.5 billion was on-lent to non-state government entities, such as local governments (and related water entities), universities and grammar schools, which do not form part of the TSS ($9.2 billion at 30 June 2018). Figure 3J below shows the breakdown of total QTC borrowings on-lent to other government sectors.
Investing in the state’s assets
In the five years between 1 July 2009 and 30 June 2014, the Queensland Government invested approximately $60.1 billion in capital acquisitions, an average of $12 billion per year. This included projects to upgrade and replace roads (including roads damaged through natural disasters), construct and extend hospitals, and replace and upgrade the energy supply network. Over the subsequent five years, however, this investment reduced to $38.3 billion, an average of $7.7 billion per year.
The Queensland Government’s 2019–20 budget provides $49.5 billion for infrastructure and capital works for the non-financial public sector (NFPS) over the next four years. This includes $10.2 billion in capital purchases in 2019–20, an increase of approximately 21 per cent on 2018–19.
Approximately $5.4 billion (46 per cent) of the 2019–20 capital program is for transport projects, including $1.5 billion for the Cross River Rail Delivery Authority. A further $2.3 billion (20 per cent) will be provided for capital projects in the energy sector. Our analysis of transport and energy capital investment is included in our sector reports on our website at www.qao.qld.gov.au/reports-resources/reports-parliament.
Figure 3K shows the actual and forecast investment in physical assets and the asset replacement ratio for the NFPS over 14 years. The asset replacement ratio estimates the extent to which the government is replacing its assets as they reach the end of their useful lives by comparing the capital expenditure to annual depreciation (the allocation of an asset’s value as an expense over the life of the asset).
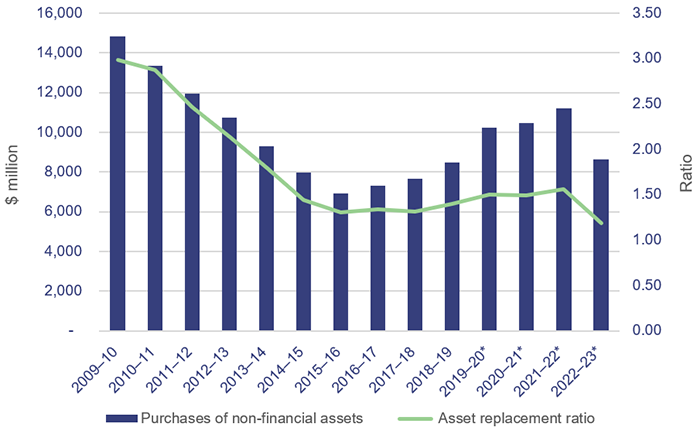
Note: * Budgeted figures.
Queensland Audit Office.
With the forecast increase in capital investment, the government will maintain an asset replacement ratio of greater than one. This means the Queensland Government will be:
- renewing or replacing its existing assets before they reach the end of their useful lives
- expanding the state’s asset base by constructing new assets.
The Queensland Government’s borrowings will increase but are currently sustainable
Between 2009–10 and 2014–15, the level of NFPS debt rose substantially. While the government has been able to reduce the level of NFPS debt in recent years, the 2019–20 budget forecasts debt to rise again from 2019–20.
NFPS debt includes amounts borrowed by QTC and on-lent to GGS and public non-financial corporations (PNFC) entities. NFPS debt excludes amounts borrowed by QTC and on-lent to non-Queensland Government entities (for example, local governments and universities) and amounts borrowed in advance of current requirements and invested by QTC.
Provided an appropriate repayment plan is in place, it can be reasonable for governments to borrow funds to invest in infrastructure. The future benefits to the community provided by these assets should compensate for the debt repayment costs. However, where debt is used by the government to fund operating expenses, it may create a burden for future generations that is not offset by future community benefit.
Based on current forecasts, the level of NFPS debt is projected to increase by $15.4 billion between 2018–19 and 2022–23, which is significantly less than the forecast capital expenditure for the period. This indicates that the additional borrowings are not forecast to be used to fund the government’s future operating expenses.
To ensure debt levels are sustainable, the Queensland Government has a fiscal principle targeting ongoing reductions in Queensland’s relative debt burden, as measured by the general government debt-to-revenue ratio. Figure 3L shows that, based on budget forecasts, the debt‑to-revenue ratio will continue to rise, but will remain below 100 per cent and below previous levels in 2012–13 to 2015–16.
Figure 3L also identifies that, since 2014–15, GGS debt has been less than 50 percent of the total NFPS debt (which includes the GGS debt). This means that a larger portion of the Queensland Government’s debt is held by entities in the PNFC sector that can repay their share of the debt from the profits they generate.
Note: NFPS—non-financial public sector; GGS—general government sector.
Queensland Audit Office.
Our review of the 2019–20 budget for each state identified that NFPS borrowings for all states are expected to increase on a per capita basis over the next three years as represented in Figure 3M below. Queensland is forecast to have the second highest level of per capita debt, behind Western Australia.
Queensland Audit Office.
However, our review of the 2019–20 budget for each state also identified that NFPS net debt for Queensland is forecast to increase at a rate below the average for the other states over the forward estimates. By 2022–23, Queensland’s NFPS net debt will be lower than that for both Victoria and New South Wales.
Net debt is the sum of borrowings, deposits held, and advances received less liquid assets (cash and deposits, advances paid, investments and loans).
The state’s liabilities for superannuation and employee benefits have increased
The Queensland Government holds the superannuation defined benefit obligation for the State Public Sector Superannuation Scheme and Judges’ Scheme.
This year, the Queensland Government’s superannuation liability increased by $1.1 billion to $26.7 billion. The value of this liability is calculated by applying the requirements of accounting standard AASB 119 Employee Benefits and is assessed annually by the State Actuary. The underlying model used to value the liability is complex and involves significant judgement and estimation in selecting long-term assumptions, including salary growth, interest rates, and inflation. The valuation of the liability is highly sensitive to changes in these assumptions.
The increase in 2018–19 reflects movements in the key assumptions applied in the actuary’s model, including the impact of lower interest rates in discounting estimated payments of future superannuation benefits. This year the discount rate applied was 1.3 per cent, representing a significant decrease in the rate applied in 2017–18 (2.6 per cent).
The Queensland Government has a fiscal principle of targeting full funding of long-term liabilities, including superannuation, based on actuarial advice. To achieve this, QTC, on behalf of the Queensland Government, holds long-term financial assets to meet future superannuation obligations. In addition, these assets may be required to meet other long-term liabilities, for example, obligations under the Queensland Government Insurance Fund (QGIF).
These long-term financial assets are held in unit trusts managed by QIC Limited. At 30 June 2019, the fair value of these assets, as reported in QTC’s financial statements, was $29.35 billion.
Queensland Audit Office.
As shown in Figure 3N, the value of the assets held has steadily decreased since 2014–15. This is due to the government’s use of surplus assets to reduce debt and payments made to employees receiving their superannuation entitlements. The value of the assets held can also be impacted (both positively and negatively) by movements in the market value of the underlying investments held with QIC Limited.
While the value of the assets held is currently greater than the value of the Queensland Government’s superannuation liability calculated under AASB 119, this surplus is decreasing. However, in assessing whether the superannuation liability is fully funded, the State Actuary calculates the liability on a ‘funding basis’, which applies different criteria to that required by AASB 119.
For example, while AASB 119 requires the liability to be calculated applying a discount rate based on government bonds, the funding basis applies a rate based on expected investment returns. The use of these rates can result in a significant difference between the surplus calculated on an accounting basis and that calculated on a funding basis.
In the State Actuary’s Actuarial Investigation of QSuper as at 30 June 2019 a discount rate of 3.75 per cent was applied in calculating the liability on a funding basis. This contributed to a surplus of $7.3 billion under the funding basis, substantially higher than that calculated on an accounting basis. The State Actuary’s report is available on the QSuper website.
In December 2019, the Queensland Government issued its 2019–20 Mid-Year Fiscal and Economic Review. The review made reference to the establishment of the Queensland Future Fund with an initial $5 billion investment. This investment will include $3 billion invested from the surplus in the defined benefit fund and $2 billion re-directed from the state government’s existing debt retirement plan. The fund will be established under an Act of Parliament.
In addition, the long service leave entitlements for some public service employees are held centrally by the Queensland Government. These long service leave entitlements are funded through a levy of 2.1 per cent of salary and wages costs, paid by participating agencies (predominantly government departments) into the Long Service Leave Central Scheme. In 2015–16, investments held by the government to meet future long service leave obligations were used to pay down debt under the government’s Debt Action Plan. The liability is assessed annually by the State Actuary.
This year, the government revised the model it uses to calculate its liability for long service leave entitlements. This resulted in a $725 million increase to the balance previously reported at 30 June 2018. A further increase of $528 million in the liability was reported for the 2018–19 financial year. The estimated liability for long service leave entitlements at 30 June 2019 is $5 billion.
The Queensland Government is facing several emerging liabilities
In addition to the existing liabilities recognised in the Queensland Government’s financial statements, there are several new liabilities that the government will, or may, be required to recognise in future years.
From 1 July 2019, with the introduction of a new accounting standard AASB 16 Leases, the Queensland Government will need to change the way it accounts for leases. Under AASB 16, the Queensland Government will need to recognise liabilities for all leases where it is the lessee. This will result in the TSS recognising lease liabilities of approximately $3.1 billion from 1 July 2019. As the standard will also require the recognition of a corresponding right-of-use asset, this is not expected to significantly impact the Queensland Government’s net worth.
In 2020–21, the Queensland Government will need to adopt another new accounting standard—AASB 1059 Service Concession Arrangements: Grantors. This standard requires the Queensland Government, as grantor, to recognise an asset and corresponding liability for service concession arrangements, a type of public–private partnership (PPP). The estimated net future cash outflows resulting from existing PPPs disclosed in the government’s 2018–19 financial statements were $11.9 billion. However, the Queensland Government is yet to complete a detailed analysis of the impact of AASB 1059 and not all existing PPP arrangements are expected to be captured by AASB 1059.
In March 2019, the High Court of Australia handed down its decision in the Griffiths v Northern Territory appeal case (known as the Timber Creek case). The decision established a precedent for quantifying native title compensation. Several native title claims that affect the Queensland Government are filed with the National Native Title Tribunal under the Native Title Act 1993 (Commonwealth). Where title has been extinguished, these compensation claims could result in a significant liability for the Queensland Government. The Queensland Government is developing a framework to settle future native title compensation claims consistent with the Timber Creek decision and is presently unable to quantify the possible compensation payable.
In March 2012, the Queensland Floods Commission of Inquiry tabled its final report on the January 2011 floods. Certain property owners impacted by the floods commenced a class action against the Queensland Government in July 2014 in the Supreme Court of New South Wales. On 29 November 2019, the court handed down a ruling in favour of the plaintiff. A decision on damages is scheduled to occur in February 2020.
On 22 October 2019, the Attorney-General and Minister for Justice proposed amendments to the Civil Liability and Other Legislation Amendment Act 2018. The proposed amendments extend the definition of abuse to include serious physical and psychological abuse, as well as sexual abuse. This would allow survivors of a wider range of abuse as children, who are not currently covered by the National Redress Scheme, to seek damages from institutions where the offences occurred. These amendments could result in potential liabilities for the Queensland Government arising from offences that occurred at government institutions.
Glossary
| Term | Definition |
|---|---|
| Accountability | The responsibility of public sector entities to achieve their objectives of delivering reliable financial reporting, effective and efficient operations, compliance with applicable laws, and reports to interested parties. |
| Accrual basis of accounting | The effects of transactions and other events are recognised when they occur (and not as cash or its equivalent is received or paid) and they are recorded in the accounting records and reported in the financial statements of the periods to which they relate. |
| Auditor-General Act 2009 | An Act of the State of Queensland that establishes the responsibilities of the Auditor-General, the operation of the Queensland Audit Office, the nature and scope of audits to be conducted, and the relationship of the Auditor-General with parliament. |
| Australian accounting standards | The rules by which financial statements are prepared in Australia. These standards ensure consistency in measuring and reporting on similar transactions. |
| Australian Accounting Standards Board (AASB) | An Australian Government agency that develops and maintains accounting standards applicable to entities in the private and public sectors of the Australian economy. |
| Capital expenditure | Expenditure to acquire assets or improve the service potential of existing assets that are capitalised to the balance sheet (which means that the cost of the assets can be allocated over the years for which the asset will be in use). |
| Controlled entities | The capacity of an entity to dominate decision-making, directly or indirectly, in relation to the financial and operating policies of another entity so as to enable that other entity to operate with it in achieving the objectives of the controlling entity. |
| Depreciation | The systematic allocation of a fixed asset's value as an expense over its expected useful life, to take account of normal usage, obsolescence, or the passage of time. |
| Emphasis of matter | A paragraph included with an audit opinion to highlight an issue of which the auditor believes the users of the financial statements need to be aware. The inclusion of an emphasis of matter paragraph does not modify the audit opinion. |
| Fair value | The amount for which an asset could be exchanged, or a liability settled, between knowledgeable, willing parties, in an arm’s length transaction. |
| Modified audit opinion | A modified opinion is expressed when financial statements do not comply with the relevant legislative requirements and Australian accounting standards and, as a result, are not accurate and reliable. |
| Net worth/net assets | Total assets less total liabilities. |
| Net debt | Total borrowings less cash. |
| Net operating balance | Total revenue less total expenses. |
| Public–private partnership | Cooperative agreements generally entered into with private sector entities for the delivery of government services. |
| Unmodified audit opinion | An unmodified opinion is expressed when financial statements are prepared in accordance with the relevant legislative requirements and Australian accounting standards. |
| Useful life | The number of years an entity expects to use an asset (not the maximum period possible for the asset to exist). |