
Overview
The entities in Queensland’s transport sector work together to create an integrated transport network, connecting Queensland’s people and businesses to support a growing economy. Tabled 6 November 2019.


Report on a page
Results of our audits
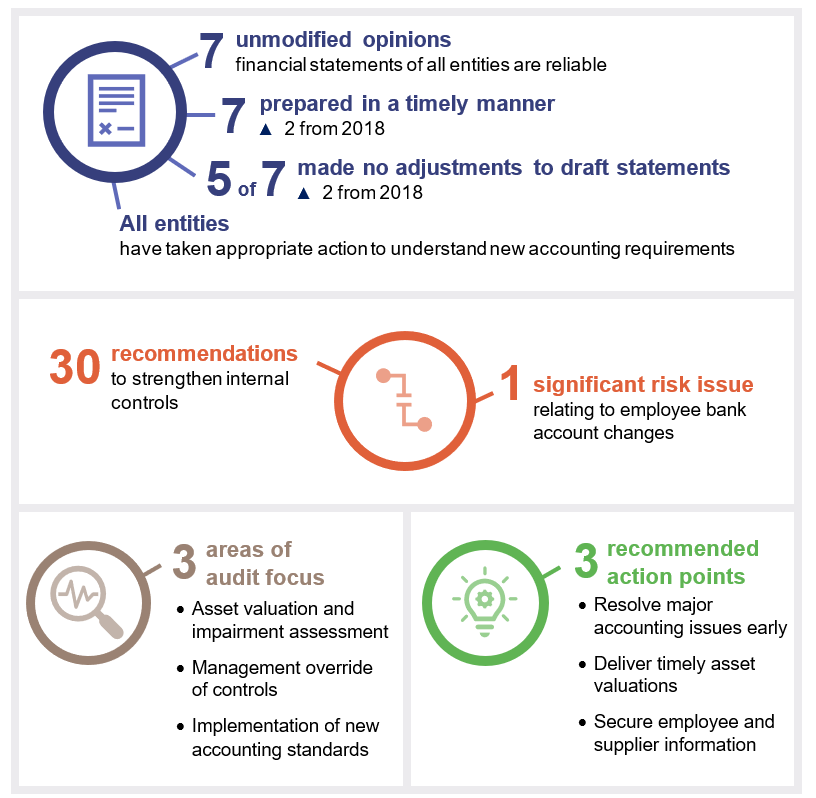
This report includes the results of our financial audits of seven Queensland Government entities in the transport sector. The financial reports prepared by these entities are reliable and comply with relevant laws and standards.
Internal controls are generally effective
We made 30 recommendations to strengthen internal controls relating to payroll and procurement processes, securing of information systems, and information technology (IT) governance and policy frameworks.
Targeted fraud attempts continue across all public sector entities. There was a successful fraud in a port entity where employee bank account details were changed as a result of phishing. Management has now strengthened controls over changes to employee bank accounts.
Increased demand for transport infrastructure
Demand on the public transport system and infrastructure is increasing due to higher population and the need to continue to support economic growth. The higher patronage resulted in increased fare revenue being collected. A number of new and extended contracts were issued to continue essential public transport services across Queensland.
Good coordination across agencies fast-tracked the recovery effort from the severe weather event that occurred across parts of north and far north Queensland.
The state is investing in several large projects in road, rail and port infrastructure to meet the growing demand on the transport network. Due to their size and complexity, governance arrangements and monitoring processes will play a critical role in the successful delivery of these projects.
Strong governance arrangements and monitoring can enable effective coordination between agencies and external private sector partners to ensure risks are appropriately managed and shared outcomes are realised.
The overall sustainability of the sector remains stable.
Actions for entities
Assess major infrastructure governance
Entities should continue to assess whether governance arrangements are ensuring major infrastructure projects achieve their objectives.
Ongoing assessments of governance frameworks are needed to ensure risks are managed effectively. Coordination mechanisms and performance monitoring systems need to be able to assign responsibility clearly and accurately report emerging risks and issues relating to timeliness, cost, quality, and scope during the delivery of major infrastructure projects.
Given the complexities, entities should ensure enough resources are available to manage how agencies and external partners communicate and work together.
Secure employee and supplier information
Entities must verify changes to employee and supplier bank account details through sources independent of the change request.
Entities need to secure information systems to prevent unauthorised access that may result in fraud or error. Security measures could include encryption of information, restriction of user access, regular monitoring by management, and appropriate segregation of duties.
We encourage entities to explore a controls monitoring solution to bring in real-time data on key financial processes. This will enable stakeholders (such as management, or those charged with governance) to identify exceptions that need to be managed, have ongoing oversight across several different control activities and make real-time decisions to address important issues or risks.
Deliver timely asset valuations
Entities should continue to ensure enough resources are allocated to complete and deliver asset valuation models and to ensure assumptions underlying asset valuations are appropriately supported.
Resolve major accounting issues early
We continue to encourage entities to ensure major accounting issues are resolved early to assist with preparing high quality and timely financial statements.
1. Overview of entities in this sector
Notes: Port entities include Gladstone Ports Corporation Limited (GPC), North Queensland Bulk Ports Limited (NQBP), Port of Townsville Limited (POTL), and Far North Queensland Ports Corporation Limited (Ports North). Queensland Rail is the statutory body and includes Queensland Rail Limited.
Compiled by the Queensland Audit Office
2. Results of our audits
This chapter delivers an overview of our audit opinions for each entity in the transport sector and evaluates the timeliness and quality of their financial reporting. It also provides conclusions on our areas of audit focus.
Chapter snapshot
Chapter summary
As with last year, we focused on how transport entities use complex models to measure their assets. We also assessed how progressed the entities were at implementing the new accounting standards for revenue and leases.
We have made 30 recommendations to strengthen internal controls.
All seven transport sector entities received unmodified opinions in 2018–19, meaning their financial statements present a true and fair view of their financial position and performance.
Audit opinion results
We issued unmodified audit opinions for all transport entities. Readers can rely on the results in the audited financial statements. All entities also met their legislated timeframes for finalising their financial reports. The audit opinions we issued are provided in Appendix C.
We express an unmodified opinion when the financial statements are prepared in accordance with the relevant legislative requirements and Australian accounting standards.
Entities not preparing financial statements
Not all Queensland public sector transport entities produce financial statements. The full list of entities not preparing financial statements and the reasons are provided in Appendix D.
Effectiveness of financial statement preparation
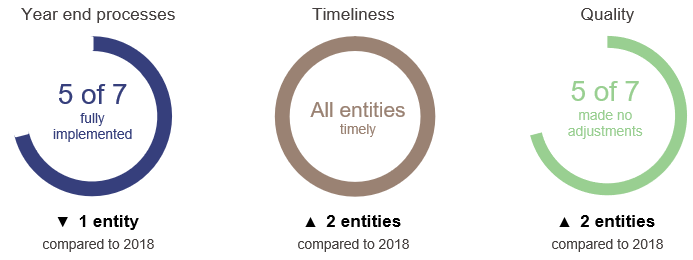
Transport entities used good quality processes to prepare their financial reports and presented timely and accurate draft financial statements for audit.
Figure 2A shows the summary of our assessment of transport entities’ financial statement preparation processes.
Compiled by Queensland Audit Office.
Agencies are implementing improved processes to bring forward aspects of their financial statement preparation. These include resolving known accounting issues and preparing complete pro forma financial statements. Agencies in the sector could still improve year end processes by completing asset valuations earlier.
As these processes continue to mature, entities will be able to complete their financial statements earlier. This will give them more time to prepare and review annual reports and other certifications.
Overall, the quality of financial statements is improving in the transport sector. The results of our assessment for each entity and our assessment criteria are outlined in Appendix E.
Action for transport entities
We recommend entities continue to ensure major accounting issues are resolved early.
Financial reporting maturity model
We are developing a new reporting tool for assessing financial statement preparation—the financial reporting maturity model. This model will allow for an assessment of public sector entities’ processes for preparing financial reports, which can be adapted for entities of different sizes and circumstances.
We will include a self-assessment tool to help entities evaluate themselves against their expected maturity level and highlight improvement areas.
Areas of audit focus
We focus on areas with a higher risk of fraud or error in the financial statements. Risk increases when there is a higher degree of complexity or subjectivity, or when there are significant changes or developments. In the transport sector, these areas of focus were:
- asset valuations and impairment assessments
- management override of controls (departures from internal controls)
- implementation of new accounting standards.
Asset valuation and impairment assessments
All entities use complex models to estimate the value of their assets. These models are based on assumptions and can be subjective.
The transport sector has $78 billion of property, plant and equipment that is subject to revaluation or impairment.
We concluded that readers can rely on the asset valuations and impairment assessments reported in each entities’ financial statements. For each entity, we assessed the:
- adequacy of management’s annual review of the valuation process
- appropriateness of the valuation and impairment assessment methodology applied
- competence, capability, and objectivity of the experts used
- assumptions used in the process.
Action for transport entities
The sector continues to improve its completion and delivery of these models. The Department of Transport and Main Roads continues to lead in the early completion of asset valuations.
We recommend entities continue to ensure:
- enough resources are allocated to complete and deliver asset valuation models
- assumptions underlying asset valuations are appropriately supported.
Management override of controls
Management override refers to the departure from internal controls to commit fraud or influence a result or omission in the financial statements. We assess this risk on all audits.
An organisation’s culture can influence the susceptibility to management override. It can occur at all levels. The level of oversight, style of management and attitude towards maintaining appropriate systems of internal controls can affect how we design an audit.
Where relevant, we:
- evaluate key controls over financial information preparation and fraud prevention
- assess transactions with related parties (arm’s length)
- assess assumptions used in material estimates and one-off items for potential management bias.
We also used data analysis to identify risk areas and included unpredictable audit procedures in our audit programs. We provided continuous reporting on our results of testing to audit committees. We did not identify any areas of concern regarding management override of controls.
Management override continues to be an area of focus due to the potential of significant financial and reputational impact when things go wrong. Effective oversight functions that work together can help reduce the risk of management override.
Oversight function
It is becoming increasingly important for entities to have a strong value system and a culture of ethical financial reporting, due to the ability to override controls or to influence others to perpetrate or conceal a fraud.
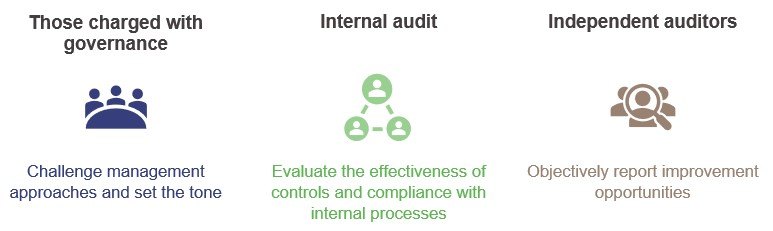
Figure 2B shows the key elements of the oversight function, which include those charged with governance, internal audit and independent auditors.
Compiled by Queensland Audit Office.
Although management is responsible for evaluating fraud risk and developing anti-fraud programs, it is the responsibility of the board of directors and/or audit committees to assess and challenge the adequacy of management’s risk assessment and response. Active oversight can help to reinforce a culture with zero tolerance for fraud.
It is important that policies, procedures and limits of authority are clear and understood. The tone at the top and from management should demonstrate a commitment to adherence of controls and doing things the right way. It should also encourage employees to report concerns about actual or suspected unethical behaviour.
Internal audit functions also assist the oversight function by evaluating the effectiveness of control systems. The use of data analytics by internal audit is an effective way to detect fraud or unusual anomalies that warrant further scrutiny. Some methods include transaction monitoring, exception reporting and analysis to detect particular types of fraud.
Independent auditors can also help by providing an assessment of the entity’s process for identifying, assessing, and responding to the risks of fraud. An open dialogue with independent auditors can contribute to strengthening the system of internal controls, and reduce exposure to fraud and misappropriation of assets.
The responsibility for preventing, detecting and responding to fraud or unethical behaviour lies with all employees. This must be led from the top by ensuring a culture and environment that promotes honesty and ethical behaviour.
Implementation of new accounting standards
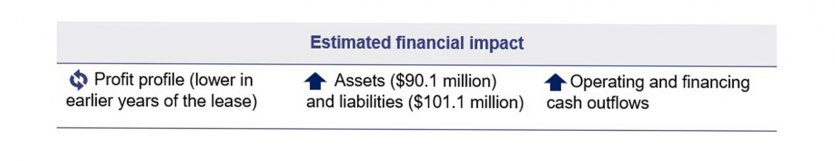
AASB 16 Leases
This accounting standard will introduce a single lease accounting model in 2019–20. The estimated impact on the transport sector is shown in Figure 2C.
Compiled by Queensland Audit Office.
Determining whether a contract meets the definition of a lease is complex. Judgement is required to assess who has the right to control the asset.
The New Generation Rollingstock (NGR) train fleet is an example of an arrangement between transport sector entities that was assessed against the new standard. Queensland Rail operates the NGR train fleet on behalf of the Department of Transport and Main Roads. When we assessed the arrangement against the AASB 16 standard, the department receives the economic benefits and directs the use of these assets. As a result, the arrangement does not fall within the scope of the standard for Queensland Rail and continues to be recognised as a service contract with the department.
AASB 1059 Service Concession Arrangements: Grantors
This accounting standard will introduce new requirements for public sector entities in recognising assets and liabilities. The aim of the standard is to provide greater transparency about the costs and future obligations of service concession arrangements (where a public sector entity has a contract with a private operator to develop, upgrade, operate, or maintain infrastructure assets).
The standard will come into effect for the 2020–21 financial reporting period. The estimated impact on the transport sector is shown in Figure 2D.
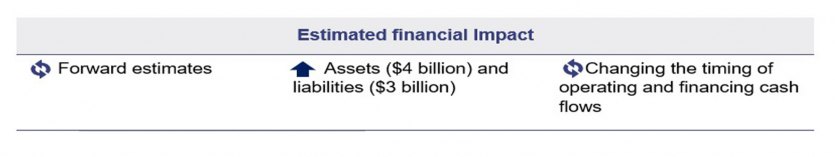
Compiled by Queensland Audit Office.
Public–private partnerships (PPPs) are long-term, complex contracts where both the public and private sectors have an interest in the underlying infrastructure. Within the transport sector, the AirportLink, Gateway and Logan Motorways are examples of PPPs that are operated and maintained on behalf of the state by a private sector operator. In return, the private sector operator is compensated by collecting road tolls from the public.
Determining if a PPP is a service concession arrangement can be complex. A significant amount of judgement is required to evaluate the terms of the arrangements to determine who controls the asset.
The $5.4 billion Cross River Rail project for the construction of tunnels, stations and development works packages is a recent example of a PPP in the transport sector. While the project will be delivered in partnership with the private sector, the control of the service concession asset rests with Cross River Rail Delivery Authority. As a result, the arrangement did not fall within the scope of the standard and the project continues to be recognised as a construction contract by the Cross River Rail Delivery Authority.
Internal controls
We assess whether the systems and processes (internal controls) that entities use to prepare financial statements are reliable. We report any deficiencies in the design or operation of those internal controls to management for their action. The deficiencies are rated as either significant deficiencies (those of higher risk that require immediate action by management) or deficiencies (those of lower risk that can be corrected over time).
Overall, to the extent that we tested them, we found that the internal controls transport entities have in place to ensure reliable financial reporting are generally effective but can be improved.
Management is working to resolve the deficiencies identified in 2018–19.
Identified internal control matters
In 2018–19, we reported one significant deficiency, 13 deficiencies in internal controls and 17 improvement opportunities across the sector. The significant deficiency involved a fraud that resulted from changes to an employee’s bank account details. The other deficiencies relate to other business processes.
Significant deficiency—employee information security
There was a payroll fraud at North Queensland Bulk Ports Limited resulting from a phishing (fraudulent) email. The email requested a change to bank account details that was subsequently processed and a payment was made to an unauthorised bank account. Management has strengthened processes for monitoring payroll transactions and reporting, including approvals for employee information changes. Staff have undertaken additional cyber security awareness and training.
Actions for transport entities
Entities must verify changes to employee and supplier bank account details through sources independent of the change request.
Entities need to secure information systems to prevent unauthorised access that may result in fraud or error. Security measures could include:
- encryption of information
- restriction of user access
- regular monitoring by management
- appropriate segregation of duties.
We encourage entities to explore cost‑effective technology solutions to monitor real-time information on internal controls and key financial processes. This will enable stakeholders (such as management and those charged with governance) to:
- identify exceptions that need to be managed
- have ongoing oversight across different control activities
- make timely decisions to address important issues or risks.
Control deficiencies and improvement suggestions
We reported a total of 30 deficiencies and improvement opportunities to those charged with governance. Figure 2E presents the areas in which we identified deficiencies and improvement opportunities, and the implications for the entities.
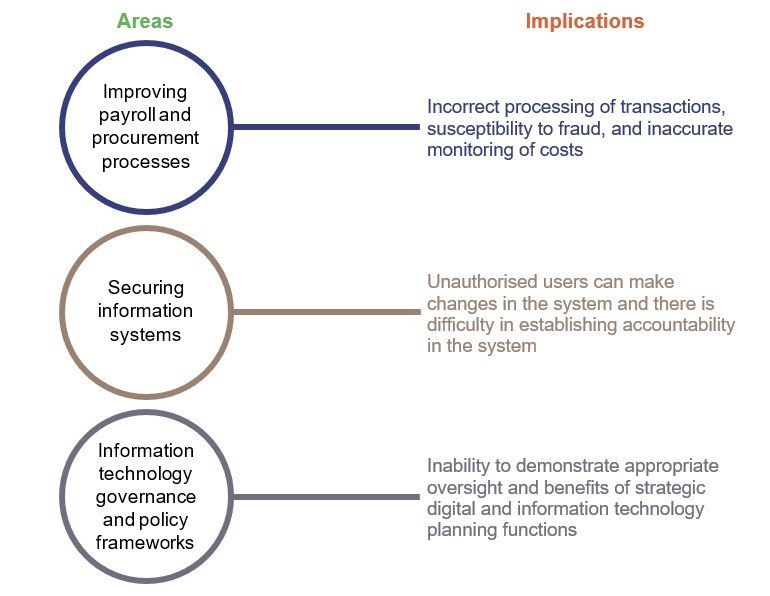
Compiled by Queensland Audit Office.
Management is working to resolve the control deficiencies and is considering the benefits of the business improvement suggestions.
3. Financial performance of transport sector entities
This chapter analyses the financial position, performance, and sustainability of the seven transport entities.
Chapter snapshot
Chapter summary
The Department of Transport and Main Roads collected more fare revenue this year through increased fares and patronage of transport services.
The port entities also experienced strong performance during 2018–19. They reported $97 million in dividend returns to their shareholding minister.
The sector faced natural disaster recovery challenges due to adverse weather events. Strong cooperation across the agencies has reopened important infrastructure in the state.
Transport entities continue to invest in large-scale infrastructure projects. The successful delivery of a connected transport network will continue to require strong governance arrangements and a high level of integration across the respective transport agencies and private sector partners.
Understanding financial performance
Operating ratio
The operating ratio is the operating result before tax (revenue less expenses) expressed as a percentage of total revenue. It measures the extent to which revenue covers operational expenses.
Operating ratios should be positive over the medium to long term if an entity is to remain financially sustainable. A negative or low ratio indicates that an entity needs to ensure enough revenue is generated to fund future operating and capital commitments.
Five of the seven transport entities achieved operating profits in 2018–19.
This year, Ports North reported an operating deficit. This was mostly due to a $29.96 million decrease in property, plant and equipment values reflecting the impact of future capital expenditure on the Cairns Shipping Development Project to improve access for larger ships.
The Department of Transport and Main Roads recorded an operating deficit of $28 million. Total income increased by $138 million to $6.144 billion, mostly due to higher revenue from appropriations to provide funding for bus driver wages and new generation bus contracts for South East Queensland.
Expenses increased by $373 million to $6.173 billion, due to increased payments for rail operator services and non-capital works relating to the construction of a Toowoomba Second Range Crossing project.
Keeping Queenslanders moving
Rising demand for public transport
Demand for public transport services continues to rise in Queensland. Higher population and rising patronage drive this growth. This year, the Gold Coast Light Rail Stage 2 was also in operation for the full year, which led to higher rail patronage. Buses and rail continue to be the most used modes of transport.
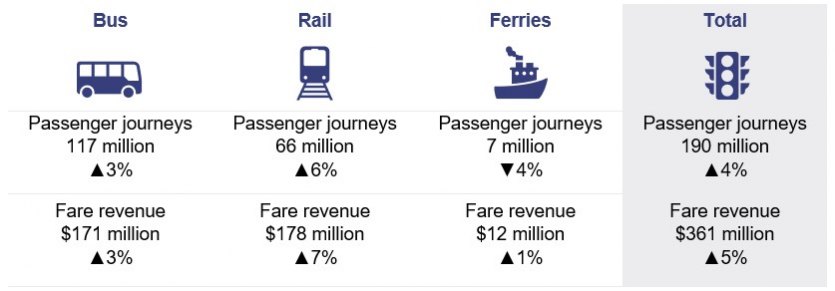
Compiled by Queensland Audit Office from the Department of Transport and Main Roads passenger reports.
The Department of Transport and Main Roads collects fare revenue through its TransLink division. Total revenue collected increased mostly due to higher patronage and in part due to the annual increase in fares based on the Brisbane Consumer Price Index of 1.8 per cent.
TransLink is also responsible for improving the customer experience. The continuing rise in patronage can increase pressure in meeting customer needs, but in fact, customer complaints are reducing. This year, TransLink received 2.17 complaints per 10,000 trips, which is within the service standard target of three complaints per 10,000 trips.
Transport service contracts—continuing and expanding
The public transport system is supported by partnerships with government owned corporations, local governments, and private enterprise.
This year, the transport service contract between the Department of Transport and Main Roads and Queensland Rail increased by $132 million (eight per cent) to $1.778 billion. Under this contract, Queensland Rail receives periodic payments for the delivery of train services, maintenance of infrastructure, and improvements to the safety, capacity, and efficiency of the network.
Expenses for buses, ferries, and other transport services increased by $16 million (two per cent) to $845 million. The department extended and executed several new generation bus contracts in south east and regional Queensland. These extensions enable the continuation of vital bus services across Queensland.
The road forward
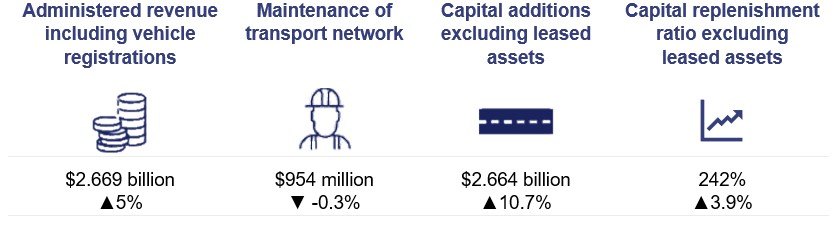
The State of Queensland owns and maintains approximately 33,369 kilometres of major roads, regional roads, and district roads. The number of motor vehicle registrations increased by 1.9 per cent to 5.37 million.
The Department of Transport and Main Roads administers resources and activities on behalf of the State of Queensland. The activities include the collection of vehicle registrations, fines, penalties, and other transport-related fees and charges.
Compiled by Queensland Audit Office.
The demand on road infrastructure is growing. The capital replenishment ratio shows that for every $1 of depreciation, the Department of Transport and Main Roads is investing $2.42 to upgrade or expand the state-controlled road network and associated assets.
Maintenance on the transport network includes costs associated with the bus, light rail, cycling and marine infrastructure. Since 2015–16, the annual spending on maintenance has significantly increased from $646 million to $954 million to improve road safety, freight productivity and whole-of-life cost.
The capital replenishment ratio is a measure of investing sustainability. This ratio compares the purchases of property, plant and equipment to annual depreciation expense.
A ratio of greater than 100 per cent may suggest an expanding asset base. This means assets are being added, replaced or renewed at a greater rate than they are being depreciated. A ratio of less than 100 per cent may indicate that the size or condition of the overall asset base is diminishing.
Each year, the Queensland Transport and Roads Investment Program is updated to detail the transport and road infrastructure projects to be delivered over the next four years. Approximately $23 billion of investment is planned up to 30 June 2023. As well as road infrastructure, the plan includes projects for railways, bus infrastructure, cycleways, and maritime and other transport-related infrastructure.
Major road network projects in 2019–20 include upgrades to the Bruce Highway from Brisbane to Gympie, Ayr to Townsville, and Innisfail to Cairns. The Pacific Highway and Warrego Highway will also receive upgrades at various locations.
The upcoming infrastructure program focuses on building and maintaining regional infrastructure, reducing congestion, and building a network that will meet future demands.
Natural disaster recovery—Mount Isa Line, transport, and freight networks
The Mount Isa rail line is a 1,032 km system. It starts 10 km south of Townsville and heads west out to Mount Isa, servicing several communities along the line through passenger transport and the conveyance of general freight and minerals.
On 25 January 2019, severe storms impacted parts of north and far north Queensland. In a 13‑day period up until 8 February, Townsville recorded approximately 1,400 mm of rain.
Figure 3D below shows the timeline for the natural disaster recovery and the effects the closure of the Mount Isa Line had on user charges revenue collected at the Port of Townsville.
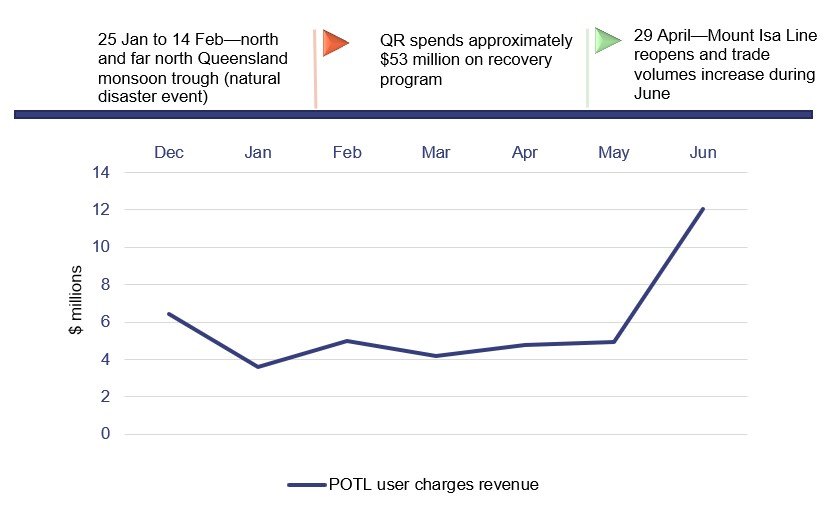
Note: POTL—Port of Townsville Limited; QR—Queensland Rail.
Compiled by Queensland Audit Office.
The floods significantly damaged the Mount Isa rail line, and multiple sections were washed away. This resulted in lower user charges revenue collected by the Port of Townsville over the period the track was closed. The line was reopened in June, with Queensland Rail facilitating extra runs to assist with moving additional product delayed by the extended closure.
The recovery effort led by Queensland Rail was fast-tracked with the cooperation of the Department of Transport and Main Roads and the Department of Housing and Public Works. The 12-week recovery operation is a good example of commitment to disaster recovery and of how effective planning and cooperation can reconnect the state and reopen areas for business.
The unprecedented disaster events in the state this year also affected the wider road network. With more than one-third of the state road network impacted, the Department of Transport and Main Roads spent $33 million on rectification works to reconnect disaster affected communities.
Supporting the regional economy
Increasing port trade
Government owned port corporations play an important role in growing our economy in Queensland. They connect our people and towns and support regional industries in the trade of minerals, agriculture, and other exports. These corporations are responsible for managing 19 of the 21 ports along the Queensland coastline.
| Metrics | GPC | NQBP | POTL | Ports North | |
|---|---|---|---|---|---|
| Import and export throughput | Tonne (millions) | 124.8 ▲3.8% |
177.5 ▼-5.4% |
7.7 ▲4.6% |
7.2 ▲41.1% |
| Volume activity | Vessels to port | 1,941 ▲1.6% |
2,235 ▲2.2% |
624 ▲1.8% |
2,572 ▲48.2% |
| Key trade commodities | Coal, LNG, bauxite, alumina, caustic soda, cement and petroleum | Coal, bauxite, petroleum and sugar | Sugar, petroleum, fertiliser, zinc, general cargo, copper, molasses and cement | Silica sand, sugar, general cargo, petroleum, bauxite, molasses and magnetite | |
| Employment | Full-time equivalent | 719 ▼-1.1% |
126 ▲4.1% |
143 ▲11.0% |
70 ▼-2.8% |
| Income | Vessel income (millions) | $435 ▲7.3% |
$95 ▲14.6% |
$63 ▲2.7% |
$45 ▼-7.9% |
| Total income (millions) | $476 ▼-1.5% |
$133 ▲18.3% |
$80 ▲4.0% |
$62 ▼-17.1% |
|
| Major budgeted infrastructure investment | Capital additions this year (in millions) | $64 ▲72.8% |
$9 ▲5.8% |
$19 ▲4.7% |
$32 ▲2,215.5% |
| 2020 capital budget (in millions) | $116 | $21 | $124 | $76 | |
Notes: GPC—Gladstone Ports Corporation; NQBP—North Queensland Bulk Ports; POTL—Port of Townsville Limited; Ports North—Far North Queensland Ports Corporation; LNG—Liquefied natural gas.
Compiled by Queensland Audit Office from the transport sector annual reports and The State of Queensland (Queensland Treasury) - 2019–20 Queensland Budget.
The ports generate income from various facilities and infrastructure services. The vessel income earned is dependent on the number of vessel movements, size of the vessels, the time they spend at the port, services provided, and weight of the goods loaded or unloaded from the vessel.
The ports performed strongly during 2018–19. North Queensland Bulk Ports and Port of Townsville both recorded stronger vessel income.
Vessel income for Gladstone Ports Corporation grew by seven per cent to $435 million due to increased exports in coal and liquefied natural gas. Total income decreased to $476 million due to lower recoverable works and fair value gains on property, plant and equipment recorded as income.
The trade volumes at Ports North were higher for sugar exports and petroleum imports. This was offset by lower cargo volumes, which led to a decline in vessel income. Total income at Ports North also declined due to lower fair value gains on investment properties and gains on property, plant and equipment recorded as income.
Major investments are being made to increase the capacity of the port sector across Queensland. This investment aims to meet increasing demand in the future, cater for changes in shipping vessels, and facilitate the growth of the broader regional economy. The size and timing of the funding provided can have an impact on the returns to government from port entities.
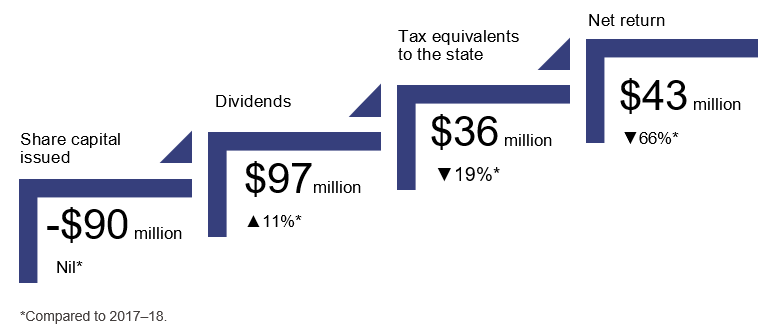
Returns to government from port entities
The port entities provide critical infrastructure and services to the state. They also provide returns to the Queensland Government through dividends and tax equivalents.
Dividends are a portion of a statutory body’s or government owned corporation’s profits that it pays to its shareholders.
Tax equivalents are paid by government owned corporations to the state government to ensure competitive neutrality with other business in the industry.
Competitive neutrality is the policy that a public sector business, or agency, should not have a competitive advantage (or disadvantage) over the private sector solely due to their government ownership.
Notes: Port entities include Gladstone Ports Corporation Limited (GPC), North Queensland Bulk Ports Limited (NQBP), Port of Townsville Limited (POTL), and Far North Queensland Ports Corporation Limited (Ports North).
Compiled by Queensland Audit Office from transport entities’ financial statements.
The Queensland Government provided $90 million in funding for infrastructure through the issue of share capital for the Port of Townsville and Ports North (nil in 2017–18).
Net returns can be temporarily impacted by the timing of cash inflows and outflows arising from major capital expenditure. This can occur on major project investments such as dredging works.
Ports North had an operating loss, mostly driven by a $29.96 million decrease in the valuation of property, plant and equipment that impacted profit, and was not required to pay a dividend.
Despite these factors, the port entities’ net return to the state from dividends and tax equivalents was $43 million.
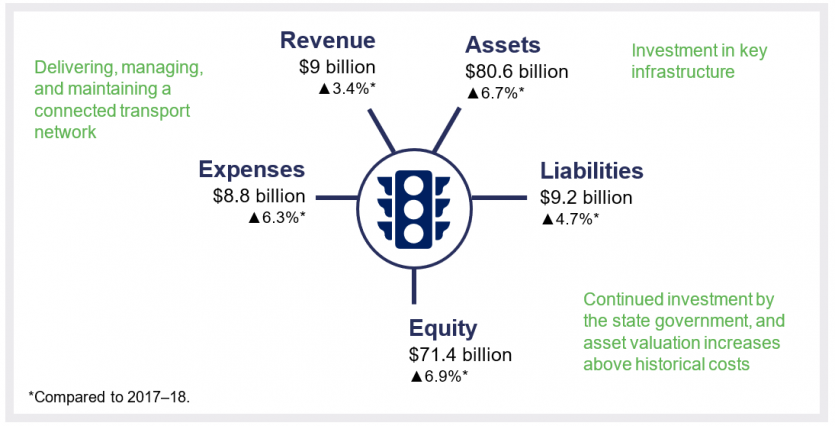
Understanding financial position
In 2018–19, total assets and liabilities increased by $5 billion (6.2 per cent) and $410 million (4.4 per cent) respectively.
The main drivers in total assets and liabilities during the year were the following movements at the Department of Transport and Main Roads:
- capital additions of $4.2 billion towards infrastructure assets due to new road asset additions, such as upgrades to the Bruce and Warrego Highways and the opening of the Toowoomba Second Range Crossing
- transferred assets of $481.3 million associated with the Moreton Bay Rail Link to Queensland Rail as part of its continued provision of CityTrain and City Network Services
- increase of $452 million in lease liabilities to fund the addition of 35 New Generation Rollingstock train sets and the opening of the Toowoomba Second Range Crossing
- transferred borrowings of $632.2 million to Queensland Treasury as part of the wider state government fiscal strategy and borrowing program.
Other factors impacting on total assets and liabilities across the transport entities were capital additions of $560 million towards rail infrastructure assets and station upgrades, and new borrowings of $46 million at Queensland Rail.
Future challenges and emerging risks
Delivering major transport infrastructure
Several transport projects are under development to address South East Queensland’s rising population and the resultant pressure on the transport network. One of the key projects being undertaken is the Cross River Rail project.
This project includes 10.2 km of new rail line, including 5.9 km under the Brisbane River and Brisbane central business district (CBD). The project will deliver four new underground stations, upgrades to existing stations, and other rail network enhancements to improve the frequency of train services in the CBD.
The project will be funded through a combination of state contributions ($5.409 billion) and private finance contributions ($1.479 billion).
The delivery of the complex construction works will be managed by multiple agencies (Cross River Rail Delivery Authority (CRRDA), Department of Transport and Main Roads (DTMR), and Queensland Rail) in partnership with the private sector.
The project has started early works and procurement activities. The construction works involve significant integration between major contracts for design, construction, civil engineering, signalling, and mechanical and electrical works.
The preferred consortia for the three major contracts were announced in April 2019. The three major infrastructure packages of work include:
- the Tunnel, Stations and Development (TSD) public–private partnership (PPP)
- the Rail, Integration and Systems (RIS) alliance
- the European Train Control System (ETCS) contract.
The TSD is the largest work package. The TSD PPP will incorporate a concessionary period of five years of construction services, followed by 25 years of final acceptance and maintenance services. The tunnel work is planned to commence in 2019–20.
Public–private partnerships (PPPs) are cooperative agreements generally entered into with private sector entities for the delivery of government services.
Concessionary periods are specified periods a service will be provided by the private sector.
The use of PPPs can provide benefits to the public sector, such as access to specialist expertise and innovation. These arrangements can also bring risks, such as diminished central oversight and coordination, particularly if government agencies and external partners are responsible for shared outcomes.
The size and complexity of the project requires continued governance and oversight to ensure the project is delivered on time and on budget, and complies with all safety and other relevant standards and regulations.
Action for transport entities
Good governance is critical to any organisation or project. It ensures it efficiently achieves its objectives and manages risk. It also helps ensure accountability and effective decision-making. Strong governance is particularly critical in order to ensure large-scale infrastructure projects that involve multiple agencies are effectively managed in terms of time, budget, quality, and scope.
We encourage entities to continue to assess their governance frameworks to ensure:
- risk assessments align across all agencies and external partners to reduce risk management gaps, misalignment of assumed risk owners, overlapping responsibilities, or inappropriate management of risks
- robust coordination mechanisms are in place across all levels of government and external project partners to ensure roles and responsibilities are clear
- enough resources have been allocated to manage the number and complexity of how agencies and external partners communicate and work together
- performance monitoring systems are suitably designed to identify and report issues relating to timeliness, cost, quality, and scope during the project delivery.
As infrastructure programs develop, consideration should be given to lessons learned from other past projects, to better inform the planning and execution of current and future programs.
Lessons learned from other major infrastructure projects
The scope, scale and complexity of major infrastructure projects can make for significant challenges in the public sector. The wider learnings from the delivery of other major infrastructure projects both locally and internationally highlight recommendations in governance arrangements, cost monitoring and project timeframes.
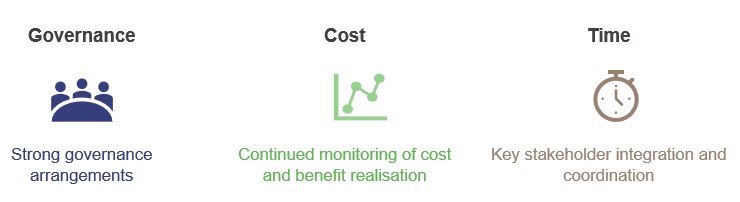
Compiled by Queensland Audit Office.
To ensure the delivery of projects is well managed, governance arrangements need to be responsive to risks and flexible to changing work programs. This includes formalising governance arrangements for the transition from construction to operational phases. Central agencies can also enhance governance arrangements by providing useful advice on the costs and benefits of all strategic project options throughout the infrastructure life cycle.
Unexpected cost increases have been a challenge on projects and have placed pressure on budgets and wider project contingency funds. To make effective decisions and manage budgets effectively, cost estimates should be updated to reflect the latest data and assumptions. This includes resetting costs for changes in the project timetable or scope of works.
Major infrastructure projects have complex program schedules where a body of work is dependent on the successful completion of other work programs. These programs might be undertaken by several independent contractors. To better manage multiple work programs and to minimise costs from delays, formal contractual integration and coordination between contractors should be implemented and monitored to track progress.
Time pressures and fixed completion dates can have a significant impact on costs. This can also lead to compressed timeframes and impact project delivery outcomes.
The successful delivery of major infrastructure should be measured against the parameters of time, cost and quality. These success factors are interrelated, and all need to be managed effectively during the project life cycle to ensure the best possible outcomes are achieved.