Overview
State and local government owned water entities provide water throughout Queensland, to households, agriculture, mining, electricity generation, tourism, and manufacturing industries. Tabled 24 October 2019.

Report on a page
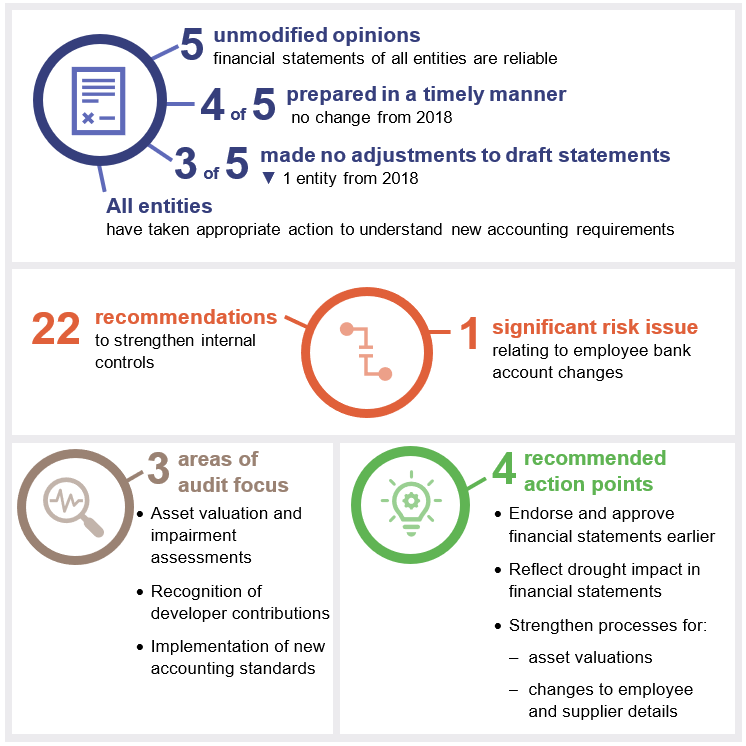
This report includes the results of our financial audits of five water entities: Seqwater, Sunwater, Queensland Urban Utilities, Unitywater, and Mount Isa Water Board.
Their financial reports are reliable and comply with relevant laws and standards. The financial statements were prepared in a timely manner and were of good quality.
A sixth water entity, Gladstone Area Water Board, did not meet its legislative timeframe as they did not have directors in place at the time the financial statements were due to be signed.
Internal controls are generally effective
Controls and processes are in place to enable entities to prepare reliable financial statements. We made 22 recommendations to support further improvement in controls and processes. Areas for improvement include strengthening controls on information systems, and reporting revenue and assets received from developers on a timelier basis.
Targeted fraud attempts continue across all public sector entities. There was a successful fraud in a water entity where employee bank account details were changed as a result of phishing. Management has now strengthened controls over changes to employee bank accounts.
The sector is continuing its efforts to ensure asset valuations are accurate and timely, and we encourage these processes to continue.
Financial results are steady
The overall sustainability of the entities remains stable. There is regulation and oversight to ensure entities can charge their customers appropriate prices to earn sufficient revenue over time to meet their costs. Seqwater’s financial performance continues to improve as urban bulk water prices continue to move closer to cost recovery levels.
Continuing drought conditions and asset improvement programs that involve significant infrastructure investment may impact on the sustainability and funding of the entities in the longer term.
Infrastructure challenges
Sustainable water supply continues to be a challenge for the sector, with the majority of Queensland in drought—particularly in south west Queensland.
Extreme weather conditions increase the need to prioritise water security projects, which will require investment in the near future by the state and the water entities.
Seqwater’s drought response includes the possible use of Western Corridor Recycled Water Scheme and Gold Coast Desalination Plant when specific drought triggers are reached. There will be additional costs to use those assets and this may impact Seqwater's financial sustainability.
Sunwater’s dam improvement program is likely to impact its financial performance, cash flows and returns to the state government.
Actions for entities
Reflect drought impact in financial statements
We encourage all entities to assess the impact of extreme weather events on the measurement of their transactions and balances and their financial statement disclosures. This should help a reader to understand the importance of drought events to water entities, and the impact on their financial position and performance.
Secure employee and supplier information
Entities must verify changes to employee and supplier bank account details through sources independent of the change request.
Entities need to secure information systems to prevent unauthorised access that may result in fraud or error. Security measures could include encryption of information, restriction of user access, regular monitoring by management, and appropriate segregation of duties.
We encourage entities to explore a controls monitoring solution to bring in real-time data on key financial processes. This will enable stakeholders (such as management, or those charged with governance) to identify exceptions that need to be managed, have ongoing oversight across several different control activities and make real-time decisions to address important issues or risks.
Deliver timely asset valuations
We recommend entities continue ensuring sufficient resources are allocated to complete and deliver asset valuation models, and that assumptions underlying asset valuations are appropriately supported.
Endorse and approve financial statements earlier
We continue to encourage water entities to bring forward audit committee endorsement and board approval of financial statements. This will assist in ensuring potential issues are effectively resolved between year end and signing date.
1. Entities in the water sector
Notes: GAWB—Gladstone Area Water Board; MIWB—Mount Isa Water Board; QUU—Queensland Urban Utilities; and QCA—Queensland Competition Authority.
Compiled by the Queensland Audit Office.
2. Results of our audits
This chapter delivers an overview of our audit opinions for each entity in the water sector and evaluates the timeliness and quality of their financial reporting. It also provides conclusions on our areas of audit focus.
Chapter snapshot
Chapter summary
As with last year, we focused on how water entities use complex models to measure their assets. We also assessed the adoption of the new revenue and lease standards, which came into effect on 1 July 2018 and 1 July 2019 respectively.
We have made 22 recommendations to address deficiencies and business improvement opportunities.
All five water entities received unmodified opinions in 2018–19, meaning their financial statements present a true and fair view of the entities’ financial position and performance. Gladstone Area Water Board is yet to be certified.
Audit opinion results
We issued unmodified audit opinions for the five entities we audited. Readers can rely on the results in the audited financial statements.
We express an unmodified opinion when the financial statements are prepared in accordance with the relevant legislative requirements and Australian accounting standards.
Gladstone Area Water Board was granted an extension to its legislative timeframe for finalising its audited financial statements. Three new directors (including a new chair) were appointed on 22 August 2019 before the planned approval of the financial statements. An extension was granted on 10 September 2019 by the Minister for Natural Resources, Mines and Energy, which provided for the annual report (including the financial statements) to be lodged by 30 November 2019. Management is working towards a 30 November 2019 certification date.
The audit opinions we issued are provided in Appendix C.
Action for water entities
We continue to encourage water entities to bring forward audit committee endorsement and board approval of financial statements. This will assist in ensuring potential issues are effectively resolved between year end and signing date.
Entities not preparing financial statements
Not all Queensland public sector water entities produce financial statements. The full list of entities not preparing financial statements and the reasons are provided in Appendix D.
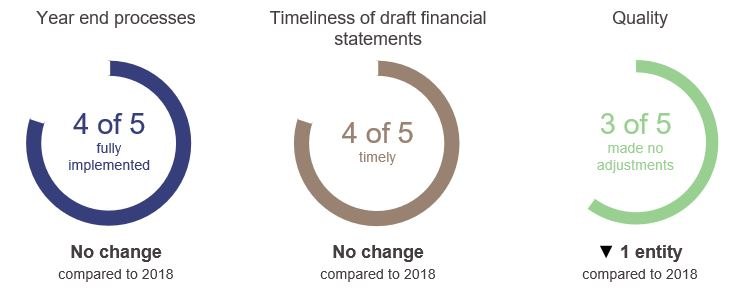
Effectiveness of financial statement preparation
Water entities implemented year end processes that resulted in the timely delivery of draft financial statements. The financial statements were of good quality, but two entities made immaterial changes in 2018–19.
Figure 2A summarises our assessment of water entities’ financial statement preparation processes. Our assessment of year end processes, timeliness, and quality is provided in Appendix E.
Financial reporting maturity model
We are developing a new reporting tool for assessing financial statement preparation—the financial reporting maturity model. This model will allow for an assessment of public sector entities’ processes for preparing financial reports, which can be adapted for entities of different sizes and circumstances.
We will include a self-assessment tool to help entities evaluate themselves against their expected maturity level and highlight improvement areas.
Areas of audit focus
We focus on areas with a higher risk of fraud or error in the financial statements. Risk increases when there is a higher degree of complexity or subjectivity, or when there are significant changes or developments. In the water sector, these areas of focus were:
- asset valuation and impairment assessments
- recognition of developer contributions (cash payments and/or donated assets)
- implementation of new accounting standards.
Asset valuation and impairment assessments
All entities use complex models to estimate the value of their assets. These models are based on assumptions and can be subjective.
Property, plant and equipment subject to revaluation or impairment make up 93.9 per cent of total assets.
We concluded that readers can rely on the value of property, plant and equipment reported in each entities’ financial statements. We assessed the:
- adequacy of management’s annual review of the valuation process
- appropriateness of the valuation methodology applied
- competence, capability, and objectivity of the experts used
- assumptions used in the process.
Action for water entities
Since 2016–17, the sector has improved its completion and delivery of these models. Seqwater continues to lead the sector in the early completion of asset valuations.
We recommend entities continue to ensure:
- sufficient resources are allocated to complete and deliver asset valuation models
- assumptions underlying asset valuations are appropriately supported.
Recognition of developer contributions
Distributor-retailers (Unitywater and Queensland Urban Utilities) receive donated assets (water infrastructure, such as pipes) and cash contributions from developers. Cash contributions are referred to as infrastructure charges and are applied to fund the cost of providing new or upgraded trunk infrastructure. Developer contributions make up 10 per cent of the water sector’s total revenue. These increase the capacity of the water and sewerage networks needed to support new developments. When a developer provides an asset, it is recorded as revenue and as a donated asset.
The value of donated assets is based on their physical length and corresponding unit rates. These are recognised when a connection certificate is issued for completed works that are compliant with laws and regulations. Revenue recognition is affected when developers are late in submitting engineer-certified drawings or when the values are inaccurate. As a result, the assets and revenue may be recorded in the incorrect period or not at all.
We concluded that readers of the financial statements can rely on the reporting of donated assets by each distributor-retailer. We assessed the:
- accuracy of physical lengths and unit rates of donated assets
- completeness and timely capitalisation (adding an asset to the balance sheet) of the donated assets that were recognised.
Implementation of new accounting standards
AASB 16 Leases
This accounting standard will introduce a single lease accounting model in 2019–20. The estimated increase in assets and corresponding liabilities for the sector is $56.5 million. The outcome of adopting this standard will be known in 2019–20.
AASB 15 Revenue from Contracts with Customers
At adoption date (1 July 2018), the effect of this accounting standard on the sector was limited to the recognition of donated assets and irrigation revenue.
Distributor-retailers previously recognised donated assets when they become liable for the assets’ ongoing maintenance. AASB 15 requires donated assets (and the associated revenue) to be recognised when connection certificates are issued to the developer.
In the past, irrigation revenue was deferred to match related repairs and maintenance expenditure. The standard now requires revenue to be recognised when the customer receives and benefits from the supply, transportation, or allocation of water.
The entities’ combined post-tax increases to retained earnings relating to donated assets and irrigation revenue was $14.4 million and $12.2 million, respectively.
We concluded that readers of the financial statements can rely on the entities’ preliminary assessment of AASB 16 and the implementation of AASB 15. We reviewed the:
- accuracy and completeness of entities’ lease assessments
- entities’ assessment and implementation on significant revenue streams.
Internal controls
We assessed whether the systems and processes (internal controls) that entities use to prepare financial statements are reliable. We report any deficiencies in the design or operation of those internal controls to management for action. The deficiencies are rated as either significant deficiencies (those of higher risk that require immediate action by management) or deficiencies (those of lower risk that can be corrected over time).
Overall, to the extent that we tested them, we found the internal controls water entities have in place to ensure reliable financial reporting are generally effective but can be improved.
Management is working to resolve the deficiencies identified in 2018–19.
Identified internal control matters
In 2018–19, we reported one significant deficiency, 12 deficiencies in internal controls, and 10 business improvement opportunities across the sector. The significant deficiency involved a fraud that resulted from a change to an employee’s bank account details. The other deficiencies relate to other business processes.
Significant deficiency—employee information security
There was a payroll fraud at Queensland Urban Utilities resulting from a phishing email from a source posing as an employee. The email requested changes to bank account details. The details were subsequently processed and a payment was made to an unauthorised bank account. Management has strengthened processes for monitoring payroll transactions and reporting, including approvals for employee information changes.
Action for water entities
Entities must verify changes to employee and supplier bank account details through sources independent of the change request.
Entities need to secure information systems to prevent unauthorised access that may result in fraud or error. Security measures could include:
- encryption of information
- restriction of user access
- regular monitoring by management
- appropriate segregation of duties.
We encourage entities to explore a controls monitoring solution to bring in real-time data on key financial processes. This will enable stakeholders (such as management, or those charged with governance) to:
- identify exceptions that need to be managed
- have ongoing oversight across several different control activities
- make real-time decisions to address important issues or risks.
Control deficiencies and improvement suggestions
We reported a total of 22 deficiencies and improvement opportunities to those charged with governance. Figure 2B presents the underlying areas in which the deficiencies and improvement opportunities were identified, and the implications for the entities.
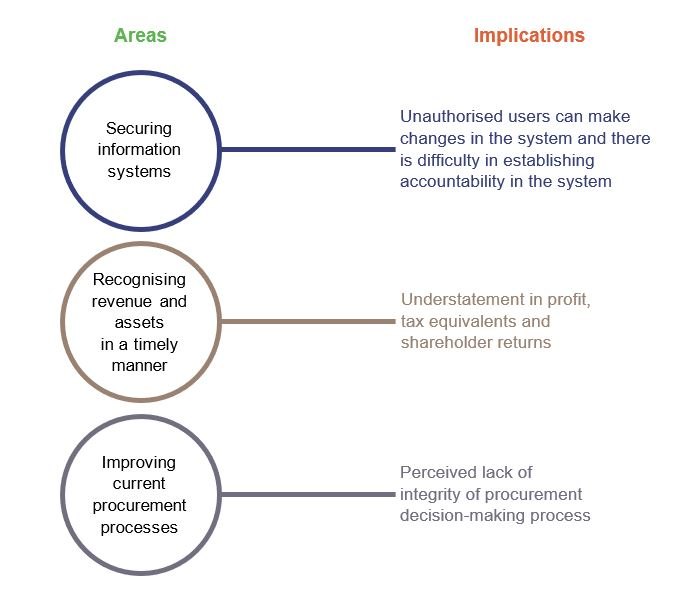
Compiled by Queensland Audit Office.
Management is working to resolve the control deficiencies and is considering the benefits of our business improvement suggestions.
3. Financial performance of water entities
This chapter analyses the financial results and future sustainability of the five water entities.
Chapter snapshot
Compiled by Queensland Audit Office from water entities’ financial statements.
Chapter summary
Current water infrastructure projects are primarily located in north Queensland and along the east coast, including the Rookwood Weir and Haughton Pipeline Duplication Projects. The Granite Belt Irrigation Project aims at expanding irrigation for agricultural and horticultural industries in the Southern Downs.
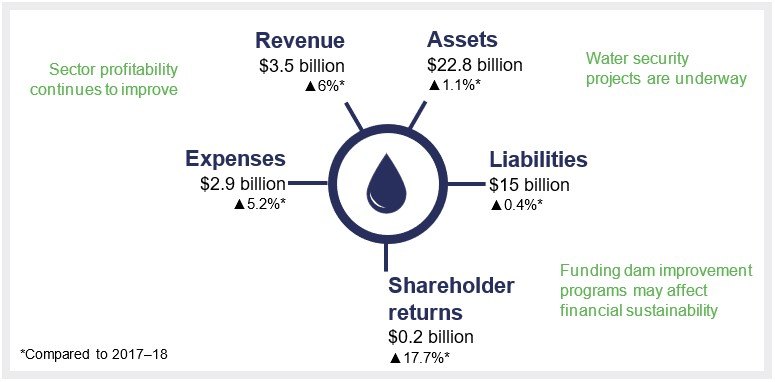
In 2018–19, the combined shareholder returns of entities increased. Seqwater continues to make an operating loss, attributed to the historical under-recovery of the cost of providing bulk water services, and interest expense associated with loans incurred from the merger with other bulk water entities and investments into drought resilient infrastructure.
Sunwater’s upcoming expenditure for its large dam improvement program is likely to impact its financial performance, cash flows and returns to state government.
While still profitable, Queensland Urban Utilities’ (QUU) developer contributions are declining, reflecting the impact of the cooling of the Brisbane region’s property market.
Understanding financial performance
Operating ratio
The operating ratio is the operating result before tax (revenue less expenses), expressed as a percentage of total revenue. It shows the capacity to meet operating expenses from operating revenue, with a positive ratio indicating that funds are also available for capital expenditure and shareholder returns.
Operating ratios should be positive over the medium to long term if an entity is to remain financially sustainable. A negative or low ratio indicates that an entity needs to ensure enough revenue is generated to fund future operating and capital commitments.
Four of the five water entities achieved operating profits in 2018–19.
QUU’s profit declined due to decreased developer contributions, which are outside of its control. MIWB’s profit fluctuated due to an increase in water consumption and by asset values not being written down as much as they were in the previous year (comprehensive asset revaluation in 2017–18). Sunwater’s profit increased due to higher operational revenue and lower employee costs.
Seqwater continues to make an operating loss, largely reflecting its historical under-recovery of the cost of delivering bulk water services as a result of the price path policy. The price path policy is the phasing in over time of the recovery of the investment in the South East Queensland Water Grid in response to the Millennium Drought. However, its operating result improved in 2018–19 due to urban bulk water prices moving closer to cost recovery levels, with all customers expected to reach the common price in 2020–21.
Pricing for South East Queensland
In 2008, the state government established the South East Queensland (SEQ) bulk water price path, with the objective of all SEQ council areas reaching a common bulk water price. The price path operates by setting a common price that reflects the cost of supplying water, and slowly transitioning all customers to the common price. In 2018–19, eight out of the 11 SEQ council areas paid the common price. All SEQ councils will pay the common price from 2020–21.
In 2017–18, the state government implemented the Queensland Competition Authority’s (QCA) price recommendation, which continues to ‘smooth’ price increases for all SEQ council areas. QCA recommends prices to recover the price path debt, being the accumulated previous under‑recoveries of the cost of water, providing Seqwater with revenue to repay the water grid manager debt by 2028.
Irrigation pricing outside South East Queensland
Sunwater’s water irrigation (supplied to agricultural growers throughout regional Queensland) represents 19.7 per cent (21 per cent in 2017–18) of total revenue from operations. Figure 3B shows the extreme weather conditions that have occurred since Sunwater’s current irrigation price path began on 1 July 2012 (extended to 30 June 2020).
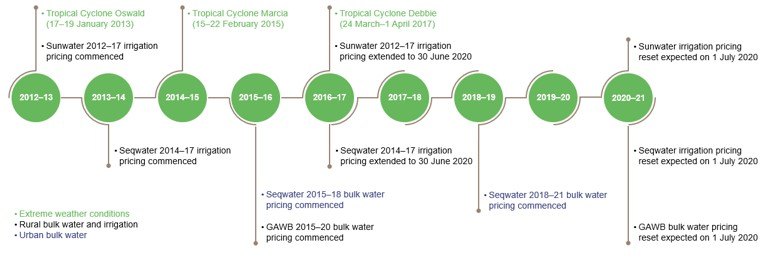
Notes: GAWB—Gladstone Area Water Board, which was not audited.
Queensland Audit Office from Queensland Competition Authority.
Costs in irrigation schemes vary due to electricity usage, operational costs, and future capital expenditure. Sunwater recovers these costs through the prices it charges irrigation customers and through a government subsidy–community service obligation (that is, government payments to entities to provide services that do not fully recover costs). The prices charged to irrigation customers are set by the state government, after having considered recommendations from the QCA.
Sunwater’s community service obligation for irrigation decreased by 31.3 per cent and 14.9 per cent in 2018–19 and 2017–18, respectively, due to prices moving closer to cost recovery and schemes transferring to Local Management Arrangements.
In 2019–20, QCA is expected to complete its review of Sunwater’s irrigation price path for 1 July 2020 to 30 June 2024. Current prices are based on the costs from QCA’s 2012 review of irrigation pricing and do not reflect cost increases across a number of areas (electricity, flood repair, insurance, and so on). The occurrence of extreme weather conditions and their impact on operating costs highlight the importance of this review.
Shareholder returns
Shareholder returns refer to either dividends (for a statutory body or government owned corporation) or participation returns (for distributor-retailers).
Dividends are the portion of a statutory body or government owned corporation’s profits that it pays to its shareholders.
Participation returns are the portion of a distributor-retailer’s profits that it pays to its participating local governments in accordance with a participation agreement.
The water sector’s combined shareholder returns have increased as a result of increasing operating profits (Figure 3C).
During 2018–19:
- Total dividends to the state government were $56.1 million (increase of $15.2 million from 2017–18). Dividends as a percentage of profit have remained consistent year-on-year except for 2016–17, when Sunwater kept 100 per cent of its profits to contribute to future dam improvement projects.
- Total participation returns to participating local governments were $188 million (increase of $21.5 million from 2017–18). Participation returns remained stable year-on-year except for 2017–18, when Unitywater made a one-off tax adjustment to align the useful lives of certain asset classes for both accounting and tax purposes, which reduced its profits.
Details on flows to and from government are provided in Appendix G.
Understanding financial position
In 2018–19, total assets and liabilities increased by $241.8 million (1.1 per cent) and $58.6 million (0.4 per cent) respectively. The overall increase in total assets was largely due to the following movements in property, plant and equipment:
- distributor-retailers constructing $376.1 million of infrastructure assets and receiving donated assets of $175.4 million
- bulk water suppliers’ $200 million investment into bulk water infrastructure improvements, refurbishments and construction projects
- offset by depreciation of $558.2 million and impairment of $28.5 million.
Four of the five entities increased their liabilities during 2018–19. For example:
- QUU borrowing $39.4 million to fund short-term liquidity requirements
- Sunwater deferring $29.7 million of revenue for the Rookwood Weir Project.
Future challenges and emerging risks
Business cases have been completed for projects to stimulate regional development, primarily in north Queensland and along the east coast.
Drought-declared areas
The state government has declared drought in 66.1 per cent of the state, after lack of rainfall across central and southern Queensland.
National Water Infrastructure Development Fund
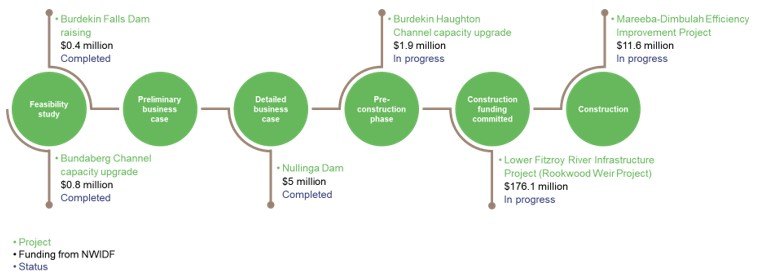
The National Water Infrastructure Development Fund (NWIDF) is intended to accelerate the assessment of water infrastructure proposals that could stimulate regional economic activity through building projects. Through the state government, Queensland entities used $25.5 million to finalise 15 water infrastructure feasibility studies under Part 1 of this scheme in 2018–19.
Figure 3E presents the status of the seven feasibility studies involving Sunwater.
Compiled by Queensland Audit Office from the NWIDF website.
A feasibility study includes a range of detailed technical, environmental, and economic assessments on a specific water infrastructure project site, enabling investment decisions to be made ahead of construction.
A preliminary business case aims to progress the concept documented in the feasibility study by generating options and assessments for a preferred option/s for more detailed analysis.
A detailed business case aims to provide evidence for investing in the projects.
Part 2 of this scheme relates to co-funding the construction of water infrastructure projects. The NWIDF committed funding in June 2018 for Mareeba-Dimbulah Efficiency Improvement Project ($11.6 million). It also committed funding (pending bilateral schedule agreement) of up to $176.1 million for the construction of the Rookwood Weir, on the Fitzroy River, west of Rockhampton.
Most of the project investments approved to date have been in north Queensland and along the east coast. It will be several years before these projects are completed.
Rookwood Weir Project
The Rookwood Weir Project (RWP) is a component of the Lower Fitzroy River Infrastructure Project (which includes upgrades to and construction of roads and bridges and associated infrastructure). The RWP is located 66 kilometres from Rockhampton on the Fitzroy River. It is expected to be capable of supplying 76,000 megalitres (ML) per annum of high priority water for customers.
The Australian Government (through the NWIDF) and the Queensland Government have committed to jointly funding construction of the Rookwood Weir for $352.2 million. Sunwater progressed preparatory works for the RWP in 2018–19, with first construction activities expected to start in the second half of 2019.
At the RWP’s completion, it is expected to support agricultural and industrial development in the area.
Haughton Pipeline Duplication Project
As a result of a monsoon trough in January–February 2019, the Ross River Dam was filled to approximately 245 per cent before water was released. The dam’s level decreased to 79 per cent at 23 September 2019 and continues to decline. Townsville City Council currently imposes water conservation measures on the watering of lawns and gardens.
The Haughton Pipeline Duplication Project was funded by the state government, which provided $225 million to Townsville City Council (which includes $10 million for the Water Smart Package). It is expected to be completed by March 2020. Project completion will allow pumping of additional bulk water from the Burdekin Haughton Water Supply Scheme to the Ross River Dam during periods of very low rainfall. As at 30 June 2019, Sunwater was also in the pre-construction phase of increasing the Haughton Channel’s capacity. These projects are expected to address the anticipated population growth of Townsville in the 2030s and the requirements of industries in the region.
Granite Belt Irrigation Project
Some of Queensland’s important agricultural and horticultural areas are located in the Southern Downs, which continues to experience decreased rainfall.
As at 16 September 2019, water levels for the three dams in the region were:
- Connolly Dam (owned and operated by Southern Downs Regional Council)—33.8 per cent
- Storm King Dam (owned and operated by Southern Downs Regional Council)—20.5 per cent
- Leslie Dam (owned and operated by Sunwater)—six per cent.
In January 2019, the Stanthorpe and Granite Belt Chamber of Commerce completed a feasibility study of the Granite Belt Irrigation Project, funded by the NWIDF. The project’s cost was assessed at $84 million, which includes the construction of the 12,074 ML Emu Swamp Dam, 117 kilometre pipeline, and other costs. It is expected that irrigation water supply in the area will increase by approximately 40 per cent as a result of this project.
The state government’s funding conditions include:
- the proponent, Granite Belt Water, being able to secure access to sufficient water entitlements. This will involve discussions with local stakeholders and securing environmental approvals
- appropriately qualified and expert engineers reviewing and endorsing the design of the dam and distribution network
- the state government having input into the choice of expert reviewers and the design and delivery process
- the proposed owner, Granite Belt Water, providing information about the ongoing viability of the proposal and the business to allow the state government to undertake due diligence assessments
- that if construction contracts cannot be signed for $84 million, the viability of the project will be reconsidered.
This project is aimed at expansion of irrigated agriculture and horticulture in the region.
Maintaining water security in South East Queensland
As at 30 June 2019, SEQ was not yet experiencing the water supply difficulties facing other Queensland regions. However, Seqwater is preparing for the possibility of drought. Its Water Security Program (long-term water plan), includes a plan for drought response with triggers (Figure 3F) for actions when the combined level of the region’s 12 major dams reaches a certain level.
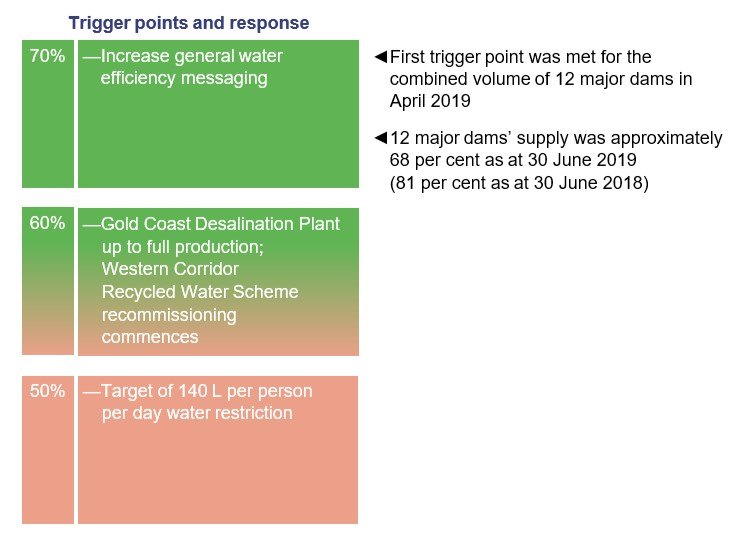
Compiled by Queensland Audit Office from Seqwater’s information.
Seqwater manages and maintains the Gold Coast Desalination Plant (the Desalination Plant) and the Western Corridor Recycled Water Scheme (the Western Corridor Scheme).
Figure 3G details the operating and maintenance costs for these assets.

Notes: *compared to 2017–18. These costs will increase significantly as production ramps up.
Compiled by Queensland Audit Office from Seqwater data.
At full capacity, the Desalination Plant and the Western Corridor Scheme can produce 313 ML per day (133 ML and 180 ML respectively)—approximately a third of Seqwater’s daily water production in 2018–19. The Desalination Plant currently operates in a state of readiness to deliver 100 per cent of its capacity within 72 hours. The Western Corridor Scheme reached a fully decommissioned state in March 2015.
In 2018–19, the Desalination Plant produced 6,535 ML of water (13.5 per cent of its total capacity), representing two per cent of the total water Seqwater supplied. This provided an alternate water source when other parts of the grid were taken offline for maintenance and upgrades. Operating costs increased this year due to increased production. The use of drought resilient water sources, such as the Desalination Plant, will increase if drought conditions occur in South East Queensland.
Figure 3H provides an overview of the Western Corridor Scheme.
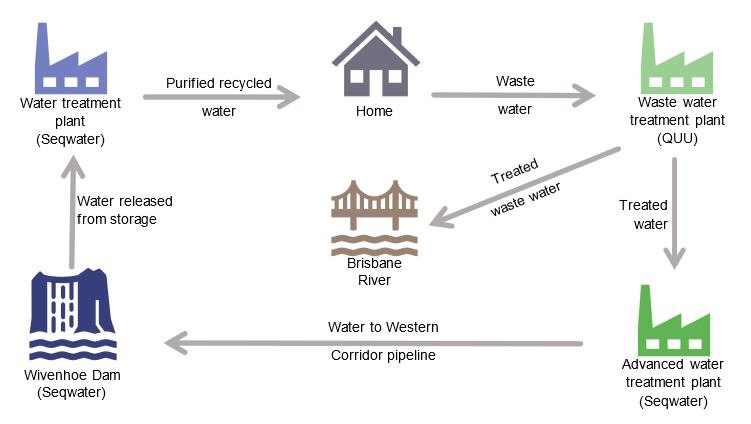
Compiled by Queensland Audit Office from Seqwater information.
The Western Corridor Scheme:
- remained in care and maintenance mode throughout 2018–19
- includes three advanced water treatment plants (Bundamba, Gibson Island and Luggage Point), approximately 220 km of pipelines, and nine pumping stations.
As part of the care and maintenance mode, the Luggage Point Advance Water Treatment Plant remains operational to prepare and gain learnings for the future if the Western Corridor Scheme is fully recommissioned. It produced 1,717 ML in 2018–19 for Seqwater’s industrial customer.
Seqwater included a probability weighting for drought (likelihood of drought occurrence) as an assumption in its asset valuation as at 30 June 2019. It includes consideration of the cost to fund these drought responses, if required, and the potential for price rises.
Action for water entities
We encourage all entities to assess the impact of extreme weather events on the measurement of their transactions and balances, and their financial statement disclosures. This should help a reader to understand of the importance of drought events to water entities, and of the impact on their financial position and performance.
Dam improvements
Each dam owner is responsible for dam improvement in Queensland. Bulk water suppliers must ensure they manage dam safety risks in accordance with the provisions of the Water Supply (Safety and Reliability) Act 2008.
A dam improvement program includes an ongoing series of inspections, engineering assessments, and comprehensive risk assessments for all referable dams, including changes in design standards, hydrologic data and methods, industry best practice, and regulatory requirements.
A dam is a referable dam if a failure impact assessment demonstrates there would be people at risk if the dam were to fail.
Hydrology is the scientific study of the movement, distribution, and quality of water.
Dam improvements are a significant cost to entities and are funded through:
- additional borrowings
- additional funding from the state or federal government
- the current and future water price.
Dam improvement has been a major focus for Sunwater since it began its dam improvement programs in 2005.
These programs are likely to significantly influence Sunwater’s financial performance and net flows to the government over the next decade.
| Project | Status |
|---|---|
| Burdekin Falls Dam | • Detailed business case (led by Building Queensland) begun on 30 June 2019 for Burdekin Falls Dam Spillway and Saddle Dam improvements |
| Fairbairn Dam | • Stage 1—completed December 2016 • Stage 2—in progress, scheduled for completion by early 2021 • Stage 3—in progress, scheduled for completion by late 2020 |
| Leslie Dam | • Preliminary business case in progress at 30 June 2019 |
| Teemburra Dam | • Preliminary business case in progress at 30 June 2019 |
| Paradise Dam | • Primary and Secondary Spillway Improvement business case completed at 30 June 2019 |
Compiled by Queensland Audit Office from Sunwater information.
Developer contributions
Developer contributions come in the form of cash and/or donated assets. Distributor-retailers use developer contributions to expand existing capacity and meet future network requirements. In 2018–19, developer contributions of $347.2 million were recognised (a decrease of $34.7 million from 2017–18).
Figure 3J shows a consistent decline in QUU’s developer contributions since 2016–17.
Notes: Building approvals do not include alterations, additions, and conversions. QUU—Queensland Urban Utilities.
Compiled by Queensland Audit Office from Queensland Government Statistician’s Office, Unitywater, and QUU data.
The decline in QUU’s developer contributions resulted from:
- a reduced level of apartment projects due to an oversupply in the market
- QUU and Brisbane City Council ending their student accommodation stimulus program.
Unitywater’s developer contributions have remained stable (aligned with building approvals). This reflects the difference in demographics between the two regions.