
Overview
Entities within Queensland's education sector aim to help individuals make positive transitions from early childhood through all stages of schooling, providing knowledge and skills for future education, training, or the workforce.
The education sector, for the purposes of this report, includes the Department of Education; the Department of Youth Justice, Employment, Small Business and Training; TAFE Queensland; 7 universities; 8 grammar schools; and other statutory bodies.
Tabled 26 June 2023.

Report on a page
This report summarises the results of our audits of the entities in Queensland’s education sector, including the Department of Education; the Department of Youth Justice, Employment, Small Business and Training; TAFE Queensland; 7 universities; 8 grammar schools; and other statutory bodies.
Financial statements are reliable
All education entities’ financial statements are reliable and comply with relevant reporting requirements. The entities have efficient and effective financial statement processes, and they were able to prepare good-quality financial statements.
Security of information systems needs to be strengthened
We continue to identify weaknesses in the entities’ information systems. While the entities are addressing deficiencies identified in prior years and improving the security of their systems, the risk of cyber attacks continues to increase, which highlights the need for greater urgency. In 2022, a cyber security incident partially disabled one university’s information technology network when a compromised account was accessed. Given how much the entities rely on their information systems, it is critical that they establish stronger controls to protect their sensitive information from unauthorised users and cyber criminals.
Universities are managing risk but can do more
We found universities recognise the importance of managing their risks – cyber, academic integrity, research, financial, and health and safety. They have processes in place to identify and manage them, but most use spreadsheets to record and monitor risks. They would benefit from having a central system that automates the recording and monitoring of risks. This would provide efficiencies in processes and would also give them a big-picture view of risk across their business.
Universities’ operating results have decreased
This year, operating results for universities significantly decreased by $1.3 billion because of reduced Australian Government funding, losses on investments due to a decline in market conditions, and continued cost escalations. All universities, except for one, made a loss. The easing of Australia’s border restrictions in 2022 saw a small increase in revenue from international students, but revenue remains below pre-pandemic levels.
A decline in domestic student enrolments has proved to be challenging. More students are deferring or reducing their studies to enter the workforce and manage cost-of-living pressures. TAFE Queensland is also experiencing similar challenges and will need to continue assessing its cost of service delivery.
Departments continue to assess the condition of assets
Both departments are progressing with their asset condition assessments from 2022. The Department of Education is assessing the condition of all schools that are more than 5 years old, while the Department of Youth Justice, Employment, Small Business and Training is assessing the condition of its assets (TAFE campuses) using a risk-based approach.
Having up-to-date information on the condition of assets will help the departments in planning the timing and cost of maintenance, and in making decisions on replacing or upgrading assets in future.
Recommendations for entities
Education entities need to take immediate action regarding the security of their information systems
We strongly recommend that education entities continue to address the security of their information systems. We made the same recommendation in Education 2021 (Report 19: 2021–22).
We reported 60 weaknesses this year in the security of information systems. As cyber security threats increase in number and sophistication, entities must promptly address any weaknesses in their information systems. All entities need strong security practices and must emphasise the importance of them – in their processes and to their staff – in protecting against fraud, error, and significant reputational damage.
Other prior year recommendations also require further action
While progress has been made on the 2 recommendations from last year’s report, the Department of Education; the Department of Youth Justice, Employment, Small Business and Training; and TAFE Queensland still need to take further action.
We have included a full list of prior year recommendations and their status in Appendix C.
Reference to comments
In accordance with s.64 of the Auditor-General Act 2009, we provided a copy of this report to relevant entities. In reaching our conclusions, we considered their views and represented them to the extent we deemed relevant and warranted. Any formal responses from the entities are at Appendix A.
1. Overview of entities in this sector
This report summarises the financial audit results for education sector entities as at their year-end dates for preparing financial statements. For the Department of Education; the Department of Youth Justice, Employment, Small Business and Training; TAFE Queensland; and some statutory bodies, this was 30 June 2022. For universities, grammar schools, and other statutory bodies, it was 31 December 2022.
We provide 44 opinions in this sector. The analysis in this report focuses on the 18 entities highlighted in Figure 1A (some appear twice), representing 99.3 per cent of the revenue within the education sector.
Notes: Yellow outer circles indicate the entities included in this report.
CQU – Central Queensland University; DoE – Department of Education; DYJESBT – Department of Youth Justice, Employment, Small Business and Training; GU – Griffith University; JCU – James Cook University; QUT – Queensland University of Technology; TAFEQ – TAFE Queensland; UQ – The University of Queensland; UniSQ – University of Southern Queensland; UniSC – University of the Sunshine Coast.
* Department names and responsibilities were changed by Administrative Arrangements Order (No. 1) 2023 made by Governor in Council on 18 May 2023. This report reflects the departments that existed during 2022. Department of Employment, Small Business and Training (DESBT) was restructured to include the functions of Youth Justice to form Department of Youth Justice, Employment, Small Business and Training (DYJESBT).
Compiled by the Queensland Audit Office.
2. Results of our audits
This chapter provides an overview of our audit opinions for entities in the education sector. It also evaluates the effectiveness of the systems and processes (internal controls) the entities use to prepare financial statements, and the maturity (efficiency and effectiveness) of risk management internal controls at Queensland universities.
Chapter snapshot
Audit opinion results
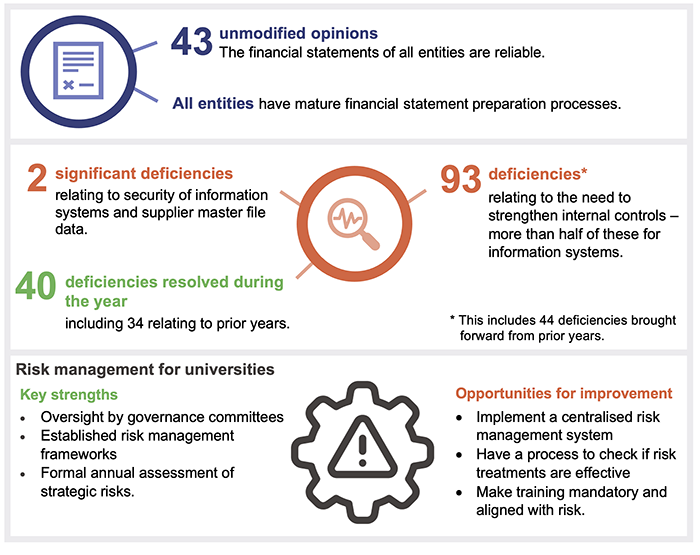
We issued unmodified audit opinions for all education entities in Queensland. Readers can rely on the results in the audited financial statements.
One university’s financial statement preparation was disrupted by a cyber security incident. The university received an extension to its legislative deadline for signing its financial statements. All other education entities met their legislative deadlines (with the exception of one that was not finalised at the date of this report).
We express an unmodified opinion when financial statements are prepared in accordance with the relevant legislative requirements and Australian accounting standards.
We provide the details of our audit opinions in Appendix D.
Entities not preparing financial statements
Not all Queensland public sector education entities produce financial statements. The full list of entities not preparing financial statements and the reasons is provided in Appendix E.
Entities should further strengthen their internal controls
We assess whether the internal controls entities use to prepare financial statements are reliable, and we report any weaknesses in their design or operation to management for action. We rate these weaknesses as either significant deficiencies (higher risk that require immediate action by management) or deficiencies (lower risk that can be corrected over time).
Overall, we found the internal controls that education sector entities have in place to ensure reliable financial reporting are generally effective but can be improved. We were able to rely on the internal controls for the purposes of our audit, but identified 2 significant deficiencies relating to security of/access to electronic payment files, and validation of changes to the bank details of suppliers.
Figure 2A summaries the nature of internal control deficiencies reported this year.
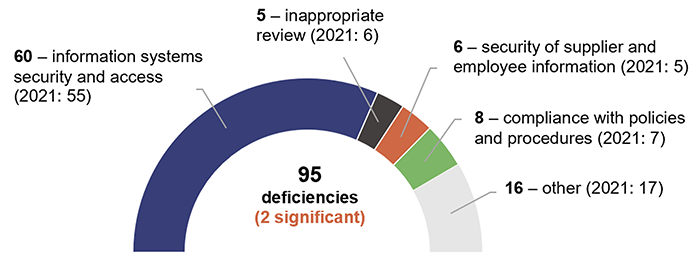
Compiled by Queensland Audit Office.
As part of our audits, we monitor how entities resolve the weaknesses we have identified. In 2022, entities resolved fewer than half of the prior-year and current-year deficiencies. The open issues mainly relate to information systems (62 per cent), which entities expect to resolve within the next 12 months.
Entities must evolve to keep pace with the rapid changes in technology and the growing risk of cyber attacks, and they must promptly address any weaknesses in their information systems. Our prior year recommendation – to strengthen the security of their information systems – remains relevant, as we have identified additional issues they need to address. Appendix C provides the full recommendation and its status.
Entities need to address ongoing security weaknesses in their information systems
According to the Australian Cyber Security Centre, education is one of the 5 sectors most vulnerable to cyber security incidents. Entities in this sector hold personal information on their students and employees, as well as on intellectual property associated with their research. All are targets for cyber attacks.
Entities in the education sector strive for collaboration and sharing of information between students, academics, and researchers. Managing access and security in this collaborative environment requires these entities to be on the forefront of information technology security practices.
Our most common findings across all education entities relate to the need to further strengthen security practices for:
- accessing the entities’ information technology networks and systems
- securing high-risk accounts such as those for people who have highly privileged/full-system access
- securing system accounts that do not need to be accessible for or operated by human users
- only giving system users the minimum amount of access they need
- updating security settings in line with better practices and each entity’s updated risk assessment and security policies.
Strengthening security for information systems also includes:
- people: ensuring employees, students, and research collaborators are aware of cyber security risks and what they need to do to report suspicious activities
- processes: ensuring that processes are in place to not only prevent and detect security incidents but also to respond and recover in the event of cyber security breaches
- technologies: continuously assessing and updating the security of systems in line with updated security recommendations from the information system providers (for example, Microsoft).
Queensland University of Technology had a cyber security incident
In December 2022, Queensland University of Technology (QUT) had a cyber security attack on its information technology network. The security breach occurred through a compromised account. Through this account, the threat actors (those conducting malicious activities) then gained ‘privileged’ access to some of the university’s systems. They introduced ransomware designed to encrypt the systems into an unusable state so the university would have to comply with the threat actors’ demands. Through a rapid response supported by third party experts, the university was able to contain the attack and limit its impact before it progressed further. No core systems were breached, and no ransom was paid.
This attack caused a partial disruption of services for the university that lasted more than 4 weeks. A key learning management system (Canvas), to support QUT’s learning and teaching activities, remained operational throughout. Figure 2B details the impacts.
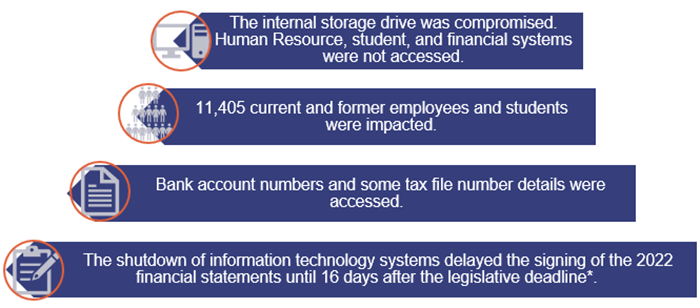
Note: * QUT received an extension to its legislative deadline for signing its financial statements.
Compiled by the Queensland Audit Office from publicly available information on the QUT website.
The cyber incident occurred when QUT was in the process of implementing its overall cyber security strategy that included addressing our recommendations to improve its information security practices. This highlights the need for education entities to address recommendations – from audits and other assurance providers – with greater urgency, particularly their security practices, as cyber threats continue to increase in frequency and sophistication.
We extended our audit approach in response to the cyber attack, to include:
- reviewing the reports of external experts who supported management in responding to the incident
- meeting with senior management to understand the impact of the incident on the business, and the recovery process
- validating the completeness and accuracy of balances in the finance system, once it was back online.
As a cyber security attack is no longer a matter of ‘if’ but ‘when’, each entity needs to develop a plan for how to respond. The plan should clearly outline the steps the entity will take when a cyber attack occurs, and the framework it will follow for decision-making. This year, we plan to complete an audit on Responding to and recovering from cyber attacks, which will provide insights into, and lessons learned from, entities’ preparedness for these attacks.
Universities’ risk management processes are generally effective, but could be improved
We have recently updated the model we developed for assessing the maturity of risk management practices. The model is available on our website at www.qao.qld.gov.au/reports-resources/better-practice. It enables entities to identify the maturity level they want to achieve, and to focus on key areas for development. The model also makes it easier to share better practices across the public sector.
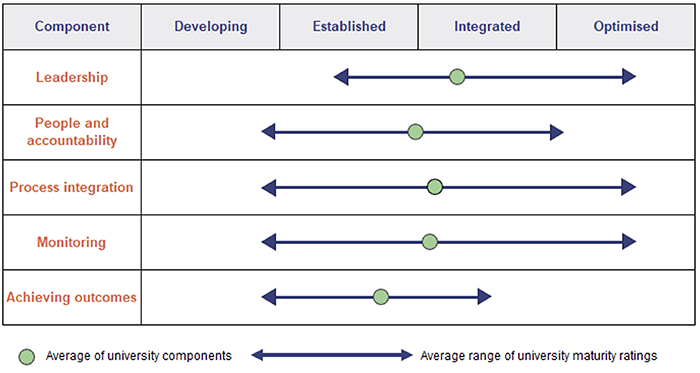
The updated model outlines 4 levels of maturity across 5 components of risk management (see Figure 2C).
We use 4 levels of maturity, which we define as:
- developing – an entity does not have this control, or it is not operating effectively, so the identified risk is not managed
- established – an entity shows basic competency in this area, so legislative requirements are met, or the identified risk is managed
- integrated – an entity is developed in this area or regularly demonstrates this, so controls work together to respond to the identified risk; however, the efficiency or effectiveness of controls could still be improved
- optimised – the entity consistently demonstrates this control and is a leader of best practice in this area.
This year, we worked with the 7 Queensland public universities to measure the maturity of their risk management processes.
On average, we assessed the majority of their processes as established or integrated, as shown in Figure 2C. We found the risk management processes universities have in place are generally effective, but could be improved.
Compiled by the Queensland Audit Office from our risk management maturity assessments.
Observations from risk assessment at universities
Universities are large organisations. The 7 public universities in Queensland have full-time equivalent staff of between 1,370 and 8,450, spread across multiple schools, faculties and supporting divisions. These have a history of operating semi-autonomously within an overall governance structure.
Common strengths across the universities included the following:
- Universities’ audit and risk committees provide effective oversight, including regular and open communication with executive management.
- Universities have established risk management frameworks, including policies and procedures.
- Senior management formally assesses strategic risks annually.
- Independent reviews and internal audits are completed in high-risk areas.
Opportunities to improve at some universities included the following:
- Risk treatment plans (documents that outline the internal controls that will be implemented to prevent a risk from occurring, or detect and respond if it does occur) are not always aligned with the university’s risk appetite (the amount of risk the university is willing to accept in achieving its strategic objectives).
- Risk treatment plans are implemented by individual risk owners, but the universities do not consistently monitor the effectiveness of the internal controls designed to address these risks.
- Training is not always mandatory or designed to align with the needs of individual risk owners. Some risk management training is provided as part of staff induction processes, with ad hoc training given when required.
This emphasises the importance of having a central risk team and system that can support an appropriate risk culture across all areas of the universities, and monitor and report to governance committees on risks. While some universities do their risk reporting through centrally maintained spreadsheets, a risk management system could improve the effectiveness and efficiency with which they manage risk. For example, by automating:
- prompts for overdue risk assessments or treatments, so they are timelier
- reporting so it is done faster and with less effort.
We found that risk assessments and mitigation strategies are generally well documented, but they are not maintained in a central system. Of the 7 universities, only one has risk management software.
Most universities have strong reporting and monitoring processes for key strategic and operational risk areas. Case study 1, in Figure 2D, describes how one university has taken a targeted approach to managing a key risk.
|
Opportunity to leverage off good risk management |
|---|
|
All universities recognise workplace health and safety as a key risk due to the nature of their business and the significant consequences if they do not manage this risk appropriately. They have large campuses with many staff and students who engage in a variety of activities, including teaching and research. Where universities fail to mitigate workplace health and safety risks, the consequences can extend beyond financial losses, and can include damage to their reputations, legal ramifications, and even impacts on human life. Risk treatments focus on ongoing review of workplace health and safety processes, regular internal audits, mandatory training, and adequate insurance coverage. Universities report on these risks to governance committees. At one university, a workplace health and safety incident occurred that involved a volatile chemical reaction, which could have resulted in personal injury. The university followed the procedures outlined in its risk management plan. This included notifying the appropriate regulatory authority immediately following the incident and conducting an independent investigation. The university prepared detailed reports identifying gaps and recommendations. These were discussed at its audit and risk committee and council meetings, and were then implemented. Learnings from this incident were used to strengthen other areas of the university that had a similar risk profile. All universities could leverage off the robust practices they use in certain areas, and use examples like this incident to implement better risk management across their whole businesses. The risk owners from this area could help to educate and provide training to other risk owners throughout the business, creating a risk culture across the university that is consistent and well managed. |
Compiled by the Queensland Audit Office from our risk management maturity assessments.
3. Financial performance of education sector entities
This chapter analyses the financial performance and position of education entities. It also analyses their financial sustainability and considers emerging issues relevant to the sector.
Chapter snapshot
The financial performance of universities has declined
The 7 Queensland public universities’ operating results significantly decreased this year, by $1.3 billion (177 per cent). Challenging domestic conditions, decreased Australian Government funding (with one-off research support not continuing), negative investment returns, and continued cost escalations have contributed to the losses incurred by 6 universities. Only University of the Sunshine Coast made a profit as it did not experience the same decreases in funding and investment returns. Of the 7 universities, 5 had budgeted for a loss in 2022.
To assess the long-term financial sustainability of universities, we calculate their operating ratios (revenue less expenses, expressed as a percentage of total revenue) as an average over time. As Figure 3A shows, the operating ratios for the universities have declined since last year. The challenging conditions are expected to continue in the short term, with most of the universities budgeting for a loss again in 2023.
This highlights the importance of universities continuing to manage their financial position and prioritise investment in areas that are critical to achieving their strategic objectives (for example, students and research activities).
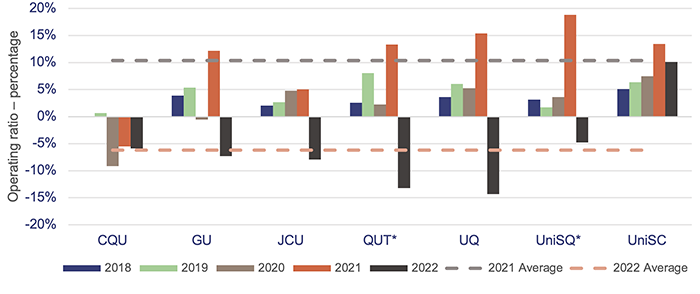
Notes: CQU – Central Queensland University; GU – Griffith University; JCU – James Cook University; QUT – Queensland University of Technology; UQ – The University of Queensland; UniSQ – University of Southern Queensland; UniSC – University of the Sunshine Coast. These ratios include controlled entities (whose finances and operations are controlled by one of the universities).
* In 2021, the operating ratios for QUT and UniSQ included one-off gains following the restructuring of their investment in Education Australia Limited, which they recorded as revenue. Other Queensland universities recorded this as equity (assets less liabilities).
Compiled by the Queensland Audit Office.
Universities received less Australian Government funding and lower returns on investments this year
In 2022, universities’ funding decreased by $49 million under the Commonwealth Grants Scheme, due to a reduction in the amounts determined by the Australian Government, and by $167 million for research. The reduction in research funding aligns with universities receiving $170 million in one-off support for research from the Australian Government in 2021.
Through the Commonwealth Grants Scheme, the Australian Government subsidises tuition costs for higher education students across a wide range of study disciplines and qualification levels.
In 2021, universities’ investments in managed funds – where their monies are pooled together with that of other investors – performed strongly. However, because of a decline in global financial markets, investment income in 2022 significantly decreased – by $677 million (180 per cent). Across the university sector, a $300 million loss on investments (2021: gain on investments of $376 million) was recorded. This can fluctuate from year to year depending on market conditions. Movements in investment income will not translate into actual cash until the universities receive payments (for example, dividends) from their investments or sell them.
University of the Sunshine Coast made a profit of $34.9 million in 2022. Its Commonwealth Grants Scheme funding increased by $5.6 million (4 per cent), including for the continued expansion of its Moreton Bay campus. (Most other universities received lower funding for 2022.) During the year, it invested in managed funds. The timing of this resulted in better investment returns than those of other universities that hold these types of investments.
Decreasing revenue from domestic students is emerging as a key challenge
In 2022, total revenue recorded by the university sector from domestic students decreased by $106 million (3.9 per cent) (2021: increased by $81.5 million – 3.1 per cent), led by lower domestic student enrolments and a reduction in Australian Government grants. The domestic student market proved challenging, with the record low unemployment rates causing reduced demand, and more students taking smaller study loads to enable them to meet increasing cost-of-living pressures.
Figure 3B shows the breakdown between domestic and international revenue and the equivalent full-time student load (EFTSL) over the last 5 years.
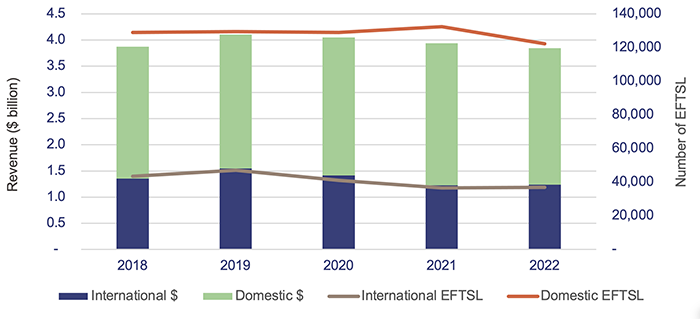
Notes: Not all students study full-time for a whole year. Equivalent full-time student load (EFTSL) is a way of representing the various study loads as a proportion of the study load the students would have if they were studying full-time for one year. ‘Number of EFTSL’ adds all of these together.
Compiled by the Queensland Audit Office.
The university funding model is complex. In 2021, the Australian Government introduced grant programs to help universities transition to new Job-ready Graduates Package reforms and to provide funding guarantees (regardless of student enrolments) for a 3-year period until 2023. In 2022, the transition payments made to universities decreased from $87.2 million to $38 million – by 56.5 per cent. The Australian Government has estimated that transition payments will decrease again for 2023 as universities adapt to the new funding system.
The arrangements to provide stability of funding to universities will be ending in 2023. This means universities will have their Commonwealth Grants Scheme payments (linked to student enrolments) reduced if they do not have enough domestic students enrolled to use the full funding available. This is a risk for some universities that are expecting student enrolments to continue decreasing. They will need to have strategies in place to attract and retain domestic students.
In November 2022, the Australian Government announced the establishment of an Australian Universities Accord. Its aim is to consult on a range of issues affecting the higher education system and provide recommendations to build a long-term plan for Australia’s universities.
International student numbers are still below pre-pandemic levels
Restrictions on international travel has had a major impact on revenue from international students over recent years. The reopening of international borders in 2022 saw all universities perform better than expected, and revenue from international students increased by $10.3 million (0.8 per cent) (2021: decreased by $189 million – 13.4 per cent).
Despite this, international student commencements in 2022 remained below pre-pandemic levels, and universities are focusing on rebuilding their pipeline of students. Lower international student enrolments since the start of the pandemic in 2020 will continue to impact on revenue in the short to medium term.
Franking credit claims are being reviewed by the Australian Taxation Office
Education Australia Limited is a company owned by 38 Australian universities. It went through a major restructure in 2021, which resulted in each university receiving shares in IDP Education Limited (a listed company), a cash dividend, and franking credits related to the dividends received.
Franking credits represent the tax a business pays on its profits. This saves its investors from having to pay tax on their share of the profits – known as dividends. Universities seek a refund from the Australian Taxation Office for the franking credits on their investment.
The franking credits claim for each university was $22.8 million and totalled $159.6 million for all Queensland public universities. The Australian Taxation Office is currently reviewing the eligibility of the franking credits claimed and has not refunded the majority of the 38 Australian universities’ claims. While this does not affect the 2022 results for Queensland universities, it may change next year, depending on the outcome of the review.
TAFE Queensland’s financial sustainability remains a risk
In Education 2021 we reported on TAFE Queensland’s (TAFEQ’s) significant financial challenges. We recommended that it continue to clarify how much it costs to provide each of its services, so it could make informed decisions about future services and efficiencies in operations.
TAFEQ reported an operating loss of $4.2 million in 2021–22, after receiving $17.4 million in one-off COVID-19 financial support and $12.6 million in one-off capital program funding from the Queensland Government. It also received $26.4 million from short-term funding agreements that ended during the year. TAFEQ’s losses are expected to continue in the future. While it is expecting to receive $41.9 million in a new funding arrangement with the Queensland Government in 2022–23, this is less than the total funding of $56.4 million it received last year. Despite this new funding, TAFEQ is still budgeting for an operating loss of $41.5 million in 2022–23.
The losses are driven by:
- ongoing low unemployment levels, which reduce overall training demand
- TAFEQ continuing to provide training in many regional and remote campuses where the training demand is low, resulting in a high average cost per student
- cost increases from growing employee expenses under enterprise bargaining agreements.
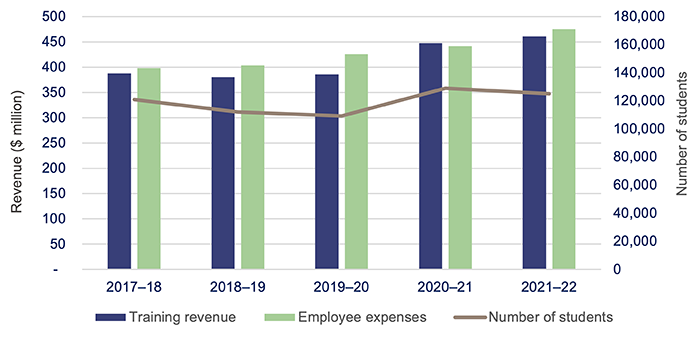
Figure 3C shows that, for the 5 years to 2021–22, a major cost in delivering training – employee expenses – grew at a higher rate than training revenue did. This revenue excludes grant contributions received from the state government to support its operations.
Employee costs make up an average of 68 per cent of total expenses. The number of employees – on a full-time equivalent basis – has increased by 6.8 per cent over the last 5 years, from 3,978 to 4,248. Student numbers increased by 3.4 per cent over the same period. TAFEQ needs to effectively manage its workforce to ensure it is sustainable and able to meet future demands.
Compiled by the Queensland Audit Office.
In Managing workforce agility in the Queensland public sector (Report 6: 2022–23), we stated that ‘Greater direction and leadership are needed to develop an integrated approach to strategic workforce planning, and to shift from operational to transformational approaches.’
In line with this, TAFEQ should undertake a robust assessment of the workforce skills it needs now, and in future, to meet its objectives including the expectations the state government places on it as a public provider. It should also continue to assess the impact of emerging technology and digital transformation on service delivery, workplace infrastructure, and workforce demand.
To improve its operating efficiency, TAFEQ continues to develop an organisation-wide educational planning tool that will enable a consistent approach to planning and enhance reporting (for example, on class sizes, teacher capacity, and productivity). This is anticipated to be in place in 2023–24.
TAFEQ is undertaking a major project focused on improving its customer engagement to increase the conversion rate of student inquiries to enrolments. It has also started a review of workforce structures to establish appropriate benchmarks for delivering support and corporate services across the state, as well as a review of the approval process for employing new staff. TAFEQ should use the outcomes of these initiatives to inform its broader workforce planning.
TAFEQ continues to work alongside Queensland Treasury and the Department of Youth Justice, Employment, Small Business and Training to develop a Queensland vocational education and training strategy that will assist with improving its sustainability. A longer-term vocational education and training reform under a new National Skills Agreement is currently being discussed by the Australian and state and territory governments. This agreement is proposed to commence in January 2024. TAFEQ will need to reflect any changes from this reform in its strategy.
Asset management at education entities
Property, plant, and equipment (land and buildings) continues to be the most significant item on the balance sheet for education entities, accounting for 85 per cent ($38 billion) of total assets.
The increasing value of assets in the education sector, and their importance in the delivery of education services, means entities need to carefully plan for their maintenance, upgrade, or replacement. Well‑developed asset management plans, linked to entities’ overall strategies, can help with investment decisions and ensure assets continue to be fit for purpose and respond to changing learning styles.
Asset values increased across the education sector
Measuring the value of some asset categories (such as land, buildings, and infrastructure) for education entities can be complex. It requires judgements and assumptions. This includes updating the fair value of their buildings (to represent how much it would cost to replace them at today’s prices). This is affected by various factors, including construction costs and labour supply.
Compiled by the Queensland Audit Office.
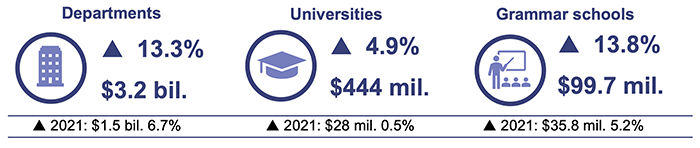
This year, all entities across the sector saw increases in the value of their assets. This was driven by a 10.6 per cent increase in buildings – by $2.4 billion – compared to an increase of $1.2 billion in the previous year.
Most of the increases were due to the growth in construction costs and shortage in labour supply experienced in the building sector. This indicates that the costs of constructing new buildings will be significantly higher than in the past, which in turn will create significant budget challenges.
Population growth continues to influence capital programs
Population growth continues to affect the way schools are being built and buildings are being replaced. The Queensland school-age population is forecast to grow by 6.8 per cent over the next 5 years. The Department of Education is building new and expanded schools in the regions expected to have significant population growth, to ensure they have the capacity to service their communities.
The department manages over 35,000 learning spaces and support facilities across 1,258 schools. It has built 4 new schools – as planned – ready for students commencing in Term 1 2023, and it will open 9 new schools between 2024 and 2026. This is a significant outlay for the department, with over $1 billion planned for expansion programs (new and existing schools) over the next 3 years.
While the expansion of education infrastructure is ongoing, existing infrastructure is continuing to age, requiring regular maintenance, upgrade, or replacement. Figure 3E shows the number of buildings the Department of Education owns, and the cost to replace them over the next 30 years. Approximately 67 per cent of buildings (equal to $15 billion) will need to be replaced in the next decade due to their age.
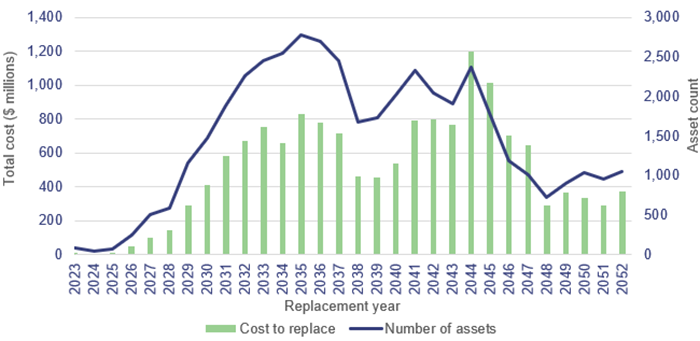
Compiled by the Queensland Audit Office, from Department of Education asset registers 2022.
The department will face challenges in achieving the desired outcomes from its capital investment program, with current market conditions placing considerable pressure on costs, and shortages in materials and labour creating risks around timing.
Departments have made progress with assessing the condition of their assets
In Education 2021 we reported that the Department of Education and the Department of Youth Justice, Employment, Small Business and Training were in the process of assessing the condition of their assets (condition assessments) to support their future maintenance plans. We recommended that both departments complete regular and timely condition assessments.
By including condition assessments as part of their normal maintenance processes, departments can identify the need for maintenance work based on condition, to ensure their assets can meet strategic and operational priorities.
Department of Education
The Department of Education undertook a pilot condition assessment process covering 8 schools in 2021–22. At the time of the pilot, issues were identified with the integration of the data into the department’s asset system. It has since rectified these.
Over the last year, the department implemented a condition assessment program covering all schools that are more than 5 years old – made up of 19 tranches that include 1,234 schools. Each tranche consists of schools located within a specific region, and tranches vary in size and type.
The condition assessment involves a full inspection and assessment of all buildings and infrastructure at each school and identifies maintenance works required. The department has completed the condition assessments of 12 tranches and is planning to have the remaining tranches assessed by the end of 2023.
So far this year, the Department of Education has evaluated data from the condition assessments from one tranche – consisting of 54 schools – and is integrating this into the individual school’s 4-year maintenance plans. These plans cover key preventative maintenance requirements, and ensure the assets are being maintained at the expected standards. The available condition data will be used to inform the department’s asset management plans, which will support their future maintenance programs.
Department of Youth Justice, Employment, Small Business and Training
The Department of Youth Justice, Employment, Small Business and Training undertook a pilot condition assessment at 2 sites in 2021. This indicated how much it would cost to perform the assessment across its entire asset portfolio, and resulted in the department adopting a risk-based methodology for a condition assessment program over a 3-year rolling period. This means it will not assess all its assets at this time.
The methodology involved reviewing the extent of inspections performed over the last 5 years, including the allocation of risk ratings, and identified 9 critical areas out of 30 building categories. The department has begun the condition assessment over the first critical area – electrical switchboards.
In the meantime, it has continued its delivery of prioritised maintenance (items that must be addressed promptly, such as safety issues) based on the results of prior inspections. Further work is required to appropriately capture, manage, and report on the asset condition data collated through the assessments. The department is currently developing a way to centralise the recording of this data, to inform future condition assessments.
Departments are meeting their minimum maintenance requirements
The Department of Education spent $369 million on maintenance in 2022, while the Department of Youth Justice, Employment, Small Business and Training spent $35 million. The Queensland Government Maintenance Management Framework states that a minimum of one per cent of each department’s building portfolio is required to be spent annually on maintenance to sustain building assets and achieve expected life cycles. However, despite spending the required amounts, due to rising costs the departments may not have completed all the expected maintenance that was needed.
Figure 3F shows that both departments have met their minimum maintenance requirements over the last 5 years.
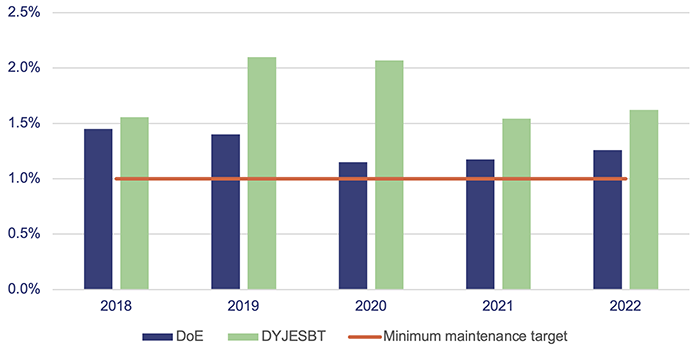
Note: DoE – Department of Education; DYJESBT – Department of Youth Justice, Employment, Small Business and Training.
Compiled by the Queensland Audit Office.
Together, the departments increased their expenditure on repairs and maintenance in 2022 by $79 million (24 per cent). Much of this increase can be attributed to cost escalations, due to supply chain issues, increases in the cost of construction material, labour supply shortages, and impacts from natural disasters.
Vaccination mandate in schools
On 16 December 2021, the Queensland Government implemented an employment vaccination directive in response to the growing concern about COVID-19. The directive was aimed at employees in high-risk settings, including health, education, corrections, and airports. The directive required all Department of Education employees within education facilities to be vaccinated by 17 December 2021, as a condition of employment.
With this directive in place, unvaccinated staff were stood down, which had an impact on the department’s workforce, and some employees received penalties for their failure to comply with the directive.
The Department of Education disciplined 925 employees. Of these:
- 637 employees received penalties of a reduction of one increment pay level for a period of time, a deferral of increments, or deductions to pay
- 152 employees either had their matters revoked, or have appealed to the Queensland Industrial Relations Commission, with no penalty being applied as yet
- 136 employees have resigned since the disciplinary penalty was imposed.
These employees make up approximately one per cent of the total full-time-equivalent workforce, but the department had the administrative burden of assessing the claims of staff seeking a vaccination exemption and of dealing with related actions. It also had to manage the supply of teachers. As identified in our Forward work plan 2023–26 we plan to complete a performance audit on managing the supply of teachers in 2024–25.
Enabling digital learning in state schools
In Enabling digital learning (Report 1: 2021–22), we shared information about how well the Department of Education is connecting the students and staff of state schools to digital resources and online content. We reported that the department’s benchmark for internet speed was 25 kilobits per second (kbps) per student, which was well below that of other states and not enough for the types of online learning now available for schools.
The Department of Education began a procurement process in April 2021 to increase the internet speed in schools. It signed a $187 million, 5-year agreement with a supplier to upgrade internet speeds across state schools in December 2021. It has increased average internet speeds to 1,000 kbps per student for most (65 per cent) school sites, as shown in Figure 3G. This is a significant improvement since March 2021 when we completed our report.
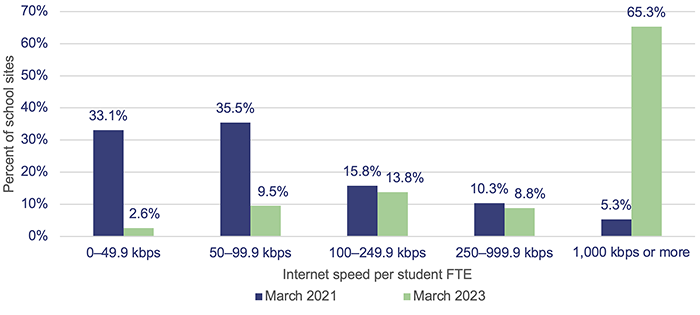
Note: FTE – full-time equivalent.
Compiled by the Queensland Audit Office from Department of Education data on internet speeds in schools.
Phase 2 of the department’s project is expected to see an increase in internet speeds to an average of 5,000 kbps for each student by 2026. The department is continuing to:
- work with the suppliers, who are upgrading the telecommunications exchange service. This will improve access to high-speed connectivity in the regions in which it is implemented
- work with the Queensland Government Chief Customer and Digital Officer to improve the digital infrastructure across the state. Of the 227 schools that were not on a fibre-optic connection (at March 2021), 7 are now connected. This is a significant step in improving digital infrastructure for schools, given the costs and distance to be covered for implementing fibre connection in regional and remote areas of Queensland
- provide guidance and support to schools to ensure students have access to the devices they need for digital learning and the internet
- enhance its technology infrastructure to support digital learning in schools.
2022 education dashboard
Our interactive map of Queensland allows you to explore information on education entities and compare to other regions, including data on revenue, expenses, assets, liabilities and other measures like student and staff numbers.