
Overview
In Queensland, state government owned corporations generate, transmit, and distribute most of the state’s electricity needs. They aim to ensure an affordable and reliable energy supply to households and businesses.
Tabled 2 December 2021.

Report on a page
This report summarises the audit results of Queensland’s six energy entities. These entities generate (CleanCo, CS Energy, and Stanwell), transmit (Powerlink), and distribute (Energy Queensland) most of Queensland’s electricity; and Ergon Energy Queensland is the electricity retailer for most customers in regional Queensland.
Financial statements are reliable
The financial statements of all entities in the energy sector are reliable and comply with relevant laws and standards. They were prepared in a timely manner and were of good quality.
Weaknesses in the security of information systems
We continue to identify weaknesses in the entities’ information systems.
Implementing new systems requires entities to establish new processes for assigning and monitoring access to their systems. Significant weaknesses were identified in these processes. Given how much entities rely on their information systems, they all need to strengthen their security.
Energy Queensland and Ergon Energy Queensland have been implementing their new information systems since December 2017. One significant change in scope has caused the project to be delayed, with estimated final completion by December 2022. The total expected cost is $650 million, which is $77 million over the revised budget.
Sector profits have increased
The energy sector’s profits increased from 2019–20, due to an increase in profit from the generators of $461 million. This was largely due to their power stations not decreasing in value as much as in 2019–20. Stanwell recorded a $375 million profit in 2020–21.
In May and June 2021, electricity prices increased. One of the main causes for the higher prices was the Callide C incident. On 25 May 2021 there was an incident at CS Energy’s Callide C power station which forced the unit offline. Subsequently, multiple power stations and transmission lines tripped, resulting in blackouts to approximately 470,000 properties across the state. CS Energy is seeking recovery from its insurer for material damage and business interruption.
Profits from the transmission and distribution entities declined by $223 million, due largely to a reduction in the revenue they are permitted by the Australian Energy Regulator to earn from their core business (transporting electricity to customers).
Future challenges
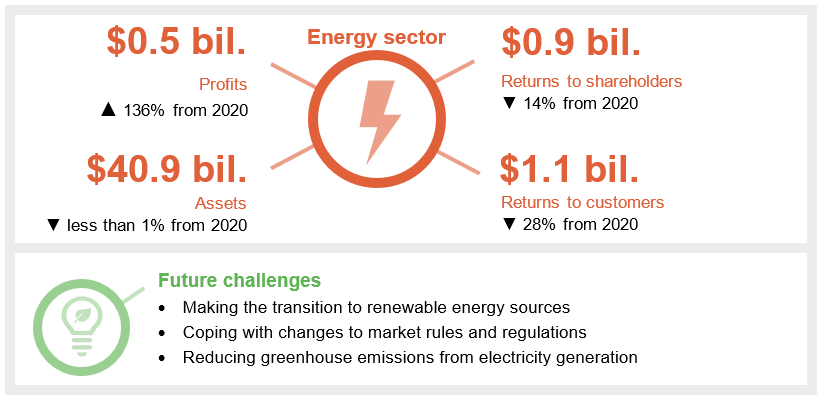
As the sector diversifies to renewable sources, the energy entities need to ensure they remain profitable and deliver reliable electricity supply to Queenslanders. The generators continue to invest in renewable energy primarily through power purchase agreements with privately owned solar and wind farms.
Integrating renewables and new technology into the electricity network is also a challenge as the sources can be in remote areas and can provide less predictable supply. With reduced profits, transmission and distribution entities need to manage their costs while maintaining network strength and stability.
Recommendations for entities
Information systems recommendation requires further action
Our only recommendation for the energy entities this year is that they address the security of their information systems. This was the same recommendation in Energy 2020 (Report 11: 2020–21). We have included the prior year recommendation and its status in Appendix C.
While entities took appropriate action to resolve the issues we reported to them last year, the implementation of new information systems meant similar control weaknesses were identified this year.
All entities must have strong security practices to protect against cyber attacks, fraud, error, and significant reputational damage. Our report on Managing cyber security risks (Report 3: 2019–20) provides information on effective management of cyber security risks and mitigation strategies.
Reference to comments
In accordance with s.64 of the Auditor-General Act 2009, we provided a copy of this report to relevant entities. In reaching our conclusions, we considered their views and represented them to the extent we deemed relevant and warranted. Any formal responses from the entities are at Appendix A.
1. Overview of entities in this sector
In Queensland, state government owned corporations generate, transmit, and distribute most of the state’s electricity. The following diagram shows their roles in the Queensland energy sector supply chain.
Notes:
- The National Electricity Market is the cross-state wholesale electricity market through which generators and retailers from the eastern and southern Australian states and territories trade electricity. Stanwell and CS Energy also participate in the retail market.
- Energex, Ergon, and Ergon Energy Queensland are subsidiaries of Energy Queensland Limited.
Compiled by the Queensland Audit Office.
2. Results of our audits
This chapter provides an overview of our audit opinions for the energy sector entities. It also provides conclusions on the effectiveness of the systems and processes (internal controls) entities use to prepare financial statements.
Chapter snapshot
Notes:
- Regulatory information notices are used to collect information from the transmission and distribution entities to assist the Australian Energy Regulator (AER) in deciding how much these entities can earn.
- Entities must have Australian financial services licences if they enter into contracts to manage the risk of fluctuating electricity prices. These entities must lodge an annual compliance form with the Australian Securities and Investments Commission.
Financial statements and other reports are reliable
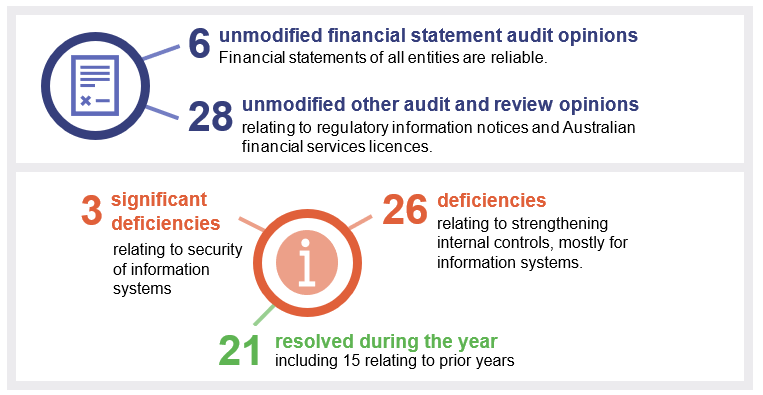
We issued unmodified audit opinions on the financial statements of all six energy entities in Queensland. This means their financial statements have been prepared in accordance with the relevant legislative requirements and Australian accounting standards, and therefore the results can be relied on.
All energy entities met their legislative deadlines for signing their financial statements. They assessed their financial statement preparation processes against the Queensland Audit Office’s financial statement preparation maturity model, and rated them as ‘integrated’ or ‘optimised’—the highest levels of maturity. This means they believe they efficiently provide high-quality information in a regular and timely manner. The results of our audit work supports their assessments.
Appendix D details the audit opinions we issued for energy entities in 2020–21. Not all entities in the energy sector need to prepare financial statements. Appendix E lists those that do not, and the reasons why.
Other audit certifications
We also provided assurance over regulatory information notices and Australian financial services licences, as well as two new minor certificates. Appendix D lists the audit certifications we issued.
For the regulatory information notices, if the information is based on actual data, we conduct an audit. If it is based on estimated data, we conduct a review. We have issued eight unmodified audit opinions and 14 unmodified review conclusions for these audits.
The entities fulfilled their obligations under their financial services licenses during the year.
Entities should strengthen the security of their information systems
We assess whether the internal controls used by entities to prepare financial statements are reliable. We report any deficiencies in the design or operation of those internal controls to management for action. Any deficiencies are rated as either significant deficiencies (those of higher risk that require immediate action by management) or deficiencies (those of lower risk that can be corrected over time).
In 2020–21, we found the internal controls energy entities have in place for reliable financial reporting were generally effective. We identified three significant deficiencies in one entity, but it promptly took appropriate actions to address these issues.
Figure 2A shows the nature of the internal control deficiencies we reported during the year.
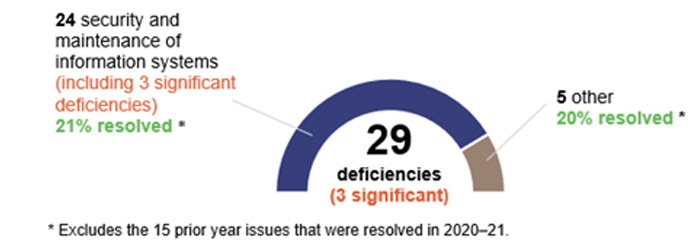
Compiled by the Queensland Audit Office.
The most common control issue we reported to energy entities this year related to weaknesses with information systems. This is consistent with last year. While entities took action to resolve the issues we reported to them last year, the implementation of new information systems meant similar control weaknesses were identified this year.
The control weaknesses identified mainly related to user access to the systems. Entities should only assign employees the minimum access required to perform their jobs, monitor the activities of privileged users (who can access sensitive data and create and configure within the system), and implement strong password practices and multifactor authentication (for example, a username and password, plus a code sent to a mobile).
We recommend all entities continue to act on the recommendation from our report last year to strengthen the security of their information systems. Appendix C provides the full recommendation and status as at 30 June 2021.
Energy Queensland’s implementation of its new information systems
The security of information systems has become even more important this year, as new systems are introduced.
Since December 2017, Energy Queensland and Ergon Energy Queensland have been implementing several new information systems. During the year, the final approved budget increased by $77 million to $650 million. A significant change in scope has delayed the system implementations, with final completion by December 2022. Any further delays will likely increase the final cost. Additional costs may not be recoverable by increasing customer network charges.
Governance of the energy entities
Boards play an integral role in setting the strategic direction for an entity, ensuring corporate compliance and management accountability. The role of an energy entity’s board is to:
- decide the objectives, strategies, and policies of the authority
- ensure the entity performs its function in a proper, effective, and efficient way.
Members are generally appointed for a term of three years, with the option to extend at the end of the appointment term. More than 50 per cent of members have been with their respective entity for more than one term, while 14 per cent of members were appointed in 2020–21.
A mix of tenures provides an adequate understanding of the entity and its operations, coupled with fresh insights and perspectives from new members. The average number of board members, their term, and fees are summarised in Figure 2B.
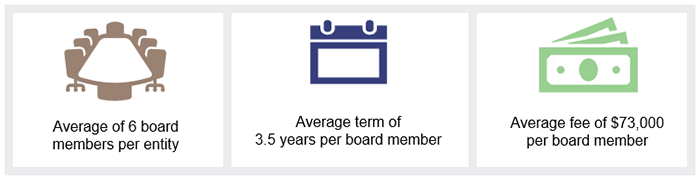
Compiled by the Queensland Audit Office.
Our report on appointing and renewing government boards, due to be tabled in early 2022, will evaluate the current guidelines, and will consider the makeup, diversity, and skill sets of board members.
Assessment tools for internal controls
We are developing new assessment tools for internal controls relevant to public sector entities. They will provide the entities with greater insight into the strength of their internal control processes.
These tools focus on asset management, change management, culture, governance, grants management, information systems, monitoring, procure-to-pay (the whole procurement process), record keeping, and risk management.
We are currently consulting with our clients on these tools and intend to begin using them in our audits from 2021–22. Our reporting on internal control deficiencies will not change.
3. Financial performance of energy entities
Chapter snapshot
Profits have increased for the sector
In 2020–21, the energy entities recorded a total profit of $0.5 billion, which is an increase of $0.3 billion (136 per cent) from the previous year.
|
Sector profits have increased largely due to the generation entities. This was primarily due to their power stations not decreasing in value as much as they did in 2019–20. Stanwell recorded a $375 million profit in 2020–21. Profits from the distribution business continue to decline due to revenue caps imposed by the Australian Energy Regulator (AER). |
Compiled by the Queensland Audit Office.
Electricity prices have reduced the value of the generators’ power stations
Future electricity prices are forecast to decrease, which has affected the value of the generators’ power stations. During the year, the generators determined that the future amounts they can recover from the use or sale of their coal and gas power stations are less than their current recorded value. As a result, the generators decreased the value of their power stations by $253 million ($1.1 billion in 2019–20).
Figure 3B shows that electricity prices in Queensland were lower for the first eight months of the year, before increasing in May and June 2021.
|
For the first eight months of 2020–21, Queensland’s average price was lower than it was in the previous two years. Prices were higher in May and June due to increased planned and unplanned coal power station outages, low wind conditions, and a cooler winter. |
Note: MWh—a megawatt hour, which is equal to 1,000 kilowatts of energy used continuously for one hour.
Compiled by the Queensland Audit Office from Australian Energy Market Operator (AEMO) data.
The Callide C incident was one of the causes of significant price volatility in the last quarter of 2020–21
The incident at Callide C power station significantly contributed to CS Energy’s asset write-down and the price volatility in May and June 2021.
On 25 May 2021 an incident occurred on generating unit C4, which resulted in an explosion and substantial damage to the unit, forcing it offline. Subsequent to the outage, multiple other Queensland power stations and transmission lines tripped. This resulted in power blackouts across Queensland and an increase in electricity prices. Power was quickly restored across the state, and CleanCo and Stanwell assisted in meeting demand while Powerlink and Energy Queensland reconnected affected customers.
CS Energy has restored three of the four generating units at the Callide B and C power stations. The fourth unit is expected to be offline for at least the next 18 months. The incident impacted on CS Energy’s financial results due to the loss of generation revenue, the cost of the damaged assets ($11 million), and the decrease in value of the power station ($104 million). CS Energy is seeking recovery from its insurer for material damage and business interruption.
Note: The National Electricity Market (NEM) is the cross-state wholesale electricity market through which generators and retailers from the eastern and southern Australian states and territories trade electricity. Wholesale electricity prices are one component of retail electricity prices (with the other components being network and retail costs).
Compiled by the Queensland Audit Office from AEMO data.
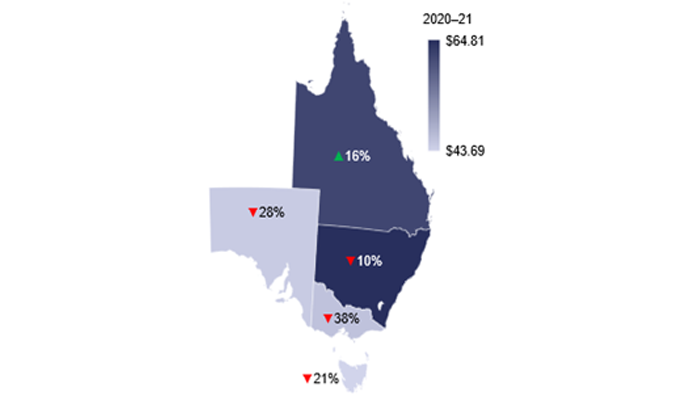
The price volatility in May and June 2021 resulted in Queensland being the only region in the National Electricity Market (NEM) to report an increase in its average wholesale electricity price in 2020–21, when compared with the prior year.
Generators and retailers manage fluctuations in wholesale electricity prices by entering into contracts with each other. They lock in a fixed price for electricity they will sell (generators) and buy (retailers).
Solar generation is reducing electricity demand and prices in the middle of the day
Solar generation of power has increased 66 per cent in the past two years, with 47 per cent of the increase coming from household rooftop solar. As solar generation is reliant on the sun, its peak output occurs in the middle of the day. Demand for electricity, however, typically rises in the evening when the sun is not shining. Battery storage will play an increasingly important role in the sector as generation from renewable sources increases.
Compiled by the Queensland Audit Office from AEMO and Clean Energy Regulator (CER) data.
Average electricity bills have decreased
In the 2020–21 year, there was an overall reduction of seven per cent in the annual electricity bill for a typical residential customer and a four per cent reduction for a typical small business customer.
Powerlink’s transmission revenue is expected to remain flat in 2021–22. However, in 2022–23, its revenue is expected to decrease due to a new determination by the Australian Energy Regulator, which limits the amount of revenue it can earn from its core business.
Distribution revenue is expected to remain flat for the next three years. A reduction in revenue may contribute to a continued decline in shareholder returns to the state government (which is the only shareholder).
Returns to shareholders and customers declined
Returns to shareholders are made up of dividends (a share of profits paid to shareholders) and income tax equivalents (which are paid by commercial operations in government instead of tax). Total returns to the state government amounted to $862 million, a decrease of $141 million (14 per cent) from the previous year. This is mainly due to decreased profits from the distribution businesses.
Figure 3E shows that in 2020–21, the Queensland Government (including through Energy Queensland) returned $1.1 billion to customers in rebates, concessions, and payments—down $413 million from the previous year (noting additional COVID-19 relief payments were made in 2019–20).
|
In 2020, the Queensland Government paid $404 million to assist households with the payment of electricity bills. Eligible small businesses also received payments of $86 million. This was included in the Affordable Energy Plan. These COVID-19 utility relief payments were not extended to 2021. In 2020–21, there were $213 million in other electricity rebates and concessions. The government continued to support regional customers by making community service obligation payments (CSO) to Energy Queensland to subsidise the high costs of providing electricity to regional Queensland. Because the retail tariff rates reduced, CSO payments to Energy Queensland decreased by $44 million compared to 2020. Without these payments, Ergon Energy Queensland would have recorded a loss of $165 million in 2020–21. |
Note: The Solar Bonus Scheme relates to payments made by Energy Queensland to customers for the power they contributed to the energy grid through their rooftop solar. Other electricity rebates and concessions mostly consists of payments made to eligible pensioners and seniors.
Compiled by the Queensland Audit Office.
Future challenges for the energy sector
Generation from renewable energy sources is increasing
Stanwell’s and CS Energy’s power stations, which are predominantly coal-powered, generated 60 per cent of the state’s electricity in 2020–21, while CleanCo generated four per cent. The diversification to renewable energy sources, along with the planned retirement of existing coal power stations—with the first forecast closure in 2028 and the last in 2046—will see a change in the generation mix in Queensland.
Figure 3F shows the dominance of coal in Queensland’s generation profile in 2020–21. Energy generated from renewable sources is expected to replace coal as the power stations progressively retire. This change will impact on the generators’ operations and decisions about investing in assets.
Notes:
- GWh—a gigawatt hour, which is equal to 1,000 megawatts (MW) of energy used continuously for one hour.
- Generation amounts do not include generation from small-scale generators with capacity of less than 30 MW.
Compiled by the Queensland Audit Office from AEMO and OpenNEM data.
In response to this shift, the generators are investing in renewable energy, mostly by entering into agreements to purchase power from privately constructed solar and wind farms.
Progress towards achieving the state’s target of 50 per cent renewable energy consumption by 2030
Our recently tabled report, Managing Queensland’s transition to renewable energy (Report 5: 2021–22), examined the state’s transition to its 50 per cent renewable energy target by 2030. We found that Queensland’s renewable energy consumption had increased to around 19 per cent in 2020–21.
While rooftop solar is still the greatest source of renewable power for the state, wind and large-scale solar generation have increased over the past five years. They now contribute over seven per cent (0.03 per cent in 2016–17).
The increased generation from renewable sources places greater pressure on the reliability of electricity generation and network infrastructure because sources such as solar and wind power are dictated by weather and can be unpredictable. The government’s recently announced Queensland Renewable Energy Zones (in which it plans to invest in energy infrastructure and encourage new renewable generation projects) may partially address this issue, but further investments in network improvements are likely to be needed.
In the current year, Powerlink connected four renewable projects in Southern Queensland to the National Electricity Market. Next year, it is committed to connecting five renewable projects in Northern, Central, and Southern Queensland.
The government has announced a major investment in renewable and hydrogen projects
During the year, the Queensland Government announced a two billion dollar Queensland Renewable Energy and Hydrogen Jobs Fund. The new fund helps the energy entities to increase their ownership of renewable energy and hydrogen projects, including by supporting infrastructure development. Investment proposals submitted for consideration through the fund can be developed in partnership with the private sector.
The energy entities continue to diversify their portfolios by announcing investments in renewable energy projects. During the year, this included projects for battery storage, solar thermal energy, partnerships with private investors to commence feasibility studies for hydrogen projects, and entering into purchase agreements for new renewable energy.
Rules are changing in the electricity market
From 1 October 2021, wholesale electricity prices will be determined every five minutes (instead of every 30 minutes). The energy entities estimate that they have spent $45 million updating their information systems to ensure they are ready to operate under these new rules.
Greenhouse emissions from coal power stations
Electricity generation from coal power stations is one of the largest emitting industries. Figure 3G shows greenhouse gas emissions by state-owned coal power stations.
Note: 2020–21 emissions data is yet to be submitted to the Clean Energy Regulator.
Compiled by the Queensland Audit Office from Clean Energy Regulator data.
The generators report annually on greenhouse emissions, energy consumption, and energy production to the Clean Energy Regulator under the National Greenhouse and Energy Reporting Scheme.
CS Energy and Stanwell are among the top 10 emitters in Australia. The emissions depend on the amount of electricity generated, quality of coal and plant maintenance. They mainly relate to the operation of Tarong, Stanwell, Callide and Kogan power stations. With the exception of Callide B, emissions from these power stations decreased.
The government owned corporations within the electricity sector are reducing their carbon footprint by investing in renewable energy and battery storage projects and exploring hydrogen investment opportunities.
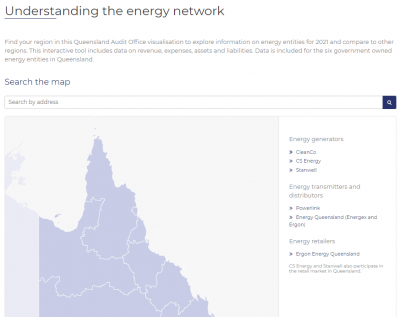
2021 energy dashboard
This Queensland Audit Office interactive map of Queensland allows you to explore information on energy entities for 2021 and compare to other regions. You can find information on energy in Queensland by typing your address into the search bar or clicking on your local council or an entity.