Overview
In Queensland, state government-owned corporations generate, transmit, and distribute most of the state’s electricity. They work to ensure affordable and reliable supply against the backdrop of fluctuating demand on the power grid, shifting coal and gas prices, and the supply of renewable energy sources.
Tabled 11 December 2025.

Report on a page
This report summarises the audit results of Queensland’s state-owned energy entities. These entities generate, transmit, and distribute most of Queensland’s electricity, and provide retail services to regional residential, commercial, and industrial customers.
The entities’ financial statements are reliable
The financial statements of the energy entities are reliable and comply with relevant reporting requirements. All energy entities met the legislative deadlines for signing their financial statements.
The energy entities have resolved most deficiencies identified in prior years. We identified a lower number of control deficiencies across the energy sector this year. Most identified issues related to information security, specifically how entities manage and restrict access to their information systems.
A digital transformation program for Energy Queensland has been rescoped
Energy Queensland has rescoped a digital transformation program that it initiated in 2016. Energy Queensland has capitalised technology projects totalling $639 million. In addition to this, it has written off $73.8 million in costs over the past 3 years for components of the program which were not expected to realise benefits from the investment. Energy Queensland is continuing with other digital transformation projects.
Financial results for energy entities varied
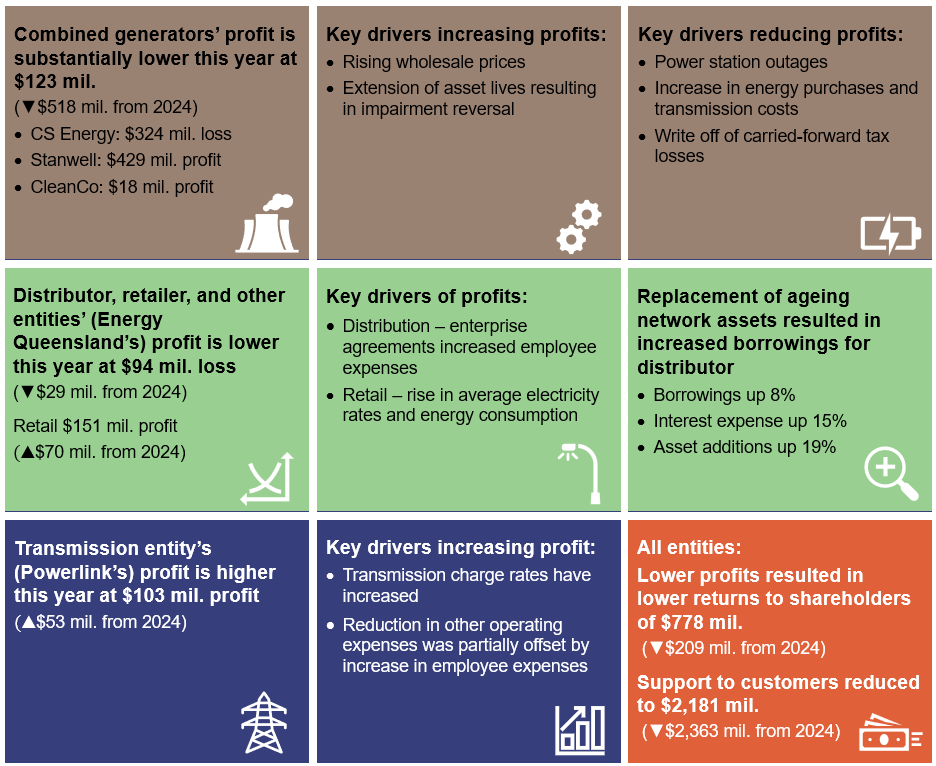
In 2024–25, Stanwell, Powerlink, CleanCo, and Ergon Energy made profits, while CS Energy and Energy Queensland incurred losses. The key drivers of the financial results include higher tariffs charged to customers and an increase in average wholesale energy prices. The extension of the operating lives of the coal power stations has increased the value of power stations, reversing previously recognised losses. The increase in revenue was offset by higher energy expenses, employee costs, and losses from contracts that manage fluctuations in wholesale energy prices.
Transmission and distribution entities continue to expand their networks by constructing and upgrading their assets. Asset construction and upgrades are mainly financed by borrowings from Queensland Treasury Corporation, equity injections from the Queensland Government, and cash generated by entities.
Current energy sector developments
In April 2025, the Australian Energy Regulator (AER) issued a determination that capped the revenue Energy Queensland can recover from its customers over the next 5 years at $17,575 million. This represents an increase in revenue of $5,448 million from the previous 5-year determination. The AER estimated that this will result in Queensland residential and small business electricity bills increasing by around $48 and $97 a year, respectively.
Energy sector entities will prepare their first climate-related financial disclosures in 2025–26. We will issue limited assurance review opinions on these disclosures in August 2026.
The Queensland Government released its Energy Roadmap on 10 October 2025. The Energy Roadmap indicates that the coal assets will continue operating as long as needed in Queensland’s energy system. Any additional extension of useful lives of these assets will affect their future values.
1. Recommendations for entities
We do not make any new recommendations in this report. We have reported internal control deficiencies to individual entities during our audits.
In Energy 2023 (Report 5: 2023–24), we made recommendations to address weaknesses in the energy entities’ information and technology (IT) controls. We have included the recommendations and the actions taken to implement them in Appendix D.
Although the security of information systems has improved, we found control deficiencies that require further action.
Our previous recommendations remain relevant to the internal control deficiencies identified in the current year. Further details relating to key themes over the IT deficiencies are included in our report Information systems 2025 (Report 6: 2025–26).
Reference to comments
As per s. 64 of the Auditor-General Act 2009, we provided a copy of this report to relevant entities. In reaching our conclusions, we considered their views and represented them to the extent we deemed relevant and warranted. Any formal responses from the entities are in Appendix A.
2. Entities in this report
In this report, we cover the Queensland state government-owned corporations that generate, transmit, and distribute electricity and provide retail services to regional customers. The following diagram shows the corporations’ roles in Queensland’s energy sector supply chain.
Compiled by the Queensland Audit Office.
As shown in Figure 2A, CleanCo, CS Energy, and Stanwell generate electricity. Powerlink transmits this electricity to Energy Queensland, which then distributes it to retail consumers. The National Electricity Market is the wholesale electricity market where generators and retailers from Australia’s eastern and southern states trade electricity. The Australian Energy Market Operator manages the wholesale and retail markets.
Energex Limited (Energex), Ergon Energy Corporation Ltd (Ergon), and Ergon Energy Queensland are subsidiaries of Energy Queensland. These entities service South East Queensland and regional areas of Queensland. Ergon Energy Queensland refers to itself as Ergon Energy Retail and Ergon Energy Corporation Ltd refers to itself as Ergon Energy Network.
CleanCo, CS Energy, and Stanwell also participate in the retail market, providing energy solutions to large commercial and industrial organisations.
3. Results of our audits
This chapter gives an overview of our audit opinions for the energy sector entities. It provides conclusions on the effectiveness of the systems and processes (internal controls) entities use to prepare financial statements. It also gives an update on Energy Queensland’s digital program and changes in board membership within the energy entities.
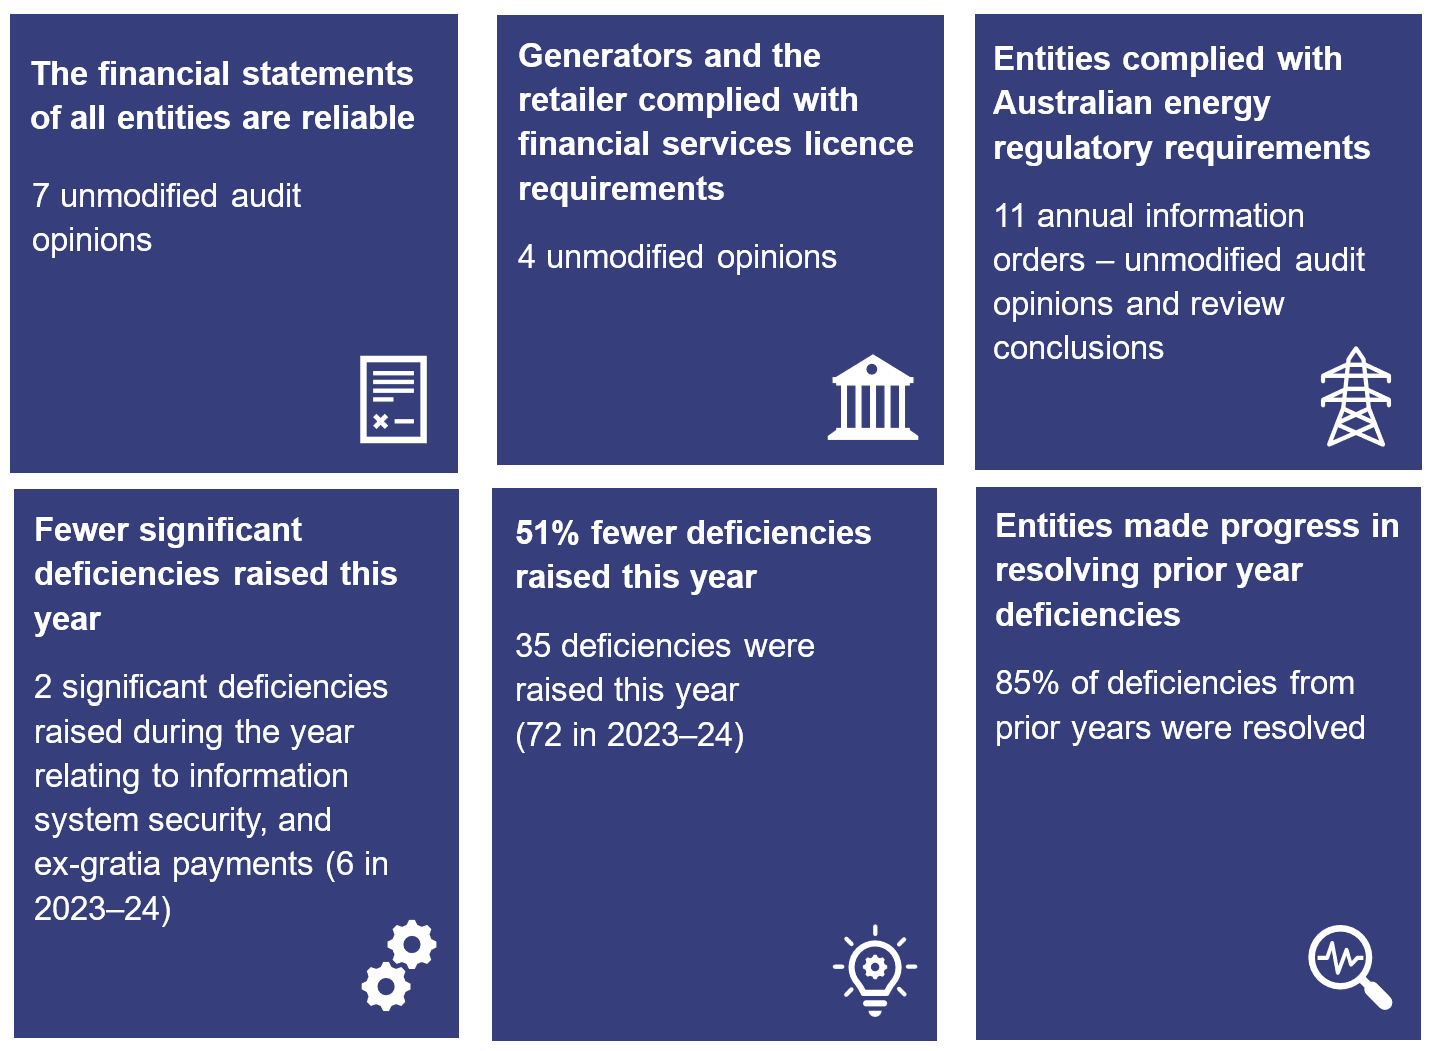
Chapter snapshot
Audit opinion results
We issued unmodified audit opinions for all state-owned energy entities in Queensland. This means the results in their financial statements can be relied upon, as they were prepared in accordance with the relevant legislative requirements and Australian accounting standards.
All entities reported their results within their legislative deadlines. Appendix E provides details on the audit opinions we issued for energy sector entities in 2025.
Other audit certifications
The Australian Energy Regulator uses annual information orders (AIOs) to collect information from the distribution and transmission entities, to assist it in deciding how much these entities can earn. Previously these were called regulatory information notices. We have issued 5 audit opinions and 6 review conclusions in total for Energex, Ergon, and Powerlink this year.
We issued 4 unmodified audit opinions relating to compliance with the Australian financial services licence. Energy entities are required to hold these licences to trade in electricity financial products, which are used for managing the risk of fluctuating wholesale and retail electricity prices.
In Appendix E, we list the assurance engagements we performed during the year on AIOs and Australian financial services licences.
Entities not preparing financial statements
For each state public sector company, other than government owned corporations, the board of directors considers the requirements of the Corporations Act 2001 and the company’s constitution to determine whether financial statements need to be prepared.
Entities that are part of a larger group and are secured by a guarantee that the larger group will cover the entity’s debts are not required to prepare a financial report. In addition, dormant or small companies that meet specific criteria under the Corporations Act 2001 are not required to prepare financial statements. Appendix F lists the energy entities that are not required to produce financial statements for 2025.
Internal controls are generally effective
We found that the controls over the systems and processes used to prepare financial reports were effective but can be improved.
We assess whether the internal controls entities use to prepare financial statements are effective in preventing material misstatements and fraud. We report to management any deficiencies in the design or operation of those internal controls. Findings rated as deficiencies are of lower risk and can be corrected over time. Those rated as significant deficiencies are of higher risk and require immediate action by management.
Internal control findings have decreased by 53 per cent compared to the prior year. This was driven by an improvement in the information system controls.
Figure 3A shows the types of deficiencies we identified. It includes unresolved deficiencies from prior years as of 30 June 2025.
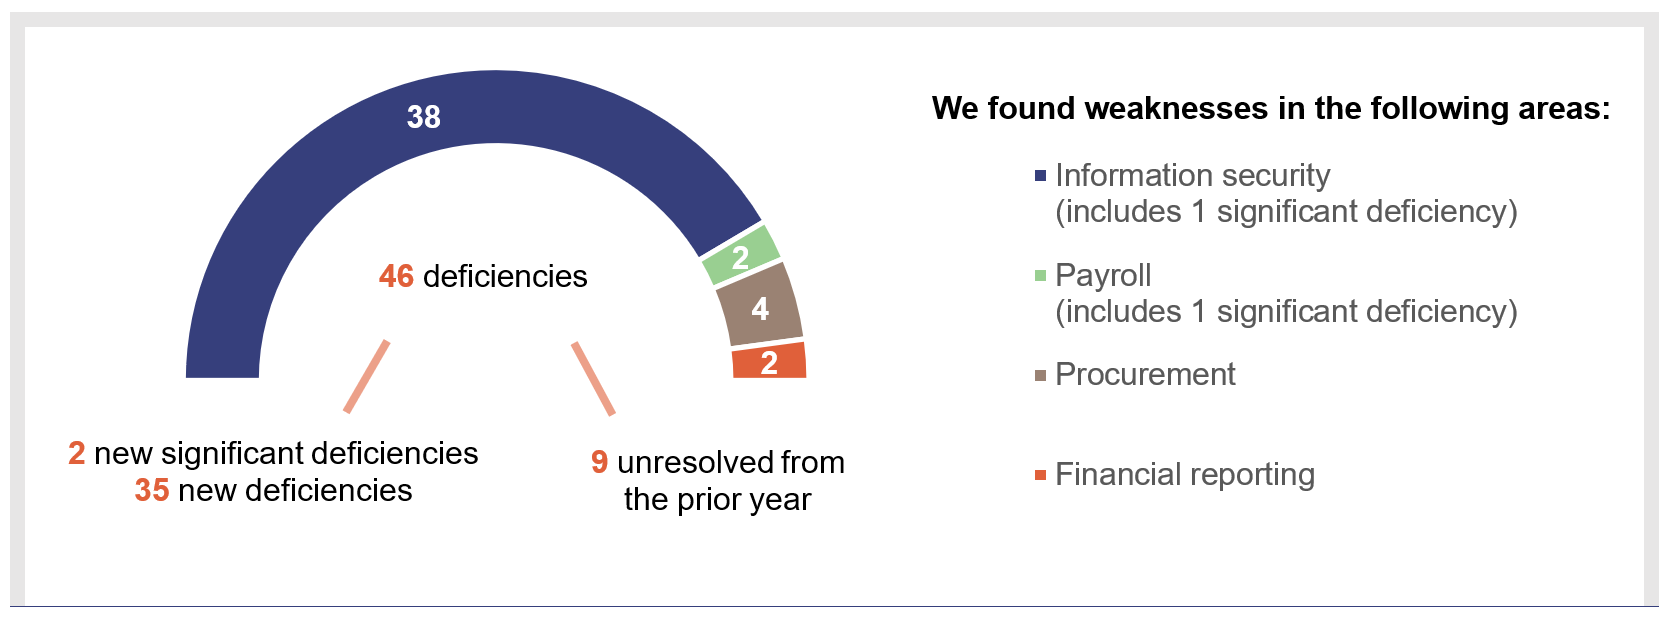
Compiled by the Queensland Audit Office from reports issued to the relevant entities.
Information system controls are improving
Over the past 2 years, weaknesses in information security represented most of the deficiencies we reported to management. Last year, we found 67 information security issues and this year we raised 29 issues. Key themes of these findings were:
- Several external users were given unrestricted access (full-system access) to information systems. This creates a risk of inappropriate or unauthorised actions being taken in the system. One of these issues was rated as a significant deficiency as it related to a high number of privileged users in a key system. This, together with a lack of monitoring of user activities, heightened the risk of unauthorised changes to sensitive data.
- Several entities had weak password settings for service accounts. Service accounts are special accounts used to run automated business processes, and are used by applications rather than people. Service accounts should be secured to prevent human interaction, given that their role is to run processes and enable communication between systems.
We provided further detail of information systems deficiencies in our report Information systems 2025 (Report 6: 2025–26).
Ex-gratia payments not in accordance with Queensland Treasury policies
We found that 2 senior executives were paid ex-gratia payments totalling $407,873. The amounts paid to each executive was greater than the limits established by Queensland Treasury policy.
We identified similar deficiencies in other public sector entities. We will include further detail on this and other similar significant deficiencies in our upcoming report State entities 2025.
Energy sector’s boards of directors and chief executive officers have changed
Boards of directors are responsible for the overall governance of entities. They set the strategy and risk appetite, monitor business performance, and ensure their entities conduct themselves in an accountable and transparent manner. Management, led by chief executive officers (CEOs), is responsible for day-to-day business operations and implements the boards’ policies and strategies.
Changes in board membership and management bring new strategic focus and perspectives to organisations. As part of the change management process, risks associated with losses of corporate knowledge and continuity should be identified and managed.
On 30 June 2024, energy entities had 38 board members across 5 energy entities. The changes to the boards during the period resulted in the number of board members decreasing to 35 as at 31 October 2025. The changes are summarised below:
- 27 new appointments – made up of
- 15 for generators
- 5 for the distribution entity
- 7 for the transmission entity
- 30 former board members departed, of which
- 5 ended on their scheduled expiry date
- 25 ended before their term expired.
During the same period, the CEOs of Powerlink and CS Energy departed. Since then, CS Energy has appointed a new CEO and Powerlink has an interim CEO.
Our previous report Appointing and renewing government boards (Report 17: 2021–22) assessed the appointment and renewal process for board members of Queensland government entities. This report contains better practice principles for appointing members to boards. Some key recommendations for the appointment of board members from the report were for the Department of Premier and Cabinet to:
- collect consistent information on the diversity characteristics of all people appointed to boards to allow it to analyse the diversity of members and report publicly on how boards reflect the diversity in the broader community
- develop, in collaboration with Queensland Treasury and relevant departments, a whole-of-government overarching framework (aligned to better practice as outlined by the ASX Corporate Governance Council and the Australian Institute of Company Directors) for the appointment process for large boards
- evaluate the effectiveness of the Queensland Register of Nominees database to readily identify people with the skills needed
- set fair and competitive remuneration rates for board members, commensurate with size, complexity and responsibility.
Energy Queensland’s digital transformation program
A digital transformation program has been rescoped
Energy Queensland rescoped a digital transformation program that it started in 2016. This digital transformation program comprised of several individual projects it planned to implement as a single program. Numerous projects within the program were completed, however, a number of projects experienced significant delays, scope changes, and budget variations.
To date, Energy Queensland has implemented technology projects totalling $639 million. Some of the projects that have been implemented include a payroll system, fleet management system, geographic information system, and project management system.
In addition to the cost of implementing the above projects, Energy Queensland has written off $73.8 million in costs over the past 3 years. This represents 10.3 per cent of the total program costs. These write-offs related to components of the program which were not expected to realise benefits from the investment.
Figure 3B shows the timeline for Energy Queensland’s digital transformation program.
Year | Budget/costs to date | Status and write-offs |
|---|---|---|

2016–17 | $238 million initial approved budget. | Expected completion 2019–20. |

2018–19 to 2021–22 | Multiple increases to the budget, ending at $717 million. | Multiple scope changes and delays. |

2022–23 | $699 million spent to date with budget increase to $952 million. | Program replanning commenced. The program was separated into individual projects, some of which were discontinued. Revised completion – June 2026. $31.2 million written off. |

2023–24 | $706 million spent to date with budget decrease to $798 million. | Program replanning continued with scope changes. $42.6 million written off. |

2024–25 | $713 million spent in total. | Program rescoped. |
Compiled by the Queensland Audit Office from data provided by Energy Queensland Limited.
Energy Queensland is continuing with upgrading and replacing its systems
Energy Queensland is continuing with upgrading and replacing older systems, such as network and customer billing systems, with new technologies. In 2024–25, Energy Queensland spent $110 million on system upgrades and replacements. It also wrote off another $36 million on systems that will no longer be usable by the entity. The majority of the write-offs related to a customer management experience system.
4. Financial performance of energy sector entities
This chapter analyses the financial performance and position of energy sector entities. It also considers emerging issues relevant to the sector.
Chapter snapshot

New developments in energy • The Queensland Government released the Energy Roadmap on 10 October 2025, which is its plan for meeting Queensland’s energy needs in the coming years. |
Financial results declined due to higher expenses
Overall profits across the sector decreased by $494.0 million in 2024–25 to $131.6 million. Profits were impacted by higher energy expenses, losses from hedging contracts, higher employee expenses, and expected losses from debtors. As a result, returns to the shareholder (the Queensland Government) decreased by $208.5 million.
Figures 4A and 4B outline the profitability of the energy entities. Generators experienced a decline in profitability overall.
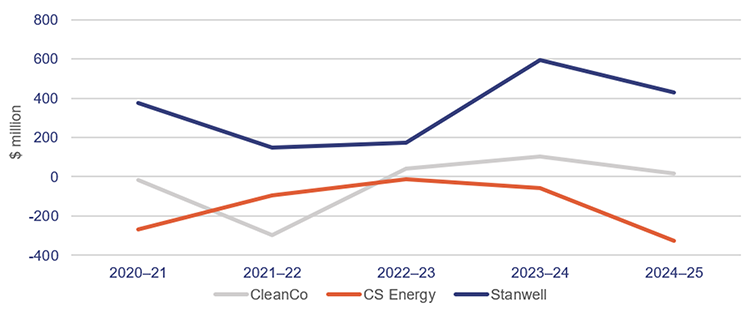
Compiled by the Queensland Audit Office from generator entities’ audited financial statements.
Energy Queensland also incurred a loss, partially offset by the increased profitability of its subsidiary Ergon Energy Queensland.
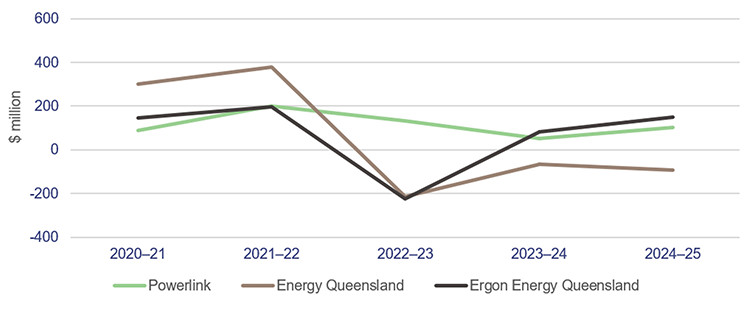
Compiled by the Queensland Audit Office from distribution, retailer, and transmitter entities’ audited financial statements.
Analysis of energy sector revenue
In 2024–25, the total revenue increased to $13,353.6 million (2023–24: $12,529.8 million). Queensland’s energy sector entities earn revenue primarily from wholesale generation, retail sales, and network services (energy sector revenue). This excludes other revenue. Energy entities trade with each other, and in presenting our analysis of the energy sector revenue, we have not eliminated these transactions between entities.
Retail revenue now represents the largest share of total revenue for the sector, up from 30 per cent in 2021–22, to 40 per cent in 2024–25. Generators’ revenue (wholesale) is down from 43 per cent in 2021–22 to 30 per cent in 2024–25. The decline was caused by reduced electricity generated at CS Energy’s Callide power stations and an increase in rooftop solar generation by residential customers.
Distributor and transmitter revenue as a share of total revenue remained relatively consistent.
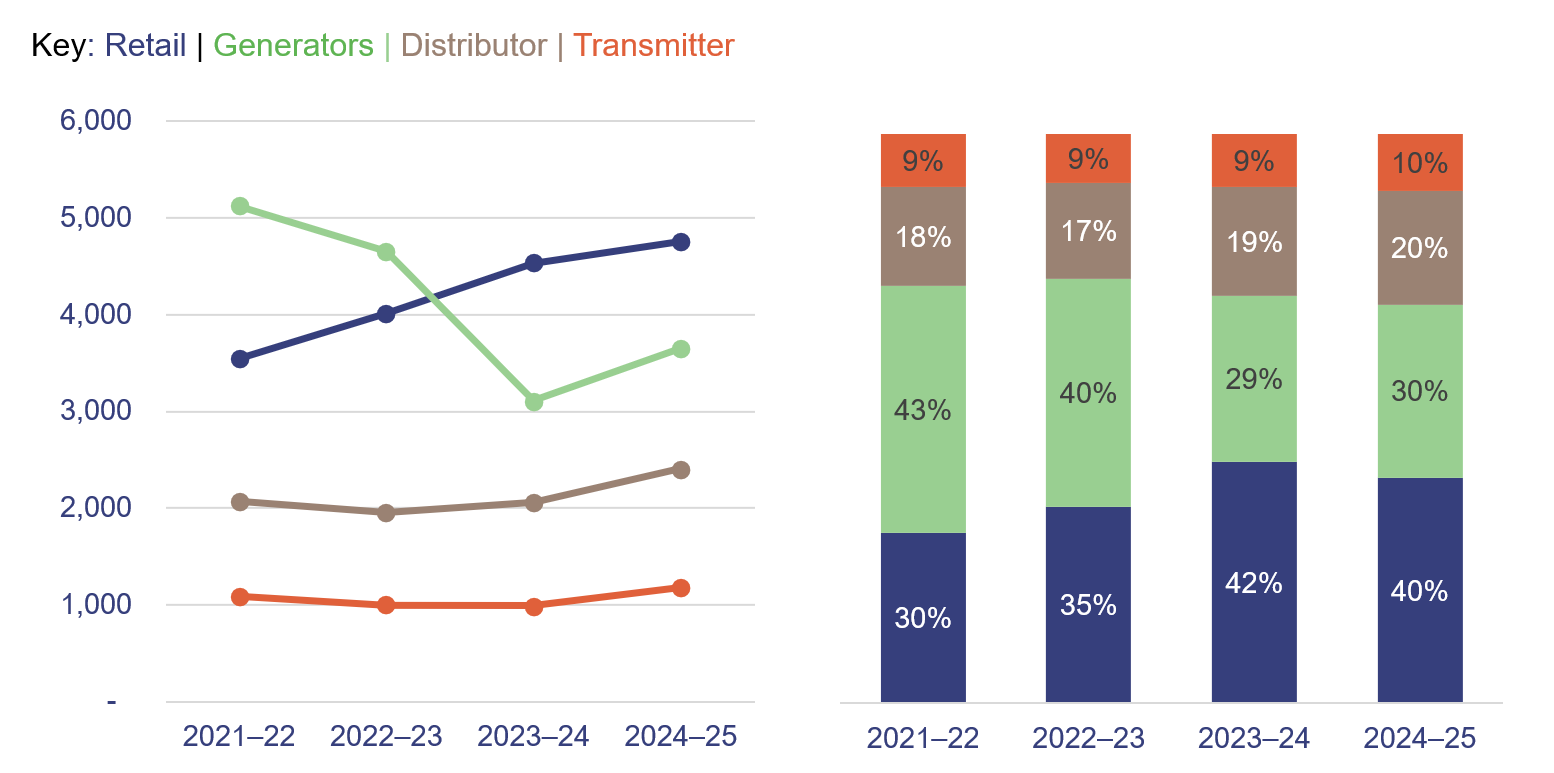
Compiled by the Queensland Audit Office from energy entities’ audited financial statements.
Higher electricity rates and consumption increased revenues
Retail revenue increased from $4,536.2 million from 2023–24 to $4,756.0 million in 2024–25 (5 per cent). The increase is because of higher electricity rates charged to customers. The high cost of maintaining the electricity network and increases in retail cost allowances led to an increase in electricity rates.
Retail revenue includes sales of electricity to households, and commercial and industrial customers.
Ergon Energy Queensland supplies electricity to households in regional Queensland and accounts for 53 per cent of retail revenue earned by state government-owned energy entities.
The generators also sell energy on the retail market to commercial and industrial customers. Higher revenues were driven by a growth in the number of new commercial and industrial contracts.
Transmitter and distributor revenues represent the revenue earned from transporting electricity to households and businesses. Higher demand, together with the increase in tariff rates, resulted in network and grid revenues increasing by $545.5 million (18 per cent).
Queensland’s wholesale electricity prices increased
Prices increased across the National Electricity Market (NEM) in 2024–25. Energy generators earn wholesale revenue for supplying electricity to the NEM. Wholesale electricity prices, also known as electricity spot prices, are determined at 5-minute intervals based on supply and demand. These wholesale prices are included in the final retail price paid by consumers, along with network costs, the retailer’s costs, and other costs.
Figure 4D shows that average annual wholesale NEM prices increased. Although Victoria continues to have the lowest average wholesale price, Queensland had the smallest price increase in 2024–25.
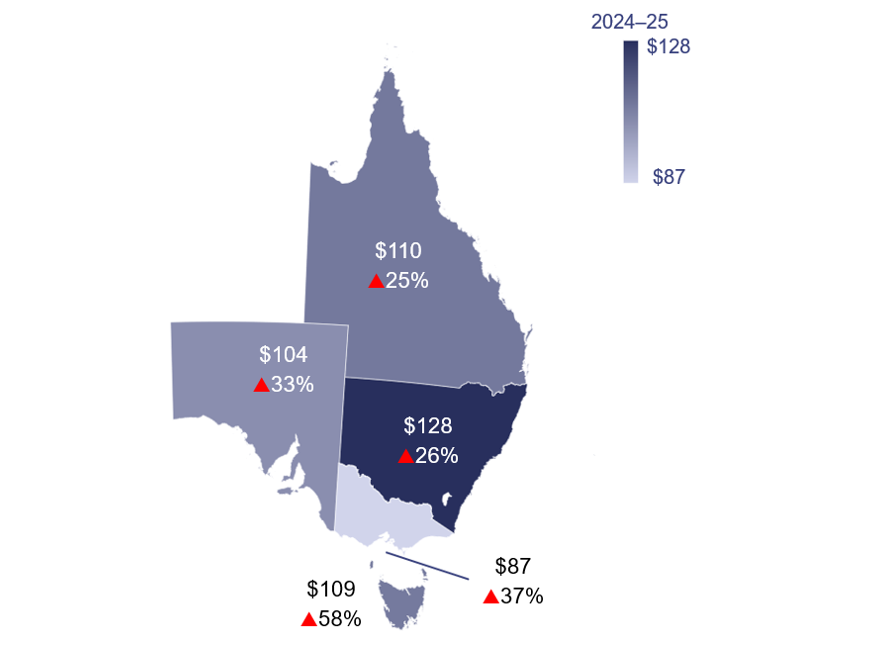
In 2024–25, average wholesale NEM prices increased by 35.8 per cent from 2023–24. Queensland’s average wholesale price increased by $22 per megawatt hour (24.8 per cent).
The wholesale price increase was driven by:
- reduced availability from planned and unplanned outages of power stations across Queensland, including outages at Callide B, Callide C, and Swanbank E
- weather conditions during spring and summer, including high heat and humidity
- a colder start to winter 2025, with minimum and maximum temperatures in June 2025 3 degrees cooler than in 2024.
Appendix H – Figure H1 outlines average wholesale prices over the past 5 years.
Compiled by the Queensland Audit Office from Australian Energy Market Operator pricing data, extracted 3 July 2025.
Renewable energy generation is steadily increasing
Queensland continues to increase its use of renewables to generate electricity. Figure 4E highlights the increasing proportion of Queensland’s generation that comes from renewable sources. It also shows that coal is still the main source of energy in Queensland, with 63 per cent of generation using that source.
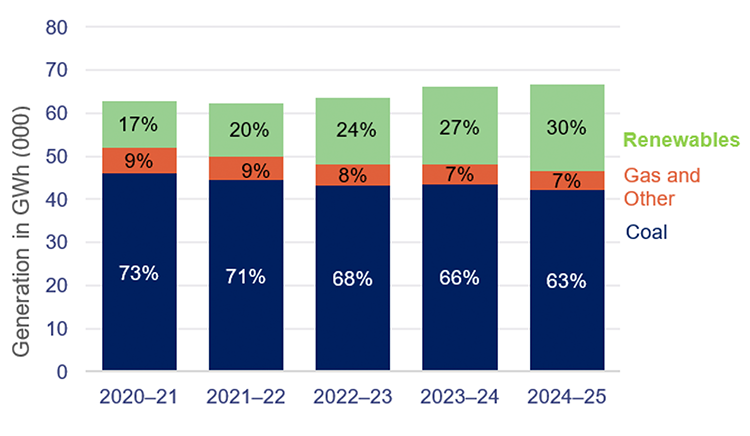
Coal-fired generation remains the primary source of electricity in Queensland. However, coal has decreased by 10% since 2020–21. This has been matched by an increase in renewables.
Solar, especially rooftop solar, reduces the electricity required from coal power plants during solar-rich times of day. This causes a decrease in wholesale prices during those times.
Gas-fired generation has remained stable. During coal-fired outages, gas serves as a key alternative.
Notes:
- GWh – a gigawatt hour, which is equal to 1,000 megawatts of energy used continuously for one hour.
- Renewables in the figure include rooftop solar but exclude battery storage.
Compiled by the Queensland Audit Office from the Australian Energy Market Operator and Open Electricity (the National Energy Market’s information portal) generation data.
Analysis of energy sector expenditure
Total expenditure inclusive of income tax equivalent incurred by energy entities increased to $14,194.9 million (2023–24: $12,831.1 million). The main drivers for increased expenditure this year included energy costs and employee expenses. Energy entities trade with each other, and in presenting our analysis of the energy sector expenditure, we have not eliminated these transactions between entities.
Energy costs increased
Energy sector entities’ expenditure on transmission charges and electricity purchases increased by 13 per cent to $4,963.4 million (2023–24: $4,384.8 million). Key contributors to this increase were higher wholesale electricity prices driven by the NEM, and higher transmission costs determined by the Australian Energy Regulator.
Generator fuel expenses remained stable
Generator fuel expenses are influenced by long-term coal and gas supply contracts with third parties that provide a stable fuel supply. Additionally, some coal is sourced from mines owned by the generators themselves. In 2024–25, the total fuel expense for generators remained consistent at $690.7 million (2023–24: $680.2 million).
Figure 4F below outlines fuel expenses per GWh for the 3 generators over the past 2 years. CleanCo’s fuel expense per GWh of energy generated decreased as it replaced the 2 gas contracts that expired in April 2024 with lower-cost contracts. Stanwell’s higher fuel costs per GWh was due to higher costs of coal extraction. For CS Energy, higher coal purchase prices and volumes led to increased fuel costs.
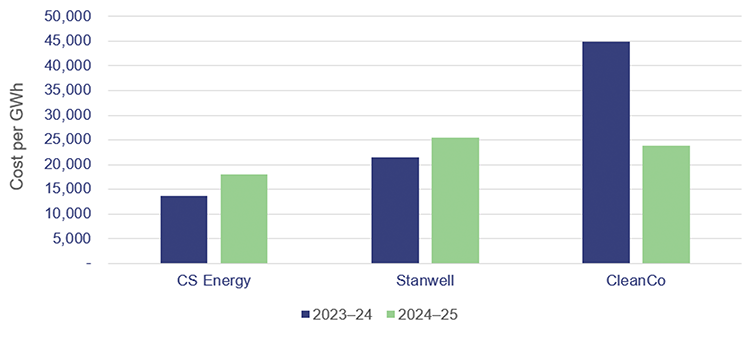
Compiled by the Queensland Audit Office from energy entities’ audited financial statements. Fuel cost per GWh has been calculated as fuel cost divided by energy generated in GWh.
Employee expenses increased
In 2024–25, employee expenses were higher due to salary and wage increases, and an increase in the workforce to support the delivery of new supply and storage projects. Total employee costs in 2024–25 were $2,703.4 million (2024: $2,172.6 million) and the average employee expense per employee was $203 thousand (2023–24: $175 thousand).
At 30 June 2025, energy entities had 13,289 full-time equivalent (FTE) employees, an increase of 7 per cent from 2023–24. The largest employer was Energy Queensland with 9,291 FTE, followed by Powerlink with 1,947 FTE.
Hedging losses and expected losses from debtors increased
Hedging involves using contracts to manage fluctuations in wholesale electricity prices. These contracts usually form part of risk management activities. Entities make profits or losses on those contracts based on the actual movement of wholesale energy market prices. Profits or losses from hedging contracts are either realised or unrealised at the end of each reporting period. Realised profits or losses are those that have been settled in cash, while unrealised profits or losses will be settled at the end of the contract.
In 2024–25, losses on hedging contracts varied:
- Stanwell recognised an unrealised loss of $300.2 million (2023–24: $36.5 million) due to fair value movements in its electricity-related hedge contracts, primarily driven by an unfavourable variance in the market price of large-scale generation certificates.
- Energy Queensland’s net losses decreased by 70.5 per cent to $31.3 million in 2024–25 (2023–24: $106.1 million). Lower volatility in retail electricity markets drove this decrease.
Stanwell has long-term coal supply agreements with a private sector entity (the supplier) and, as at 30 June 2025, the supplier owed $604.2 million to Stanwell. During 2024–25, the supplier’s operations were impacted by lower coal prices and industry-wide increases in operational costs. In response, Stanwell and the supplier amended these agreements to provide the supplier with short-term liquidity support. Stanwell reassessed the risk that the supplier might not repay the full amount owing. This resulted in Stanwell recognising expected losses of $124.0 million, reducing its profitability for 2024–25.
Returns to shareholders decreased
In 2024–25, total returns to the Queensland Government, as shareholder, decreased by 21 per cent to $777.9 million (2023–24: $986.5 million). Returns are made up of income tax equivalents and dividends.
Energy entities returned income tax equivalents of $339.0 million to the Queensland Government. The tax equivalent amounts increased this year despite a decrease in profits, as CS Energy wrote off carried-forward tax losses that were unlikely to be offset against future profits. Figures 4G and 4H summarise the returns to shareholders over the past 5 years.
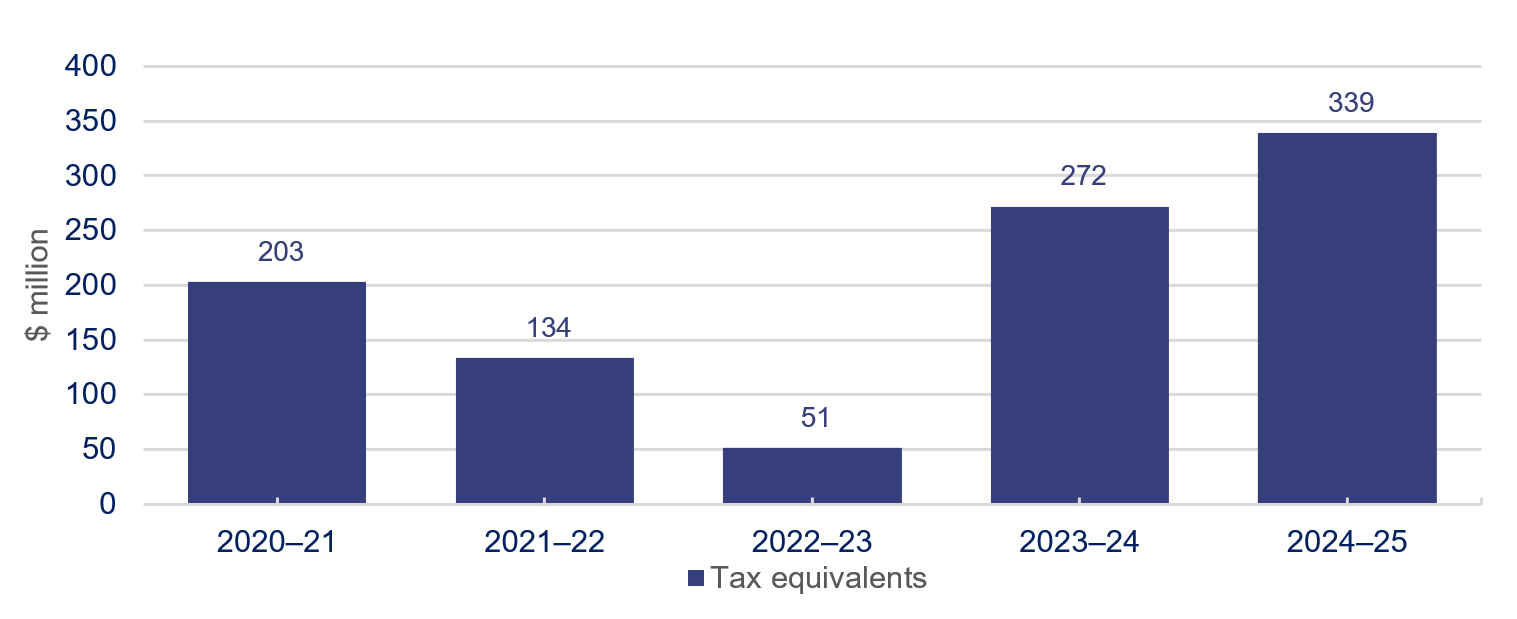
Compiled by the Queensland Audit Office, from energy entities’ audited financial statements.
Returns to shareholders decreased in 2024–25 but remain above the 5-year average. Energy entities normally pay out 100 per cent of their net profit after tax as dividends unless directed by the shareholding ministers. The dividend payments have declined due to lower sector profits.
Over the last 2 years, Stanwell and Powerlink remained the only entities that consistently paid dividends. In 2025, Stanwell paid dividends amounting to $335.9 million (78 per cent) after adjusting for non-cash items such as impairments and unrealised gains and losses. Powerlink paid dividends amounting to $103.0 million (100 per cent).
CleanCo’s profit was adjusted for unrealised gains, which resulted in it not having to pay dividends. All the other energy entities incurred a loss in the current year.
The lower dividends in 2021–22 and 2022–23 are due to entities retaining their profits for investment in energy projects.
Compiled by the Queensland Audit Office, from the energy entities’ audited financial statements.
Cost-of-living rebates are returning to historical averages
Cost-of-living rebates aim to reduce electricity costs for customers through government payments, other subsidies, and incentives to support customers who generate their own solar energy.
Total support to customers amounted to $2,180.8 million in 2024–25, a decrease of 52 per cent from 2023–24, reflecting the timing of the payments by government to retailers and the finalisation of the $1,000 cost-of-living support.
Figure 4I shows the support to customers from 2021–22 to 2024–25. The total support to customers is beginning to return to historical averages in 2024–25.
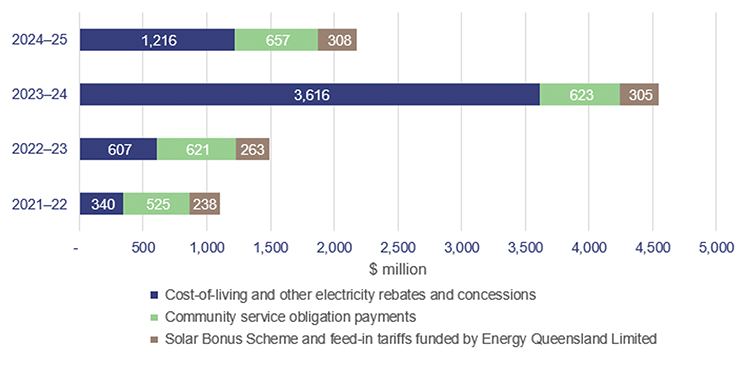
Note: Cost-of-living and other electricity rebates and concessions for 2023–24 have been amended compared to our previous report to include subsidies of $2,003 million paid through the former Department of Treaty, Aboriginal and Torres Strait Islander Partnerships, Communities and the Arts (now called the Department of Women, Aboriginal and Torres Strait Islander Partnerships and Multiculturalism).
Compiled by the Queensland Audit Office from the energy entities’ audited financial statements; data from Queensland Treasury; and data from the Department of Families, Seniors, Disability Services and Child Safety.
Other rebates, subsidies and support payments include:
- The Australian Government is continuing to provide $75 per quarter per household to subsidise their electricity costs until the end of the 2025 calendar year.
- Community service obligation payments subsidise higher supply costs in regional Queensland, with around $657 million paid in 2024–25. The subsidies allow the government to set notified regional electricity prices below the actual supply cost, reducing bills in regional Queensland.
- The Solar Bonus Scheme and feed-in tariffs, including the 44 cents per kilowatt-hour feed-in tariff, continues for eligible rooftop solar customers. The Solar Bonus Scheme is closed to new customers and will end for existing eligible customers on 1 July 2028. Other solar customers receive a lower feed-in tariff rate.
- Vulnerable households remain eligible for the $386.34 electricity rebate from the state government.
Asset performance and reliability
In November 2024, the Queensland Government initiated the Electricity Maintenance Guarantee to improve the maintenance, safety, and long-term reliability of the state-owned power stations. The government:
- through the 2025–26 budget, allocated $1.6 billion dollars over 5 years for the generators to maintain the reliability of their power stations
- set key performance indicators (KPIs) that must be reported quarterly.
Figure 4J summarises the performance of the generators against the KPIs. Appendix I has additional information on these KPIs.
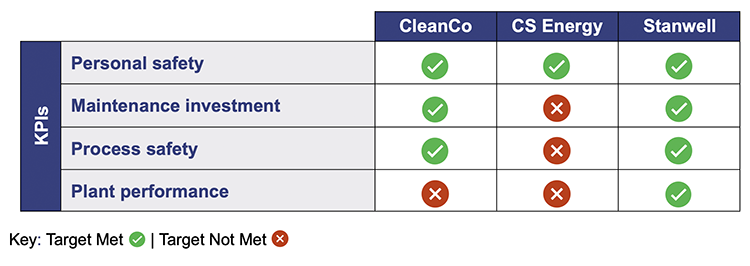
Compiled by the Queensland Audit Office from energy entities’ annual reports and media releases.
CleanCo and CS Energy did not meet all their targets. The KPI on plant performance was impacted by forced outages at Callide C (CS Energy) and at Swanbank and Barron Gorge (CleanCo).
In April 2025, an explosion at Callide C power station left a unit offline for 58 days, which affected CS Energy’s performance against its targets. The event was caused by weak safety systems and risk controls that led to hardened ash (clinker) falling into the ash furnace.
CS Energy did not meet its KPI for maintenance due to:
- statutory maintenance commitments for the March quarter not being met – which was rectified in April 2025
- priority capital works for one quarter not being met. CS Energy conducted an internal audit of 2024–25 KPI metrics to support the implementation. This included a governance review of the reporting process and sample testing of the June 2025 quarter results, which they will follow through in 2025–26.
CS Energy plans to continue investing in systems and processes to strengthen the controls that would enable the entity to meet the KPIs.
Entities’ asset management maturity assessments
We developed an asset management maturity model to help entities strengthen their asset management practices. The model is aligned with minimum requirements under the International Standards Organisation standard 55000 on asset management.
In 2024–25, energy sector entities self-assessed their asset management maturity using our model. As this was a self-assessment, we provide no assurance that the ratings reflect the actual maturity of their approaches.
The average outcome across the energy sector was ‘integrated’, which means asset management practices are fundamentally sound with some areas for improvement. The entity with the lowest maturity level rated itself below the average on all elements. The entity with the highest maturity level had assessed itself as ‘optimised’, suggesting it is a leader of best practice for asset management.
Figure 4K shows the range and overall average of the ratings from the self-assessment by each entity.
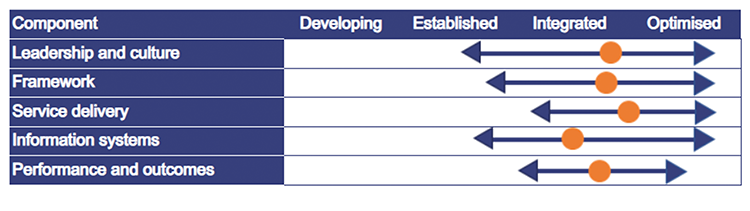
Compiled by the Queensland Audit Office from the asset management maturity model provided by energy entities.
Strengths identified
The entities’ self-assessments identified the following common strengths:
- There was an alignment of leadership oversight, vision, and purpose with asset management objectives.
- Entities had articulated processes in developing their corporate vision, purpose, and business priorities in corporate plans.
Improvement opportunities identified
The entities’ self-assessments identified the following common improvement opportunities:
- Entities can use information and technology systems to better manage their asset data to enhance its accessibility, and its alignment with asset management processes.
- There can be enhancements made to real-time performance monitoring and management reporting.
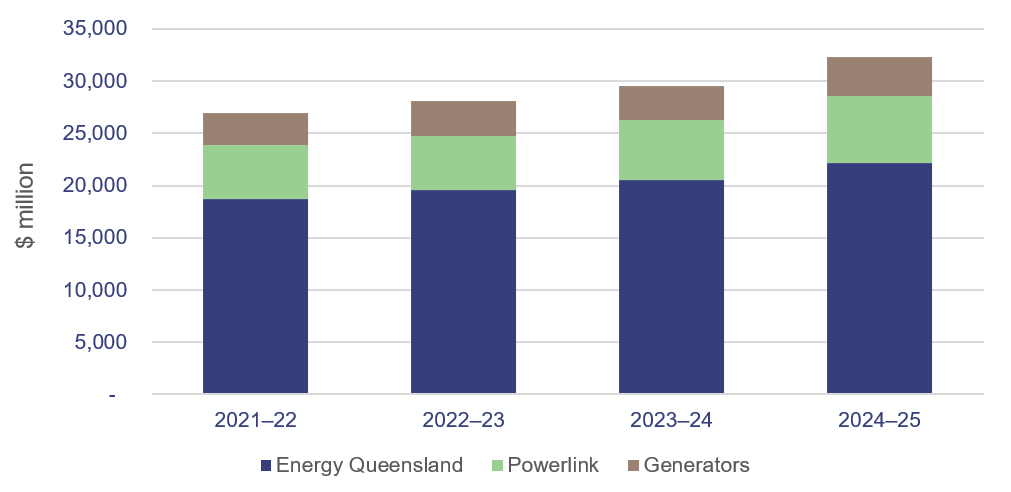
Asset balances are increasing
In 2024–25, energy entities reported property, plant and equipment balances at $45,220.3 million, most of which relate to power stations and network assets. Of these assets, 86.7 per cent were held by transmission and distribution network entities.
Figure 4L summarises the reported balances of power stations, transmission, and distribution network assets.
Compiled by the Queensland Audit Office from energy entities’ audited financial statements.
Assets are reported in the financial statements at cost for generators and fair value (representing the value the asset could be sold for in an arm’s length transaction) for Energy Queensland and Powerlink.
The long-term value of power stations increased
The overall increase in power stations is $882.1 million. This includes the impairment reversal of $411.6 million due to Stanwell extending the useful lives of its assets to reinstate to their technical lives. This impairment reversal represents the expected future use and cashflows exceeding its current cost associated with those assets.
In previous years, generation assets have been impaired and reported at a value in financial statements which was lower than their original cost. Because that assessment changed with the intention to use the power stations for the entire length of their technical lives, some of the value has now been reinstated in the financial statements. The changes are outlined in Figure 4M.
In 2020–21, entities forecasted negative cash flows due to lower electricity prices and higher capital expenditure. Lower cash flows led to an impairment loss of $253.4 mil.
In 2022–23, the useful lives of all state-owned coal fired stations were expected to be retired by 2035. The shortening of useful lives led to an increase in impairment loss to $267.2 mil.
In 2024–25, the Queensland Government announced its plan to invest in the maintenance of generation assets which would result in the plants being used beyond 2035. This resulted in extending the useful lives of their coal-fired power plants by one to 12 years (reflecting a reversion to technical lives).
CS Energy recorded an impairment loss of $82.9 mil. This is mainly due to its investment in Callide B which it will not recover over the life of the power station.
The impairment reversal from the extension of useful lives is not included in this graph as it only represents the impairment losses.
Compiled by the Queensland Audit Office from the energy entities’ audited financial statements.
Fair values increased for transmission and distribution network assets
The fair value of transmission and distribution assets increased by $679.9 million in 2024–25. Energy Queensland and Powerlink report their transmission and distribution network assets at fair value, which is the price an asset would sell for in an open-market transaction between informed, willing participants.
The fair value of assets increased due to changes in the following key assumptions:
- estimated returns (or cashflows) from these assets
- the regulatory asset base – that is, the value of the assets as accepted by the Australian Energy Regulator (AER), which is used to calculate the amounts charged to customers using their assets.
Energy Queensland has spent more on capital and operating expenditure for some of its assets than the AER allowed amount. It has assessed this additional expenditure to be prudent and efficient, which contributed to the increase in asset value.
The increase also relates to the cost incurred for maintaining and extending the network and generation assets.
Acquisition of renewable energy assets
During 2023–24 and 2024–25, the generators continued to acquire the rights to develop wind and solar farms, including:
- Stanwell – Tarong West Wind Farm
- CS Energy – Lotus Creek and Boulder Creek Wind Farms
- CleanCo – Mt Rawdon pumped hydro project (the project is expected to be delivered by Queensland Investment Corporation under the Energy Roadmap).
To date, Queensland government shareholder equity contributions of $599 million have been provided to the generators for some of these projects. This does not represent all of the funding needed to complete the projects.
The rights for development of the assets were either accounted for either as an asset acquisition or financial instruments, depending on the legal arrangements. CleanCo has also acquired accounting control of some entities associated with their developments, requiring them to be included in its financial statements, even though they are not legally owned by CleanCo.
Costs associated with discontinued energy sector projects
Government and the energy entities’ boards may decide to discontinue an energy project based on a range of economic, social, and environmental factors, and in line with the government’s overall energy policy.
In 2024–25, a number of energy projects were discontinued. The costs to date amounted to $296.8 million. Figure 4N shows the costs incurred for the discontinued projects by project type.
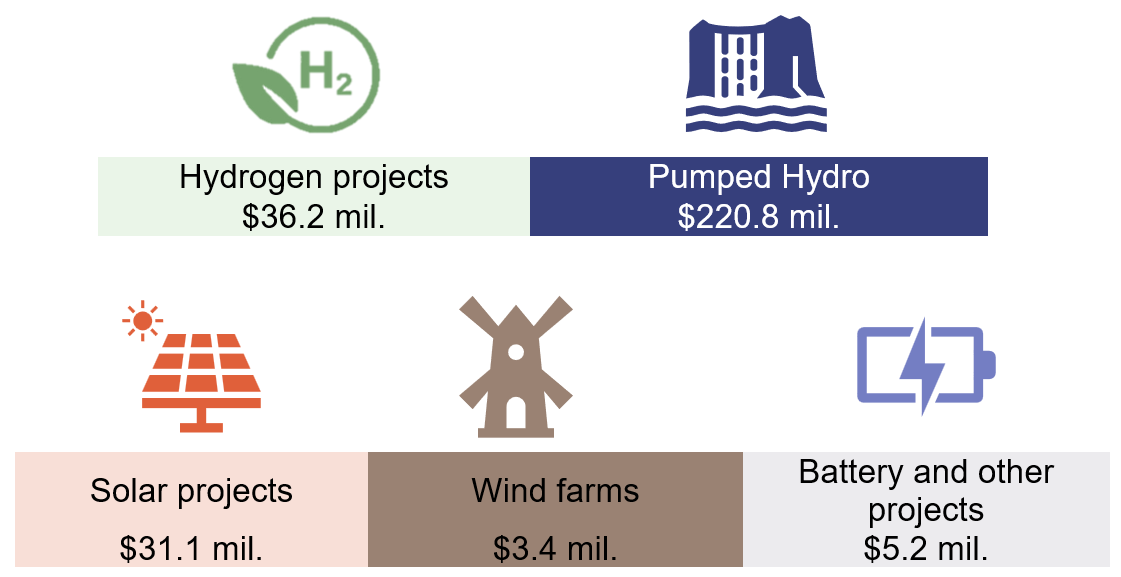
Compiled by the Queensland Audit Office from data provided by energy entities.
Project delivery by Queensland Investment Corporation
In April 2025, the Queensland Government transferred oversight of Queensland Hydro to Queensland Investment Corporation (QIC), with QIC tasked to manage the assessment of the Borumba Pumped Hydro Energy Storage Project. As part of the Energy Roadmap, QIC’s mandate was broadened to include the assessment of other pumped hydro energy storage projects.
QIC will connect investors and developers to lead future investment partnerships with the private sector.
Under the Energy Roadmap, QIC will deliver the CopperString project. Major construction will commence by 2028 starting with the Eastern Link to build a 500kV transmission line from Hughenden to the Burdekin region south of Townsville.
Additional details will be included in our upcoming reports Major projects 2025 (Report 8: 2025–26) and Managing Queensland’s debt and investments 2025.
Borrowings and related costs have increased
In 2024–25, borrowings totalled $32,345.9 million (2023–24: $29,488.6 million). Borrowings, inclusive of lease liabilities, have increased over the last 4 years, mainly due to Powerlink’s and Energy Queensland’s spending on their transmission and distribution network assets.
Energy Queensland and Powerlink are the largest borrowers, due to the size and geographical spread of their network assets. Most of these loans have no fixed repayment period, and they are used to fund investments in generation and network assets. They are also used for short-term financing, which is included in Figure 4O below.
Compiled by the Queensland Audit Office from energy entities’ audited financial statements.
Borrowing expenses have increased and interest cover ratios have decreased
In 2024–25, borrowing expenses increased by $179 million to $1.3 billion due to growth in borrowing levels and higher interest. Over the 4 years from 2021–22, average Queensland Treasury Corporation interest rates increased from 3.4 per cent to 4.2 per cent.
Borrowing expenses include interest paid on loans and leases, administration, and competitive neutrality fees. Interest is affected by interest rates and the size of the borrowings.
The competitive neutrality fees represent a fee paid to remove any competitive advantage a government-owned entity may have by borrowing at a lower interest rate than the private sector.
The interest cover ratios for the generators declined in 2024–25, reflecting reduced capacity to service interest obligations. The interest cover ratio measures a company’s ability to meet interest payments on its debt, calculating the proportion of earnings before interest and tax used to pay for interest. The higher the ratio, the more affordable the interest.
CS Energy and Energy Queensland’s ratios are lower than one, which indicates that interest costs were greater than available earnings. However, they were able to pay the interest on their debts during the year.
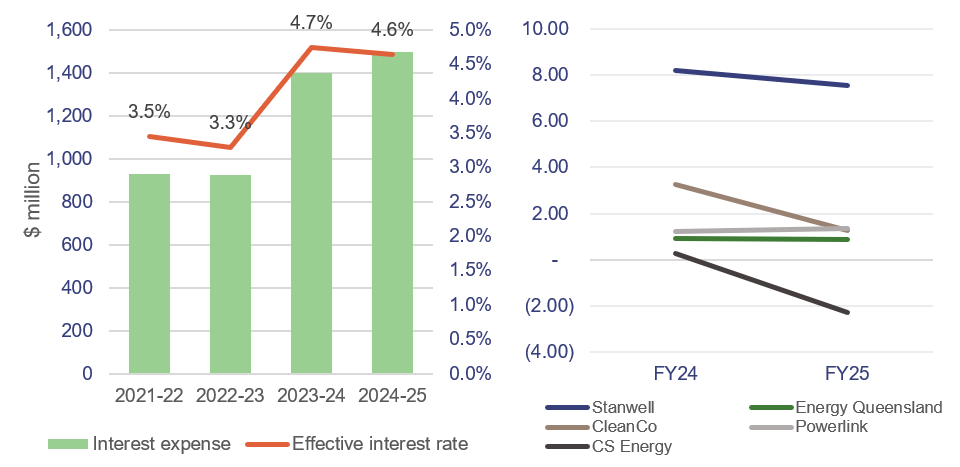
Compiled by the Queensland Audit Office from energy entities’ audited financial statements.
Amount of borrowings compared to assets and equity
CS Energy and CleanCo are highly leveraged, meaning they have a higher debt as a percentage of their assets. However, their debt-to-equity ratios are lower than the other entities, due to shareholders contributing additional capital of $830.0 million (CleanCo) and $1,327.9 million (CS Energy) over the last 4 years to fund energy projects.
CS Energy’s financial performance has been impacted by power station outages, and it needed to fund some of its day-to-day operating activities through additional borrowings. Its losses and reduced cash flow have also impacted compliance with its funding agreements. Consequently, CS Energy currently relies on support from the Queensland Government to meet its financial commitments and its ability to operate as a going concern.
CleanCo’s debt grew to fund renewable and storage projects and business growth.
Current energy sector developments
Energy Roadmap released
The Queensland Government released its Energy Roadmap on 10 October 2025. Under the Energy Roadmap, coal power stations will continue operating for as long as needed in Queensland’s electricity system and supported by the market. The indicative time frames included in the roadmap have scenarios for some power stations to continue running up to 2050. In 2024–25, some generators reinstated their coal power stations to technical lives, which resulted in the increase in the value of the assets. Any further extension of useful lives for the coal power stations will also affect their future values.
The Queensland Government has developed a framework for decision making over operating time frames for state-owned coal power stations. The framework is a decision matrix that considers the need for the stations, their integrity, and their economic viability. This means that there are no specified dates by which the coal power stations will close.
Figure 4Q below summarises some of the key aspects of the Energy Roadmap.
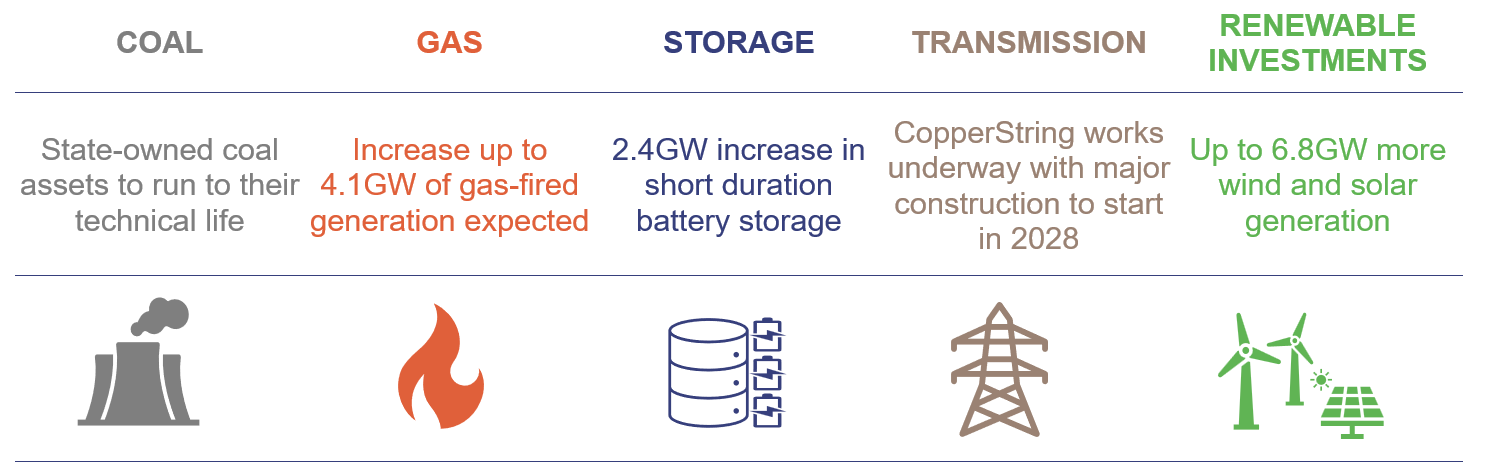
Compiled by the Queensland Audit Office from the Queensland Energy Roadmap.
The impact of the Energy Roadmap on major projects will be detailed in our upcoming reports Major projects 2025 (Report 8: 2025–26) and Managing Queensland’s debt and investments 2025.
Higher network charges will increase customer costs
In April 2025, the AER approved revenues of $17,575 million over 5 years for Energy Queensland, an increase of $5,448 million from the previous 5-year period. The revenues will be earned by its subsidiaries, Energex and Ergon, from 1 July 2025 to 30 June 2030. The AER has estimated that these higher revenues will result in the typical Queensland electricity bill increasing annually by:
- $48 for residential customers
- $97 for small businesses.
Every 5 years, the AER considers transmission and distribution networks’ proposals for regulated revenue they can earn in the form of network charges. The revenue proposal covers a 5-year period and is based on the recovery of expenses, capital costs, and a return on network assets.
Although revenues increased by $5,448 million, the increase is lower than the amounts proposed by Energy Queensland. Energy Queensland sought a higher increase due to growing labour, material, and overhead costs to operate, maintain, and expand the distribution network.
The AER approved $12,390 million of capital and operating expenditures for Energy Queensland for 2025–30, to be recovered from customers through its allowed revenues. This is an increase from the previous AER determination by $4,474 million. Spending above this approved amount will need to be self-funded by Energy Queensland.
Energy entities are at varying stages of climate reporting
Energy entities will prepare their first climate-related financial disclosures in 2025–26.
In 2024–25, the entities undertook readiness work on climate reporting, including assessing the accounting standards’ requirements and reviewing their data quality, existing processes, and controls. Entities are still assessing material climate-related risks and opportunities.

| Opportunities for energy entities – preparedness for climate reporting Entities should:
|
In 2026, we will perform limited assurance engagements over energy entities’ climate reporting.
We will apply a phased approach to assurance over climate reporting, starting with limited assurance and graduating to reasonable assurance from 1 July 2030.